
Sample Mortality Of The Oldest Old Research Paper. Browse other research paper examples and check the list of research paper topics for more inspiration. If you need a religion research paper written according to all the academic standards, you can always turn to our experienced writers for help. This is how your paper can get an A! Feel free to contact our research paper writing service for professional assistance. We offer high-quality assignments for reasonable rates.
Remarkable progress has been made since 1950 in reducing the mortality of the oldest old, i.e., people 80 years old and older. Death rates increase roughly exponentially with age at adult ages but after age 80 the pace of increase decelerates and mortality may level off or even decline after age 110. This research paper reviews theoretical concepts and empirical findings about the causes and demographic consequences of mortality reduction and mortality deceleration.
Academic Writing, Editing, Proofreading, And Problem Solving Services
Get 10% OFF with 24START discount code
1. Reductions In Mortality After Age 80
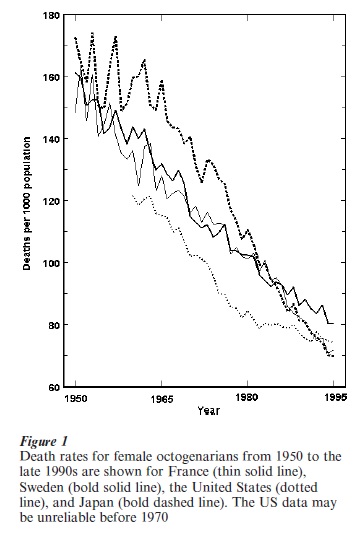
For females in developed countries, central death rates in the period from 1900 to 1950 at ages 85, 90, and 95 were about 0.2, 0.3, and 0.4. By the close of the twentieth century the corresponding death rates were about 0.1, 0.2, and 0.3. Fig. 1 shows the trend in mortality decline since 1950 for female octogenarians in four representative countries: France, Japan, Sweden, and the United States. In Japan the pace of improvement has been particularly rapid.
Male mortality is higher than female mortality even at ages above 100. Analysis of Western European data indicates that the annual average rate of improvement in female death rates since 1950 declined from about 2 percent at age 80 to about 1 percent for centenarians. For males the rate of improvement was roughly constant at oldest-old ages at about 1 percent per year.
Changes in the pace of oldest-old mortality improvement from 1950 to the late 1990s have been analyzed for Western Europe and Japan. For octogenarian females, the rate of reduction, which was about 1 percent per year in the 1950s, accelerated to more than 2 percent per year in the 1990s. Rates of reduction for nonagenarian females and octogenarian and nonagenarian males also roughly doubled, from levels of well under 1 percent per year in the 1950s to levels well above 1 percent per year in the 1990s. Female death rates in Japan since 1970 and France since 1980 have declined at annual rates of about 3 percent for octogenarians and 2 percent for nonagenarians. There is no correlation between levels of mortality and rates of reduction in countries with low oldest-old mortality.
Almost all available data on oldest-old mortality pertain to countries in Europe or to the United States, Canada, Australia, New Zealand, and Japan. Little is known about oldest-old mortality in developing countries, in part because age reports are unreliable. The major exception is China, where acceptably reliable data on the majority Han population has been compiled. In 1990 Han Chinese death rates for men and women in their 80s and 90s were somewhat higher than in Sweden or Japan.
As shown in Fig. 1, oldest-old mortality in the United States has been low compared with most other developed countries but improvements have been slower. The apparent US advantage was generally considered, until recently, to be an artifact of age misreporting. New evidence now indicates that US data for whites are acceptably reliable at least up through ages in the late 90s and at least since 1980. Death rates for the US white population closely match those shown in Fig. 1. Reliable data indicate that oldest-old death rates in Iceland are about the same as shown in Fig. 1 for the United States. It appears that oldest-old death rates in Canada, Australia, and New Zealand may follow a similar pattern.
In Eastern Europe, reductions in oldest-old mortality were relatively small between 1960 and the end of the 1990s, and in some countries in some decades mortality increased, particularly for males. East Germany followed this general pattern until reunification with West Germany in 1990. Thereafter substantial improvements were achieved.
2. Growth Of Oldest-Old Populations
In most countries, both developed and developing, the population above age 80 is rapidly growing, in part because of mortality reductions after age 80. Consider, for example, England and Wales, where the remaining life expectancy of 80-year-old females around 1950 was approximately six years. In the late 1990s, the corresponding figure was nine years and the population of female octogenarians in England and Wales was roughly half again as big as it would have been if mortality after age 80 had remained at 1950 levels. More than a half million females age 80 were alive in England and Wales who would have been dead if mortality after age 80 had not been reduced.
In Western Europe in the late 1990s there were between two and three times as many nonagenarians and about eight times as many centenarians as there would have been if mortality after age 80 had stayed at 1960 levels. In Western Europe, Japan, and China, the population of centenarians has been doubling every decade in recent decades, largely because of mortality improvements after age 80. (Concerns about age misreporting preclude reliable estimation of numbers of centenarians in most other parts of the world, including the United States.) Long-term, highly reliable data for Denmark illustrate the trend. In the decade of the 1870s, an average of three people per year attained age 100. In 1970, this number increased to 43 and in 1999 to 254.
3. The Advancing Frontier Of Survival
Increases in record lifespans are also largely attributable to improvements in survival at the highest ages. In Sweden in the 30 years between 1860 and 1889, no one survived past age 105. The maximum attained lifespan then gradually rose, reaching age 112 in 1994. It is possible in Sweden and other countries with populations of a few million people that no one celebrated their 100th birthday before 1800. Many accounts exist of people living far longer at earlier times, but these accounts are generally fallacious, as are most accounts of centenarians today in most poor countries and some richer ones. A few scattered centenarians may have lived before the nineteenth century, perhaps a handful or less at any point in time. This contrasts with the 100,000 or more centenarians who celebrated the dawn of the twenty-first century.
There were almost certainly no true supercentenarians (individuals aged 110 or above) prior to the mortality decline of the past two centuries. The first reasonably well-documented case of a supercentenarian is Katherine Plunket, who died at the age of 111 in 1932 in Northern Ireland. Jeanne Calment was the first carefully verified instance of a person reaching age 120; she died at the age of 122 years and 5 months in 1997 in France.
4. Age Trajectories Of Oldest-Old Mortality
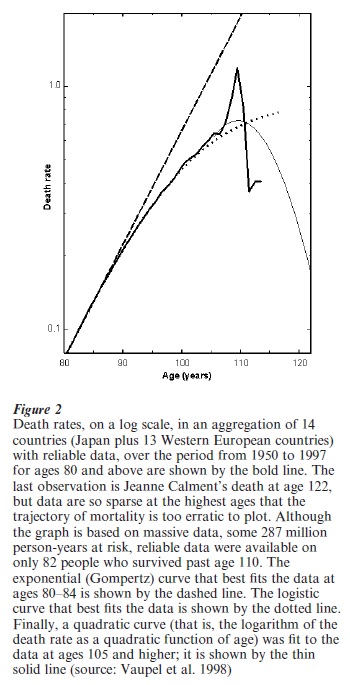
Reliable data on mortality from age 80 to the highest age attained are available for Japan and 13 Western European countries. When these data are pooled, it is possible to accurately estimate the age trajectory of human mortality up to age 105. Reasonable estimates can be made up to age 110 and shakier guesstimates can be boldly ventured up to age 122 by fitting curves to the data. Fig. 2 shows that mortality does not increase exponentially after age 80. Mortality decelerates. Whether mortality is slowing increasing, level, slowly decreasing, or rapidly decreasing after age 110 is uncertain. A logistic curve that fits the data well from age 80 to 105 indicates that death rates may reach a plateau. A quadratic curve fit to the data at ages 105 + suggests a decline in mortality after age 110.
Studies of large populations of yeast, nematode worms, and several species of insects demonstrate that death rates rise at younger ages and level off and in some cases decline at older ages. This pattern also holds for various makes of automobiles.
5. Theories About Oldest-Old Mortality
Thus, the two main research findings in the 1990s concerning oldest-old mortality were: (a) death rates after age 80 declined substantially since 1950, at an accelerating pace, and (b) the increase in mortality with age decelerated at advanced ages for humans, various other species, and even automobiles. These two findings are perplexing. What biological charter permits us (or any other species) to live long post-reproductive lives? A canonical gerontological belief posits genetically determined maximum lifespans. Most sexually reproducing species show signs of senescence with age, and evolutionary biologists have developed theories to account for this. The post-reproductive span of life should be short because there is no selection against deleterious mutations that are not expressed until ages when reproduction and nurturing have ceased. It should be increasingly difficult to reduce death rates with advancing age and mortality should accelerate with age as reproductive activity declines. Because these hypotheses are wrong, theory has to be rethought.
Vaguely related to the biological theory of aging are three widely-held notions:
(a) Deaths at older ages are essentially due to old age, and nothing can be done about old age.
(b) The typical human organism is not constructed to survive much past age 80 or 90.
(c) Causes of death at younger ages are largely extrinsic but causes of death at older ages are mostly intrinsic, and it is very difficult to reduce intrinsic causes of death.
These notions are dubious, ill-defined speculations that are inconsistent with available evidence.
Three biodemographic concepts—mortality correlation, heterogeneity in frailty, and induced demographic schedules—point to promising directions for developing theory.
5.1 Mortality Correlation
Demographers have long known that death rates at different ages are highly correlated across populations and over time. In addition to environmental correlations, there may be genetic correlations: mutations that raise mortality at older ages may do so at younger ages as well. Postreproductive lifespans might be compared with postwarranty survival of equipment. Although living organisms are vastly more complex than manufactured products, they too are bound by engineering constraints that may impose mortality correlations. The trajectory of mortality for automobiles suggests the possibility that both mortality deceleration and mortality correlation are general properties of complicated systems.
5.2 Heterogeneity In Frailty
All populations are heterogeneous. Some individuals are frailer than others, innately or because of acquired weaknesses. The frail tend to suffer high mortality, leaving a select subset of particularly strong or resistant survivors. This creates a fundamental problem for analyses of oldest-old mortality: as a result of compositional change, death rates increase more slowly with age than they would in a homogeneous population.
The leveling off and even decline in mortality can be entirely accounted for by frailty models in which the chance of death for all individuals in the population rises at a constant or increasing rate with age. On the other hand, mortality deceleration could also result from behavioral and physiological changes with age. Research is needed on the relative importance of compositional change vs. individual change in determining oldest-old mortality patterns.
5.3 Induced Demographic Schedules
A key construct underlying evolutionary theory is the Lotka equation, which determines the growth rate of a population or the spread of an advantageous mutation (Charlesworth 1994). The simplistic assumption in the Lotka equation that fertility and survival schedules are fixed is surely wrong. Environments are uncertain and changing. An individual does not face the fixed fertility and survival schedules of stable population theory (Keyfitz 1968), but dynamically adopts alternative schedules as the environment and the individual’s capabilities change. For these and other reasons, Lotka-based theory needs re-thinking. The Lotka equation, however, does capture a fundamental insight: it is reproductive success that is optimized by evolution, not longevity. Deeper understanding of survival at older ages depends on intensified research into the interactions between fertility and survival.
6. Determinants Of Oldest-Old Mortality
Oldest-old mortality is lower for women than men, people born in this century rather than earlier, and people born in rich countries rather than poor ones. Smoking is a health hazard at all ages. Diet is important. The significance of medical treatment and other health care interventions may grow with age.
About a quarter of the variation in adult lifespans appears to be attributable to genetic variation among individuals (Vaupel et al. 1998). Several genes, including the ApoE gene, with polymorphisms that influence oldest-old mortality have been uncovered and there may be hundreds of others that substantially affect oldest-old mortality (Vaupel et al. 1998).
Research in progress suggests that an additional quarter of the variation in lifespans after age 50 may attributable to nongenetic characteristics that are more or less fixed by the time a person reaches age 50. In addition to educational achievement and socio- economic status, month of birth and mother’s and father’s age at a person’s birth influence oldest-old mortality. Women and men who have a baby in their 40s suffer lower mortality at oldest-old ages. Nutrition and infections in utero and early in life have major effects on late-life mortality (Barker 1992, Doblhammer 1999).
7. Forecasts Of Oldest-Old Mortality
Almost all population forecasts made by governmental organizations have assumed slow rates of mortality improvement. Because death rates over the past century have continued to fall at most ages and have been reduced at an accelerating pace at older ages, past forecasts have seriously underestimated progress in increasing survival.
In developed countries large increases in life expectancy depend on substantial reductions in oldest-old mortality. If progress is slow, then period life expectancy at birth in 2050 may be less than 85 in most developed countries. On the other hand, if improvements in French mortality continue in the future at the same pace as in recent decades, half of the baby girls born in France at the end of the twentieth century may survive to celebrate the dawn of the twenty-second century. Note the difference between these two statements. The first pertains to period life expectancy for both sexes combined. The second pertains to median cohort lifespans for French females. Much of the apparent disagreement among demographers about the duration of life in the future arises because different measures and populations are being compared. Real disagreements, however, exist about whether the pace of mortality improvement will persist, further accelerate, or decline over the coming century (Wilmoth 1998).
Bibliography:
- Barker D J P 1992 Fetal and Infant Origins of Adult Disease. BMJ Press, London
- Charlesworth B 1994 Evolution in Age-Structured Populations. Cambridge University Press, Cambridge, UK
- Christensen K, Vaupel J W 1996 Determinants of longevity: genetic, environmental, and medical factors. Journal of Internal Medicine. 240: 333–41
- Doblhammer G 1999 Longevity and month of birth: evidence from Austria and Denmark. Demographic Reseach 1: 3 (text available at http://www.demographic-research.org)
- Hill M E, Preston S H, Rosenwaike I 2000 Age reporting among White Americans aged 85 +. Demography. 37: 175–86
- Jeune B, Vaupel J W (eds.) 1995 Exceptional Longevity: From Prehistory to the Present. Odense University Press, Odense, Denmark (text available at http://www.demogr.mpg.de)
- Jeune B, Vaupel J W (eds.) 1999 Validation of Exceptional Age. Odense University Press, Odense, Denmark (text available at http://www.demogr.mpg.de)
- Kannisto V 1994 Development of Oldest-Old Mortality, 1950– 1990: Evidence from 28 De eloped Countries. Odense University Press, Odense, Denmark (text available at http://www.demogr.mpg.de)
- Kannisto V 1996 The Advancing Frontier of Survival. Odense University Press, Odense, Denmark (text available at http://www.demogr.mpg.de)
- Keyfitz N 1968 Introduction to the Mathematics of Population. Addison-Wesley, Reading, MA
- Manton K G, Vaupel J W 1995 Survival after the Age of 80 in the United States, Sweden, France, England and Japan. New England Journal of Medicine. 333: 1232–5
- Robine J M (ed.) 2001 Special Issue on Longevity. Population
- Robine J M, Vaupel J W, Jeune B, Allard M 1997 Longevity: To the Limits and Beyond. Springer Verlag, Berlin
- Thatcher A R, Kannisto V, Vaupel J W 1998 The Force of Mortality at Ages 80 to 120. Odense University Press, Odense, Denmark (text available at http://www.demogr.mpg.de)
- Vaupel J W, Carey J R, Christensen K, Johnson T E, Yashin A I, Holm N V, Iachine I A, Kannisto V, Khazaeli A A, Liedo P, Longo V D, Zeng Y, Manton K G, Curtsinger J W 1998 Biodemographic trajectories of longevity. Science. 280: 855–60
- Wachter K W, Finch C E 1997 Between Zeus and the Salmon: The Biodemography of Longevity. National Academy Press, Washington, DC
- Wilmoth J R 1998 The future of human longevity: a demographer’s perspective. Science. 280: 395–7
ORDER HIGH QUALITY CUSTOM PAPER

Always on-time

Plagiarism-Free

100% Confidentiality