
Sample Magnetoencephalography Research Paper. Browse other research paper examples and check the list of research paper topics for more inspiration. If you need a research paper written according to all the academic standards, you can always turn to our experienced writers for help. This is how your paper can get an A! Feel free to contact our research paper writing service for professional assistance. We offer high-quality assignments for reasonable rates.
Magnetoencephalography or MEG refers to the recording of the rapidly changing magnetic field produced by cerebral activity. From these recordings, one can determine where and when the brain activity in question takes place. MEG has provided important information about sensory as well as higher-level information processing in the brain. MEG is also finding its way to the hospital, to aid in diagnosis and to inform the brain surgeon about the precise location of the functional cortical areas, so that causing damage to important cortical areas can be avoided.
Academic Writing, Editing, Proofreading, And Problem Solving Services
Get 10% OFF with 24START discount code
With its total noninvasiveness, simple and quick procedures, good accuracy in locating sources, and millisecond-scale time resolution, MEG is a powerful tool for revealing information-processing sequences and their pathologies of the human brain.
1. Background
The first MEG experiment was performed by David Cohen (1968), who recorded the human alpha rhythm using an induction coil with a million turns of copper wire. Variations in the magnetic flux through the coil induced in it a voltage that could be a detected by computing its correlation with the simultaneous electroencephalography (EEG) alpha rhythm.
Previously, the EEG had been used to record signals close akin those obtained with MEG. However, it was exceedingly difficult to determine which brain structures had given rise to the various EEG signal components. It has been subsequently established that MEG is superior to EEG in determining the location of the underlying brain activity.
The emergence of MEG was made possible by technological advances based on groundbreaking discoveries in physics and technology. Superconductivity, discovered in 1911 (Kamerlingh Onnes, Nobel Prize 1913), was theoretically understood only in the 1950s (Bardeen, Cooper, and Schrieffer, Nobel Prize 1972). This understanding led to the discovery of the Josephson junction (Brian Josephson, Nobel Prize 1973), which made it possible to develop extremely sensitive magnetometers. These magnetometers, based on the superconducting quantum interference device (SQUID), were first developed by Zimmerman and colleagues (Cohen et al. 1970). With the SQUID, the human magnetic alpha rhythm could be detected without correlation or averaging techniques (Cohen 1972); the modulation of this occipitally generated waveform by opening and closing the eyes could be observed in real time.
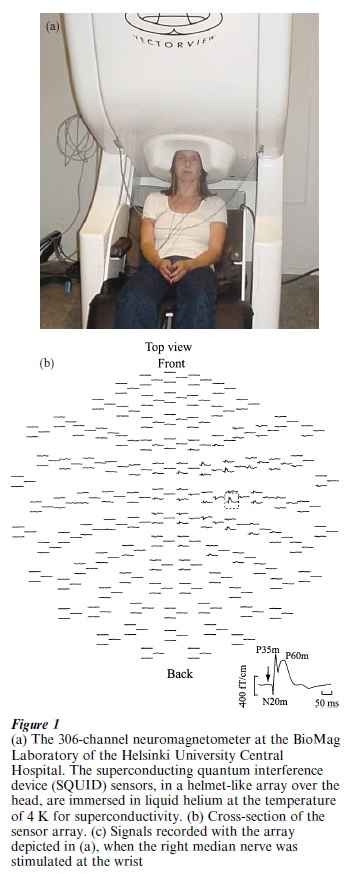
Initially, building and using SQUIDs was very demanding; only single-channel instruments were available. Sensor arrays were finally developed in the 1980s and early 1990s. At present, the complete magnetic field pattern over the head can be recorded with helmet-shaped magnetometers with up to 306 channels (see Fig. 1).
The 1990s saw an enormous development in various techniques of functional imaging of the human brain. At the same time with the emergence of the large MEG arrays, the so-called functional magnetic resonance imaging (f MRI) was invented. This technique allows the mapping of changes in blood volume and blood oxygenation, indicating areas of enhanced brain activity with millimeter spatial resolution. Being completely harmless to the subject, MEG and f MRI have become very attractive tools for functional imaging of the brain and are increasingly used to complement each other so that both a high spatial and a high temporal resolution can be achieved.
2. The Genesis of the Neuromagnetic Field
The magnetic field measured with MEG sensors is produced by electric currents associated with neuronal activity in the brain. When a neuron receives a signal from another neuron at a synapse, an electric current passes through the ion channels that are opened by chemical transmitter molecules. According to the laws of electromagnetism, a magnetic field then encircles the flow of the current. The synaptic currents are weak, on the order of tens of picoamperes (1 pA = 10¯¹²A). Consequently, the extracerebral magnetic field due to a single postsynaptic potential also is very weak: only on the order of attoteslas (1 aT = 10¯¹⁸ T). Many thousands of these postsynaptic currents have to exist synchronously for the magnetic field to be strong enough to be detected even with the best of the instruments.
It is believed that the magnetic field detectable outside the head is produced by currents initiated at the synapses and guided postsynaptically by the cell structure. Magnetic field lines encircle the flow path of this so-called primary current, extending outside the skull. Because pyramidal cells, which are the largest and most abundant cortical neurons, are predominantly oriented perpendicularly to the cortex, the direction of the primary current also is perpendicular to the cortex. Because MEG detects the tangential component of the primary current only, it is most sensitive to activity in fissural cortex, where the current is oriented parallel to the skull, whereas it does not detect sources that are oriented exactly radially.
Therefore, amplitude comparison between differently oriented sources is possible only if source orientations can be estimated, for example, on the basis of MRI or by simultaneously recorded EEG. It should be noted that the electroencephalogram is produced by precisely the same kinds of mechanisms as the magnetoencephalogram. The main differences between MEG and EEG are (a) that their sensitivity patterns are different, i.e., different cortical locations contribute differently to MEG and EEG signals, and (b) that the sensitivity patterns (the ‘lead fields’) of EEG electrodes are less accurately known than those of MEG.
The reliable recording of the weak MEG signals requires the use of shielding against external disturbances. For example, variations in the magnetic field of the earth are a million times stronger than the neuromagnetic fields. The recordings are usually performed inside a magnetically shielded room. Noise cancellation is further improved by measuring gradient components of the magnetic field instead of the field itself. In quiet environments, disturbances can be sufficiently dampened by using elaborate compensation methods to permit MEG work even without shielded rooms.
3. SQUID Magnetometers
A SQUID magnetometer consists of a superconducting loop of wire (the detector coil) connected inductively to the SQUID loop. The SQUID itself is also a loop made of a superconductor. Its operation is based on allowing a bias current to divide into two alternative paths. When each path includes a weak interruption, the so-called Josephson junction, the voltage over the loop will be a function of the magnetic flux through the loop. The voltage is amplified and from it, the magnetic field strength can be determined. Magnetoencephalography is limited in spatial resolution in the sense that it is not possible to discern source-current patterns on length scales below 1–2 cm. Nevertheless, one can locate the effective center-of-gravity of the activity with a precision of about 1 mm.
Since the neuromagnetic field outside the head changes slowly as a function of position, near-perfect sampling density can be achieved with a relatively small number of magnetometer channels. Sampling- theoretical calculations (Ahonen et al. 1993) show that most of the field pattern above the head can be obtained with 100–200 channels. All current commercial whole-head devices offer a sufficient number of channels for nearly complete characterization of the neuromagnetic field above the scalp. Therefore, not much will be gained in the future by increasing the number of measurement channels. However, benefits can be expected from efforts to combine MEG with simultaneous EEG recordings and with f MRI and other supplementary information.
4. Data Analysis
4.1 The Forward Problem
The interpretation of MEG signals requires quantitative understanding of how the electrical currents in the brain produce magnetic fields. This is called the forward problem.
As was pointed out above, neuronal currents are initiated at the synapses and guided postsynaptically by cell structure. The neuronal currents, since ions are moved, change the charge distribution, which, in turn, gives rise to the electric field. The electric field generated in the brain, in its turn, produces passive, so-called volume currents. The volume currents depend on the conductivity structure of the head. The current tends to flow along paths of minimal resistivity. The computation of the complete pattern of electrical currents starting from the active neuronal current (the primary current) requires detailed knowledge of cerebral conductivity and sophisticated finiteelement computations. In practice, however, it usually suffices to model the head as a spherically symmetric conductor (consisting of the brain, the skull, and the scalp); then, the extracerebral magnetic field can be easily calculated. In fact, in the spherical model, the complete extracerebral magnetic field can be directly calculated from the primary current; no knowledge about the thickness and conductivity of the skull or the scalp is required.
4.2 The In erse Problem
The benefit from magnetoencephalography is its ability to locate electrical activity in the brain. In the analysis of neuromagnetic data, it is therefore essential to deal with the inverse problem, i.e., how to determine the internal sources on the basis of measurements performed outside the head. The most common way to tackle this problem is to determine the single source current element (dipole) that most completely explains the MEG pattern.
A current dipole can be thought of as a concentration of primary current to a single point. In MEG applications, a current dipole is used as an equivalent source for unidirectional primary current that may extend over an area of cortex up to several centimeters in diameter. In dipole modeling, the MEG data is interpreted by determining parameters (location, orientation, and amplitude) of a dipole that would best explain the measured signals. This can be done with a computer algorithm that starts from a random dipole position and orientation, and keeps changing these parameters as long as the magnetic field pattern computed from the dipole keeps approaching the experimental one. When no further improvement is obtained, the minimum in the cost function has been reached; a source corresponding to this solution is called the equivalent current dipole (ECD). Dipole fitting is generally done by a computer algorithm that minimizes the sum of squares of the differences of measured signals and those calculated from the dipole. The dipole parameters resulting in minimal discrepancy between measured and calculated signals define the equivalent dipole. The resulting location is near the center of gravity of the underlying activity provided that the active area is small and the primary current, unidirectional.
In cases when a single dipole can not satisfactorily explain the MEG data, one may resort to multidipole modeling. However, the determination of the parameters of several dipoles can be a formidable task as it involves finding a minimum of the sum of squares in a space with the number of dimensions five times the number of dipoles. The algorithm gets easily trapped in a local minimum, which may be far away from the global minimum, corresponding to the actual source locations. In such cases, it may be best to resort to continuous solutions to the inverse problem such as the minimum-norm estimate.
If our prior information of a neural event is limited to knowing that the activity is confined within a specified region of space such as the brain or the cortex, the estimate minimizing the expected error in the inverse-problem solution is the so-called minimum-norm estimate (MNE). This is simply the primary current distribution that has the smallest norm, or overall amplitude, among the current distributions that explain the measurements. MNE was first applied to neuromagnetism by Hamalainen and Ilmoniemi (1994), who realized that estimates of current distributions could be obtained by suitable linear combinations of magnetometer sensitivity patterns called lead fields. The minimum-norm solution provides a faithful projection of the actual primary current distribution on the lead fields; any improvement in the inverse-problem solution from MNE would require the incorporation of supplementary information about the sources.
When interpreting MEG (or EEG) results, it should be borne in mind that the inverse problem is fundamentally nonunique. Even if the complete electric and magnetic field around the head could be precisely measured, an infinite number of current distributions in the brain could still be constructed that would explain the measured fields. For example, it is always possible that some sources are missed, whatever the measurement set-up. MEG alone is insensitive to radially oriented sources, but even when MEG is complemented with EEG, some sources may remain undetected.
Full utilization of available techniques requires the use of estimation theory to derive optimal solutions to the inverse problem based on all available information, including that provided by MEG and EEG, as well by magnetic resonance imaging (MRI), positron emission tomography (PET), and functional MRI (f MRI). Since MEG is insensitive to the radial component of the primary current, it is essential to perform also EEG measurements in order to get as full a picture of cerebral electrical activity as possible.
If one can assume that the electromagnetically detected electrical activity is limited to areas seen in f MRI or just to the cortex, as revealed by the anatomical MRI, then the inverse solution may be constrained so that no primary current is allowed outside the regions given by these techniques (Ahlfors et al. 1999, Korvenoja et al. 1999). The essential point in f MRI is that it yields the locations of activity while MEG (and or EEG) gives the temporal sequence and the strength of activation. On the other hand, f MRI can show enhanced activation in regions not visible by MEG or EEG. The time resolution of f MRI, being limited by the dynamics of blood flow and oxygenation, on the order of seconds.
Accordingly, parallel information from these imaging modalities is now being used to constrain the MEG or EEG inverse solutions to limited regions of the cerebrum. This approach provides optimal combined spatial and temporal resolution by exploiting the best aspects of each technology. The combination of the various imaging methods may eliminate the nonuniqueness of the inversion of MEG and EEG data, at least in some applications.
5. Evoked Magnetic Fields
MEG signals elicited by sensory stimulation were detected first by Brenner et al. (1975) and Teyler et al. (1975), who were able to record the visually evoked magnetic field. Subsequently, the magnetic field evoked by auditory (Reite et al. 1978) and other sensory stimuli followed.
Figure 1b shows the kind of evoked-field data that can be obtained with modern MEG systems. In such an arrangement, by presenting stimuli, it is possible to determine the sequence of activation that takes place in the cortex. In addition to somatosensory evoked signals, activity elicited from other modalities can be detected as well. In the visual modality, even facespecific responses, originating from the parietal and temporal lobes, have been reported. Also, MEG has proved to be the best available noninvasive method for revealing the tonotopic organization of the human auditory cortex (Romani et al. 1982). The N1m deflection (peak latency about 100 ms) in the toneevoked magnetic field, which corresponds to the electrically recorded negative deflection N1 of the event-related potential, was best explained by equivalent current dipoles in tone-frequency-dependent locations of the auditory cortex.
N1m has been reported to show specificity to phonetic features as well. For example, Kuriki and Murase (1989) found that N1m ECDs for speech sounds ka and a differed from one another, with the ka source being located posteriorly to the /a/ source. Interestingly, this difference was obtained in the speech-dominant left hemisphere but not in the right hemisphere, which might indicate that ‘the magnetic responses include a component associated with linguistic processing in the auditory cortex.’ A further step toward constructing a neuroanatomical phoneme map was taken by Diesch et al. (1996) who reported that neuromagnetic responses to different German vowels had different ECD loci and, further, that the distances between these loci seemed to mirror inter-vowel perceptual distances. This finding supports the idea that the self-organizing neuralnetwork phoneme map of Kohonen may be applicable to model the system of cortical phoneme representation.
MEG has also revealed the functional organization of both primary and secondary somatosensory cortices. The human ‘sensory homunculus’ of Penfield and Jasper (1954), obtained by stimulating the exposed somatosensory cortex of awake epileptic patients during surgery, was limited to the convexial cortex. MEG, in turn, is at best in studies of fissural cortex. The somatotopic organization of the primary somatosensory cortex was seen with MEG by Okada et al. (1984) and it was further investigated by Hari et al. (1993) and Yang et al. (1993)
Currently there is considerable interest in plastic changes in the functional organization of cortical sensory-receiving areas. Such experience-dependent changes in the somatosensory system were reflected by MEG recordings of Rossini et al. (1994), who first determined ECDs of an early (‘N22m’) SI response to electrical stimulation of different fingers and thereafter completely anaesthetized four of the fingers. This resulted in the ECD for the unanaesthetized finger shifting in location and becoming stronger. The effect was interpreted by the authors in terms of ‘secondary involvement of neighbor neurons within the hand somatic map which usually belong to the anaesthetized fingers,’ concluding that ‘continuous sensory input from all segments representing a given body district is a prerequisite for normal somatotopic organization’ (p. 24).
Kujala et al.’s (2000) MEG recordings from earlyblinded subjects showed that their occipital cortex is activated during auditory discrimination. This effect, not found in sighted controls, was elicited by occasional, to-be-detected, changes in the frequency of a repetitive tone.
Menning et al. (2000) demonstrated a training effect in the discrimination of frequency differences in the simple sinusoidal tone. Their standard stimulus was 1000 Hz and deviant stimuli 1005, 1010, and 1050 Hz. The frequency discrimination improved rapidly during the first training week and slowly thereafter. This improvement was associated with enhanced N1m, the magnetically recorded response at about 100 ms from tone onset, as well as in the MMNm response. This enhancement persisted even after training although was somewhat decreased 3 weeks after the training.
MEG is not limited to detecting immediate cortical responses to sensory stimuli—it can also (indirectly) reveal memory traces produced by these stimuli. Previous electrophysiological studies have found the mismatch negativity (MMN), an automatic, attentionindependent response to auditory stimulus change, which accurately, albeit indirectly, reflects the properties of stored information, i.e., the neural traces of preceding stimuli (Naatanen 1992). These traces underlying auditory sensory memory can probably be located by determining the sources of the ‘mismatch processes,’ generating MMN. Several studies using simple tones have indicated that MMNm (the magnetic counterpart of MMN) is generated in supratemporal auditory cortex. This also applies to complex stimuli such as withinand between-category changes in consonant–vowel syllables and to frequency changes in a segment of a complex serial tone pattern.
Using the MMN paradigm, Naatanen et al. (1997) obtained evidence for the existence of phoneme traces in Finnish subjects who were presented with the Finnish vowel /e/ as the standard stimulus and the Finnish vowels /ö/ and /o/ and the Estonian /õ/ as deviants. The stimuli differed from each other only in formant F2 frequency, with F0 and other formants remaining constant. The MMN elicited by the Estonian /õ/ was smaller than that elicited by the Finnish /ö/ , even though the acoustical deviation of /õ/ from the standard /e/ was larger than that of /ö/ . This phenomenon did not exist in Estonian subjects, who had been exposed to all these vowels in their mother tongue. MEG recordings showed that the phoneme-related MMN enhancement in the Finnish subjects originated from the left auditory cortex, which was concluded to be the locus of the phoneme traces.
6. Clinical Use of MEG
The noninvasive recording technique of MEG has been used clinically for presurgical mapping, the idea being to locate functional areas, such as the motor cortex or speech areas so that the surgeon may try to avoid harming these (Inoue et al. 1999, Alberstone et al. 2000). Another clinical application is the characterization of epileptic activity (Baumgartner et al. 2000, Minassian et al. 1999), in particular the determination of loci of epileptic activity. This is particularly important when surgery is planned in order to remove the epileptic focus. In children, epileptiform activity has been found to underlie developmental deficits including autism. When characterized with the help of MEG, therapeutic measures can be applied more reliably than without this information.
In addition to clinical applications that benefit the patients themselves, MEG is used in a large variety of studies on different patient groups. For example, Wikstrom et al. (2000) used MEG to correlate recovery from sensorimotor stroke with the appearance of somatosensory evoked responses in MEG. Pekkonen et al. (1999) studied patients with Alzheimer’s disease using MEG and the MMN paradigm, finding impairments in the operation of sensory memory.
7. Conclusion
Magnetoencephalography provides a completely noninvasive tool to probe into the real-time operation of the human brain in experimental conditions that are suitable for studying sensory and cognitive brain functions as well as their disturbances.
In evaluating the future role of MEG in cognitive brain research, it is to be borne in mind that MEG and EEG are the only noninvasive methodologies that provide precise temporal information about the brain activation patterns in its interaction with the environment. Further, of these two methodologies, MEG locates sources considerably more accurately. Of course, this advantage of MEG over EEG only applies to the currents that are visible to MEG, i.e., to those that are not fully radial and not located very deep from the head surface. These limitations, however, should be seen as a strength rather than a weakness of the method, for they could enable one (a) to separately measure a single brain process rather than an amalgamate of multiple temporally overlapping processes which cannot be unequivocally disentangled on the basis of location or orientation, and (b) then, by using this process-specific information, to disambiguate ERP data recorded from the same experimental situation. Therefore, the combined use of the two methodologies is strongly recommended in research aiming at an accurate description of the spatio-temporal activation patterns underlying the brain’s cognitive operations. The use of both MEG and EEG, anticipated also in the current developments of the recording systems, will certainly not be made useless or redundant by further developments of EEG signal-analysis techniques which, because of inherent limitations of EEG methodology, cannot challenge the superiority of the combined use. On the contrary, important developments can be made in the field of signal analysis, especially in view of this combined use of the two methodologies, to make their combination especially powerful and an attractive tool of cognitive brain research, which cannot be replaced by any other methodology in the foreseeable future.
Bibliography:
- Ahlfors S P, Simpson G V, Dale A M, Belliveau J W, Liu A K, Korvenoja A, Virtanen J, Huotilainen M, Tootell R B H, Aronen H J, Ilmoniemi R J 1999 Spatiotemporal activity of a cortical network for processing visual motion revealed by MEG and fMRI. Journal of Neurophysiology 82: 2545–55
- Ahonen AI, Hamalainen M S, Ilmoniemi R J, Kajola M J, Knuutila J E T, Simola J T, Vilkman V T 1993 Sampling theory for neuromagnetic detector arrays. IEEE Transactions of Biomedical Engineering 40: 859–69
- Alberstone C D, Skirboll S L, Benzel E C, Sanders J A, Hart B L, Baldwin N G, Tessman C L, Davis J T, Lee R R 2000 Magnetic source imaging and brain surgery: Presurgical and intraoperative planning in 26 patients. Journal of Neurosurgery 92: 79–90
- Alho K, Huotilainen M, Tiitinen H, Ilmoniemi R J, Knuutila J, Naatanen R 1993 Memory-related processing of complex sound patterns in human auditory cortex: A MEG study. Neuroreport 4: 391–4
- Baumgartner C, Pataraia E, Lindinger G, Deecke L 2000 Neuromagnetic recordings in temporal lobe epilepsy. Journal of Clinical Neurophysiology 17: 177–89
- Brenner D, Williamson S J, Kaufman L 1975 Visually evoked magnetic fields of the human brain. Science 190: 480–2
- Cohen D 1968 Magnetoencephalography: Evidence of magnetic fields produced by alpha-rhythm currents. Science 161: 784–6
- Cohen D, Edelsack E A, Zimmerman J E 1970 Magnetocardiograms taken inside a shielded room with a superconducting point-contact magnetometer. Applied Physics Letters 16: 278–80
- Cohen D 1972 Magnetoencephalography: Detection of the brain’s electrical activity with a superconducting magnetometer. Science 175: 664–6
- Diesch E, Eulitz C, Hampson S, Ross B 1996 The neurotopography of vowels as mirrored by evoked magnetic field measurements. Brain and Language 53: 143–68
- Hamalainen M, Hari R, Ilmoniemi R J, Knuutila J, Lounasmaa O V 1993 Magnetoencephalography—theory, instrumentation, and applications to noninvasive studies of the working human brain. Reviews in Modern Physics 65: 413–97
- Hamalainen M S, Ilmoniemi R J 1994 Interpreting magnetic fields of the brain: Minimumnorm estimates. Medical and Biological Engineering and Computing 32: 35–42
- Hari R, Karhu J, Hamalainen M, Knuutila J, Salonen O, Sams M, Vikman V 1993 Functional organization of the human first and second somatosensory cortices: A neuromagnetic study. European Journal of Neuroscience 5: 724–34
- Inoue T, Shimizu H, Nakasato N, Kumabe T, Yoshimoto T 1999 Accuracy and limitation of functional magnetic resonance imaging for identification of the central sulcus: Comparison with magnetoencephalography in patients with brain tumors. Neuroimage 10: 738–48
- Korvenoja A, Huttunen J, Salli E, Pohjonen H, Martinkauppi S, Palva J M, Lauronen L, Virtanen J, Ilmoniemi R J, Aronen H J 1999 Activation of multiple cortical areas in response to somatosensory stimulation: Combined magnetoencephalographic and functional magnetic resonance imaging. Human Brain Mapping 8: 13–27
- Kuriki S, Murase M 1989 Neuromagnetic study of the auditory responses in right and left hemispheres of the human brain evoked by pure tones and speech sounds. Experimental Brain Research 77: 127–34
- Menning H, Roberts L E, Pantev C 2000 Plastic changes in the auditory cortex induced by intensive frequency discrimination training. Neuroreport 11: 817–22
- Minassian B A, Otsubo H, Weiss S, Elliott I, Rutka J T, Snead O C 3rd 1999 Magnetoencephalographic localization in pediatric epilepsy surgery: Comparison with invasive intracranial electroencephalography. Annals of Neurology 46: 627–33
- Naatanen R 1992 Attention and Brain Function. Lawrence Erlbaum Associates, Hillsdale, NJ
- Naatanen R, Lehtokoski A, Lennes M, Cheour M, Huotilainen M, Iivonen A, Vainio M, Alku P, Ilmoniemi R J, Luuk A, Allik J, Sinkkonen J, Alho K 1997 Language-specific phoneme representations revealed by electric and magnetic brain responses. Nature 385: 432–4
- Okada Y C, Tanenbaum R, Williamson S J, Kaufman L 1984 Somatotopic organization of the human somatosensory cortex revealed by neuromagnetic measurements. Experimental Brain Research 56: 197–205
- Pekkonen E, Jaaskelainen I P, Hietanen M, Huotilainen M, Naatanen R, Ilmoniemi R J, Erkinjuntti T 1999 Impaired preconscious auditory processing and cognitive functions in Alzheimer’s disease. Clinical Neurophysiology 110: 1942–7
- Penfield W, Jasper H 1954 Epilepsy and the Functional Anatomy of the Human Brain. Little, Brown, Boston
- Reite M, Edrich J, Zimmerman J T, Zimmerman J E 1978 Human magnetic auditory evoked fields. Electroencephalography and Clinical Neurophysiology 45: 114–17
- Romani G L, Williamson S J, Kaufman L 1982 Tonotopic organization of the human auditory cortex. Science 216: 1339–40
- Rossini P M, Martino G, Narici L, Pasquarelli A, Peresson M, Pizzella V, Tecchio F, Torrioli G, Romani G L 1994 Short-term brain ‘plasticitiy’ in humans: transient finger representation changes in sensory cortex somatotopy following ischemic anesthesia. Brain Research 642: 169–77
- Teyler T J, Cuffin B N, Cohen D 1975 The visual evoked magnetoencephalogram. Life Science 17: 683–91
- Wikstrom H, Roine R O, Aronen H J, Salonen O, Sinkkonen J, Ilmoniemi R J, Huttunen J 2000 Specific changes in somatosensory evoked magnetic fields during recovery from sensorimotor stroke. Annals of Neurology 47: 353–60
- Yang T T, Gallen C C, Schwartz B J, Bloom F E 1993 Noninvasive somatosensory homunculus mapping in humans by using a large-array biomagnetometer. Proceedings of the National Academy of Sciences of the United States of America 90: 3098–102
ORDER HIGH QUALITY CUSTOM PAPER

Always on-time

Plagiarism-Free

100% Confidentiality