
Sample Neuroanatomy Research Paper. Browse other research paper examples and check the list of research paper topics for more inspiration. If you need a religion research paper written according to all the academic standards, you can always turn to our experienced writers for help. This is how your paper can get an A! Feel free to contact our research paper writing service for professional assistance. We offer high-quality assignments for reasonable rates.
Neuroanatomy investigates neural structure, with the motivation of deducing and formulating general organizational principles, mechanisms, and structural–functional correlations. It includes several subdisciplines, which deal with normal organization, experimentally or pathologically induced changes, developmental processes, or comparative species differences.
Academic Writing, Editing, Proofreading, And Problem Solving Services
Get 10% OFF with 24START discount code
Data analysis relies heavily on visualization, at either light or electron microscopic magnifications (respectively, up to × 1000 or × 100 000). Sometimes, exciting observations can result from ‘just looking.’ One example could be the discovery of the ‘barrel field’ of rodent somatosensory cortex, where there is a one-to-one mapping of snout whiskers and cortical cell groups (‘barrels’). Much more typically, however, the relationship between structure and function is not straightforward. Only after years of work with combined anatomical and other techniques, can moderately good understanding be achieved; for example, how neuron geometry influences the conduction of the nerve impulse. For questions as complicated as ‘what are the neural substrates of higher order complex behaviors,’ our understanding is still at an early stage. Because of the need for microscopic magnifications, neuroanatomical techniques are often invasive and require chemical fixation of brain tissue, thin sectioning via microtome, and histological processing for various markers. Recently, non-invasive imaging techniques such as functional magnetic resonance (fMRI) are becoming more commonly available. Used in combination with sophisticated stimuli, these provide unprecedented visualization of functional networks in the human brain.
In this research paper, we give a brief overview of basic techniques that are used to investigate neural structure at different levels of organization. The first five sections cover single neurons, neuron populations, connections, microcircuitry, and functional groups. Each section includes some treatment of historical developments, examples of applications, and comments on limitations. The sixth section is on neuroanatomy of the human brain, and the last section reviews some of the most recent technical developments. For further details, we refer the interested reader to the more specialized works listed in the references.
1. Nerve Cell
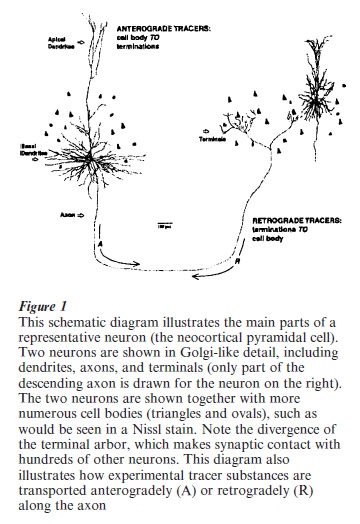
The structure of nerve cells (‘neurons’) is complex. There is the cell body or soma and, for most neurons, two types of specialized processes (Fig 1 ). Dendrites (Greek dendron, tree) are thin-caliber extensions of the cell body that receive input, via synaptic contacts, from other neurons. The dendritic tree or arbor is confined mainly to the immediate vicinity of the cell body and, depending on the type of neuron, does not extend beyond 0.25–2.00 mm. The axon (Greek axon, axis) is a single, thinner filament-like process, specialized for conduction of the nerve impulse. It conveys output from a given neuron by making synaptic contact with hundreds or even thousands of other neurons. For some neurons (interneurons or local circuit neurons), the axon arbor is small and about the same diameter as the dendritic tree ( 0.25–0.50 mm). For projection neurons, however, the axon can be quite long, in the range of many centimeters. Examples of long distance projections are axons crossing between the two cerebral hemispheres in the corpus callosum, and axons originating from neurons in motor cortex and projecting into the spinal cord.
Understanding even the basic structure of the nerve cell was long hindered by the delicacy of brain tissue and the complex shapes of the dendritic and axonal specializations. Early histologicial techniques could not distinguish the relationship of the soma, dendrites, and axons; and one interpretation, current in the late nineteenth century, was that nerve ‘cells’ were nodes, perhaps serving a nutritive function, embedded within a continuous reticulum of nerve fibers (Van der Loos 1967).
The first routine demonstration of nerve cell morphology was almost accidentally achieved by a silver dichromate stain, where small blocks of tissue (not more than 5–10 mm in one dimension) are successively immersed in solutions of potassium dichromate and silver nitrate. The procedure was originally intended as a way to preserve and harden nerve tissue so that it could be thinly sliced and viewed under the light microscope. Unexpectedly, owing to the argyllophilic properties of nerve cells, the procedure also resulted in the deposition of black silver particles throughout the soma and dendritic arbor. This is the ‘Golgi stain,’ discovered by Camillo Golgi in 1873. It was used to spectacular advantage over the next decades by both Golgi and Ramon y Cajal, who shared the Nobel Prize in 1906 for their major contributions to functional neuroanatomy.
The mechanism of the Golgi stain is to this day not well understood, as only a small proportion of nerve cells are silver-impregnated, and which cells are stained is not predictable. Axons are even less reliably stained. They cannot be visualized at all with this method once they become myelinated, and any Golgi study of axons must be carried out on young brains.
Since its discovery, the Golgi stain has remained important in investigations of normative structure and of structural changes associated with development, pathology, or plasticity. It is also useful for investigations of neuronal structure in postmortem human brains. It has, however, otherwise been superceded by more controllable techniques.
One newer technique is intracellular injections of tracers (such as biocytin, neurobiotin, or horseradish peroxidase). This method often requires electrophysiological localization of the target neuron, and thus gives precise data about the physiological response properties of a neuron in correlation with its morphology. The soma and entire dendritic arbor are demonstrated, and at least the proximal portion of the axon. Intracellular filling can be achieved either in vivo or in itro, and has been a basic tool in functional classifications of neuron types; for example, the different subcategories of bipolar, amacrine, and ganglion cells in the retina. The principal limitation of this technique is the difficulty in making up a large sample size.
For fine cellular and subcellular details, the high magnification of electron microscopy is required (see Peters et al. 1991, Guillery 2000).
2. Neuronal Populations
Nissl stains (named for the histologist Franz Nissl) bind to acidic elements within the cell, and reveal cell bodies and sometimes the proximal dendrites. They reveal all the cells in a given piece of tissue, including the glia. They are used to help demarcate subcortical nuclei and cortical areas. They are also commonly used for deriving cell counts (‘stereology’).
Early investigations of brain structure relied extensively on Nissl stains, sometimes in conjunction with the complementary myelin stains. Differences in cell density and size formed the basis for the ‘architectonic’ maps of cerebral cortex, constructed by Brodmann, O. and C. Vogt, Von Economo, and other workers in the first part of the twentieth century (see Braak 1980). These parcellations have been subjected to considerable dispute and even ridicule; but have gained renewed interest and relevance, especially because of the focal activation patterns resulting from functional imaging experiments (fMRI and PET).
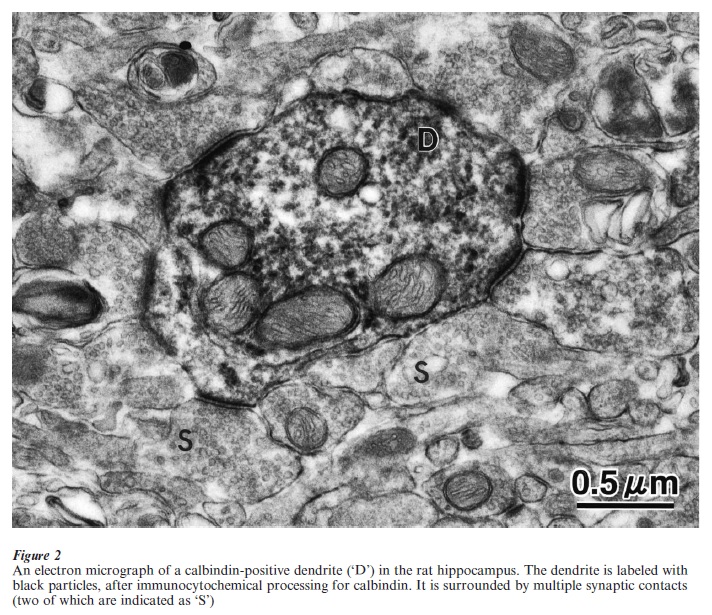
Another, newer method for revealing specific subpopulations is immunocytochemistry. There is now a large assortment of commercially available antibodies; for example, against structural proteins, such as neurofilaments or microtubule-associated-proteins; against transmitters (glutamate; GABA; dopamine) or neuropeptides and calcium-binding proteins (somatostatin, calbindin, parvalbumin, calretinin); against synaptic components (synaptophysin, synapsin); against receptors (glutamate; GABA). Immunocytochemisty involves a series of steps, where thinly cut tissue sections ( 50 µm) are transferred through solutions containing different concentrations of a primary antibody and then a secondary antibody (for example, anti-GABA made in rabbit, and anti-rabbit made in goat, mouse or some other host animal). The secondary antibody might carry a fluorescent tag, so that the end result is visible by fluorescent microscopy. Since a fluorescent signal tends to fade, another procedure uses a secondary antibody tagged with biotin. After several other steps, this results in a brown or black reaction product that labels the original protein.
Histochemistry is a somewhat related technique, where various chromogen markers (frequently diaminobenzidene dihydrochloride, DAB) are deposited as the end product of an enzymatic reaction, and thus reveal cells and/or processes positive for certain substances. Acetylcholinesterase reactions, for example, have been used to chart neurons and/or terminations positive for the neurotransmitter acetylcholine. (Antibodies against acetylcholine are now more commonly used for this purpose.) Cytochrome oxidase reactions show neurons and/or processes with high levels of this mitochondrial enzyme, which is part of the Krebs cycle and therefore an indicator for high levels of metabolic activity.
3. Connectivity
Neurons receive connections from and project to hundreds or thousands of other neurons; and a key step in understanding neural function is characterizing these connections. A surprising number of connections were correctly inferred by close analysis of Golgistained tissue, by Cajal and Golgi. Other early observations came from pathological conditions or ‘experiments of nature.’ For example, neuron death in motor cortex after large lesions or strokes results in degenerated corticospinal axons. This could be detected by myelin stains in postmortem histological preparations and used to correctly infer the subcortical pathways. Or localized lesions could be made in experimental animals. In some conditions, this would result in cell shrinkage or cell loss (retrograde or ‘Wallerian’ degeneration) in other interconnected structures; for example, thalamic neurons might degenerate if their cortical targets were destroyed. Because neurons often send axon collaterals to two or more structures, however, degeneration would not always result, and this method was notoriously difficult to interpret.
The first controlled method for investigating longdistance connections again capitalized on the argyllophilic properties of neurons. Degenerating fibers were produced in animal models by making small lesions in particular structures by suction or heat. (These and other experimental procedures are performed with animals that have been deeply and humanely anesthetized, and are carefully carried out under sterile conditions. Protocols are always subject to institutional approval and monitoring.) Without the nutritive support from the parent cells, over a short time, there is large-scale degeneration of axons originating from the lesioned area. After the brain is perfused with fixatives and thinly sectioned ( < 50 µm), the tissue is reacted in a series of solutions. Degenerating axons are selectively seen as silver blackened particles, and can be followed, under the light microscope, from the lesion site to its target structures.
In the 1970s, the lesion-degeneration method was replaced by several much superior techniques, which were based on the physiological processes of ax on transport (Fig 1). Anterograde tracers, such as 3H-amino acids and WGA-HRP were injected in small, microliter amounts, taken-up by cell bodies and dendrites, incorporated into various protein compartments, and transported down the axon to its distal terminations. Retrograde tracers, such as horseradish peroxidase (HRP), were similarly injected in microliter amounts, taken up by nerve terminals, and transported ‘upstream’ through an axon to the cell body. Anterogradely labeled terminations are detected as brown or blue dots ( WGA-HRP reacted histochemically with DAB or TMB as chromogen); or, in autoradiography ( photographic film or emulsion developed by radioactive tritium), as black silver grains. Retrogradely labeled cell bodies appear colored as brown, black, or blue after histochemical processing. These are both sensitive, reliable techniques, which are used to determine the projections originating from a given structure (anterograde tracers: structure A → targets x,y,z) and those structures which project to a given region (retrograde tracers: structures x,y,z → target A). Additional information is provided concerning the locations, number, and sometimes type of parent neurons (retrograde tracers) and their terminations (anterograde tracers).
HRP and WGA-HRP are still used in connectivity studies, along with several other newer retrograde tracers (fluorescent dyes, such as ‘fast blue’ and ‘diamidino yellow,’ and a modified form of cholera toxin). Autoradiography has itself been largely replaced by other anterogradely transported tracers such as biocytin, kidney bean lectin, biotinylated dextran amino, or fluoro-ruby. These newer anterograde tracers are non-radioactive and therefore easier to use. (They are visualized by a final histochemical reaction with DAB or other chromogen, after histological reactions with a complex called avidin-biotinylated HRP.) They also have a higher resolution, producing a Golgi-like image of the entire axon and its terminations (in contrast with the cloud silver grains in autoradiography).
These techniques have been used to chart the basic connectivity (‘wiring diagram’) of different brain regions and functional pathways (see also, Kobbert et al. 2000). The dataset is still incomplete, however, and very little is known about connectional interactions, either structurally or functionally. Another problem is that the available techniques have a necessary but artificial duality implied by the paradigm of ‘injection sites’ and ‘projection zones.’ This tends to overlook the possible importance of indirect pathways and loops.
4. Microcircuitry
Knowing the overall connectivity (inputs and outputs) of different brain structures is important, but this needs to be followed-up by other studies to define the functional microcircuitry at the synaptic level. In some structures—such as the retina, cerebellum, spinal cord, sensory thalamic nuclei, basal ganglia—there is a considerable amount of detailed information about synaptic types, and postsynaptic locations; but in many structures, such as primate association cortex, this information is very incomplete.
Investigations at the level of microcircuity are difficult for several reasons. First, there must be a way of identifying presynaptic inputs and their postsynaptic cellular targets. Even now, despite the availability of a much larger choice of labels, experiments are usually limited to two or at most three labels. Second, microcircuity depends on a confident identification of synaptic contacts. What look like close contacts between terminal specialization and neurons at the light microscopic level, frequently are not actual contacts. These need to be verified at the higher magnifications of electron microscopy or, with special controls, with confocal microscopy. These methods are extremely labor intensive and slow. Third, in many structures, the circuitry may be dynamic rather than fixed. A typical neocortical neuron, for example, has been estimated to receive 6000 inputs. The combination and integration of this connectional set can differ, depending on factors such as internal state, external context, and the nature of a stimulus. A common distinction is between ‘driving’ and ‘modulatory’ inputs. In some instances, these can be distinguished on the basis of synaptic location and/or size: large synapses located on or near the cell soma are likely to be more ‘effective’ than small synapses located at dendritic tips. There are, however, many exceptions to this principle, and considerable further work is necessary. Combined anatomical–physiological studies in tissue slices are one current approach to structural–functional characteristics at the microcircuitry level.
5. Functional Networks
There are several anatomical techniques for visualizing the activity of large populations of neurons. In animal models, one of the most direct methods is 2-deoxyglucose (2-DG) autoradiography. In this technique, anesthetized animals are given defined stimuli, such as monocular visual stimulations, repeated somatosensory stimulations, or pure auditory tones. Neurons that are selectively sensitive to these stimuli are expected to require higher amounts of glucose to support their higher activity. If the subject is intravenously injected with radioactive deoxyglucose, the label should be taken up by the more responsive neurons. The network of responsive neurons is visualized after histological processing. This technique was developed by L. Sokoloff and collaborators in the late 1970s, before the use of PET scans or fMRI. It offers excellent resolution and also is compatible with other experimental manipulations.
Increasingly, however, 2-DG has been replaced by other activity markers. Early immediate genes like c-fos, jun, and zipf268 can be ‘turned on’ by defined stimuli (Morgan and Curran 1995). The responding neurons can be visualized by in situ hybridization for the mRNA, or by immunocytochemistry against the protein products. As compared with 2-DG, these newer methods have better resolution at the cellular level; and for immunocytochemistry, they do not involve radioactive tags. Another advantage is that in situ hybridization can be used together with immunocytochemistry to compare the responses to two different events at different times (respectively, very short for mRNA expression, and slightly longer for protein expression). The disadvantage of these methods, which they share with other activity-related markers, is the necessity for rigorous controls that the signal is in fact linked to the specific stimulation paradigm and not activated by some other side condition.
At longer time scales, of days or months, many other substances can change in response to environmental or other manipulations. These include cytochrome oxidase, a mitochondrial enzyme associated with metabolic demand; the inhibitory transmitter GABA; and various receptor molecules. These changes are assayed by histological processing and compared with baseline levels in normal controls.
In this section, it is worth mentioning as a comparison, multiple electrode arrays. These arrays are another means of investigating functional networks, although they are still limited in terms of how many neurons can be monitored ( 100). In contrast with more anatomical techniques, they have the advantage of providing physiological response properties, but are so far less advantageous for localization.
6. Neuroanatomy In Humans
Because so much of neuroanatomy requires invasive techniques and terminal experiments, most data have been derived from animal models. More direct research on the human brain would be preferable, given the likely species differences even between humans and subhuman primates, and the specialization of the human brain for language, abstract calculation, and other higher cognitive functions.
Recently, the development of noninvasive fMRI imaging has allowed rapid progress in the investigation of functional networks in the human brain (see Frackowiak et al. 1997). These experiments reveal brain areas activated or deactivated by controlled stimuli. Typically, the results are tabulated as lists, however; and the interpretation of network relationships and anatomical substrates is still difficult, depending, for validation, on extrapolations from animal experiments.
Standard connectivity experiments, which require injection of tracer substances into brain tissue and perfusion of the brain for histological processing, are obviously not possible. Two modifications have been used with limited success. One is to stain for degenerating fibers (following the early lesion-degeneration techniques) in postmortem brains that had sustained localized damage at some time before death (e.g., by stroke or loss of vision). The callosal connections between cortical visual areas have been studied in this way, and the resulting patterns validated to some extent by comparisons with animal models (Zilles and Clarke 1997).
A second tracer that can be used in postmortem tissue is carbocyanine dye, which is lipophilic and will be transported by diffusion along fiber pathways. DiI has been used in several studies to demonstrate intrinsic connections. An interhemispheric asymmetry has recently been suggested in the columnar structure of left and right human temporal cortex, on the basis of differential patterns of DiI-labeled intrinsic connections (Galuske et al. 2000, Gazzaniga 2000). Unfortunately, DiI travels over only a relatively short distance (about 5.0 mm), and even this takes weeks or months. Thus, unless some modification can be found, it is not suited for investigation of the long extrinsic connections.
Golgi stains can be applied to human tissue; but, as in animal brains, these work in a somewhat arbitrary fashion, and, in particular, are not satisfactory for studies of long distance connections.
In contrast with the severe limitations of connectivity experiments, immunocytochemical techniques have been applied to human tissue with considerable success. Antibodies against neurofilaments, neurotransmitters, and many receptors have been used almost as routinely as in animal preparations, although the rather long postmortem delays before tissue fixation (3–18 h) are not optimal.
EM has also been carried out in postmortem human tissue or biopsy specimens. There is the same problem, of suboptimal tissue preservation, but comparisons with perfused animal preparations have provided validation of results.
7. Modern Techniques
There have been several spectacular advances in recent years, first, in instrumentation. Laser scanning confocal microscope (LSCM), by greatly improving the resolution of images stained with fluorescent dyes, has positively impacted on immunohistochemistry, in situ hybridization histochemistry, intracellular labeling, and tract tracing. The remarkable theoretical and technical progress in this field is based on an insight of Marvin Minsky on the confocal optical system in 1957 (for an overview of confocal microscopy, see Paddock 1999, Pawley 1995). In brief, signals are acquired from tissue sections from a focally illuminated scanning plane, through small pinhole apertures positioned on the microscope axis. Using lasers as a light source, sharp images can be obtained and processed by appropriate image-analyzer software for LSCM. This results in the clear demonstration of neuronal morphology, including such fine structures as dendritic spines and synaptic contacts, even though actual synaptic contacts should be confirmed electron microscopically. Reconstructed 3-dimensional and multiple color images from LSCM data are now routinely used.
Another recent development is the 2-photon laser scanning microscope, which utilizes near infrared laser sources with long wavelengths. Deep penetration of light into the tissue and low toxicity of lighting, are the main advantages in 2-photon microscopy.
There has also been continued progress with neuroanatomical techniques, in part, prompted by applications of molecular biology. In situ hybridization histochemistry, for example, detects histologically the expression of genes for functional and compositional molecules in neural tissue. The phenomenon was described by Spiegelman and his collaborators in 1964, i.e., hybridization, between matched nucleotide sequences of dissociated single strands of DNA and RNA in in vitro experiments; and the methods have been rapidly developed since then. Detection probes for mRNAs, fragments of complementary oligonucleotides (cDNAs or cRNAs), are constructed first. These are labeled with radioisotopes (32P, 35S and 3H) or non-radioactive molecules, such as biotin and digoxigenin, which are ‘reporters’ that can describe precisely the location of hybridized nucleotides in question. Hybridized signals in cell bodies are examined with a conventional light or fluorescent microscope. For example, gene expression for receptor subunits of the inhibitory neurotransmitter γ-aminobutyric acid (GABA), is detected in almost all neurons. By combining in situ hybridization with immunohistochemistry, simultaneous detection of a particular gene expression and protein products of other genes in the same tissue can be achieved.
Gene manipulation has also contributed substantially to the development of new types of cell labeling and tract tracing techniques. Genes of extrinsic origin that do not exist in an experimental animal can be used as ‘reporters’ when they are manipulated so as to be co-expressed with genes that are expressed in that animal. Green fluorescent protein (GFP), whose gene was originally cloned from a jellyfish (Aequorea victoria), is available for such a purpose (Praser et al. 1992). Reporter genes can be introduced at an appropriate site of a nucleotide sequence, for example, near a promoter region that is specific for certain types of cells, so that only a targeted subpopulation of cells is labeled with GFP. This technique has been modified to develop an effective transneuronal tract tracing method (Yoshihara et al. 1999). In this modification, not the GFP gene, but the gene for a plant lectin WGA (wheat germ agglutinin) was introduced in transgenic mice with promotor genes (e.g., cerebellar Purkinje cell specific L7). Gene-transferred Purkinje cells pro- duce WGA in the cell bodies, and transport it through the axons to reach target cells. Target cells in the second and third order relay structures are labeled trans-synaptically one after another through a series of neural pathways. This technique is applicable for an analysis of selective connectivity of a particular type of neurons, and for actually visualizing chains of inter- connected neurons.
In addition to reporter gene manipulations described here, various virus vectors (adenovirus, pseudorabies, herpes simplex virus etc.) are also available for introduction of extrinsic genes (Yuste et al. 2000). With these new methods, it is likely that tract tracing for targeted cells will be refined in considerable detail.
Bibliography:
- Bassel A, Hayashi M, Spiegelman S 1964 The enzymatic synthesis of a circular DNA–RNA hybrid. Proceedings of Natural Academy of Science USA 52: 796–804
- Braak H 1980 Architectonics of the Human Telencephalic Cortex. Springer, Berlin
- Frackowiak R S J, Friston K J, Firth C D, Dolan R J, Mazziotta J C 1997 Human Brain Function. Academic Press, San Diego, CA
- Galuske R A W, Schlote W, Bratzke H, Singer W 2000 Inter-hemispheric asymmetries of the modular structure in human temporal cortex. Science 289: 1946–9
- Gazzaniga M S 2000 Regional differences in cortical organization. Science 289: 1887–8
- Guillery R W 2000 Early electron microscopic observations of synaptic structures in the cerebral cortex: A view of the contributions made by George Gray. Trends in Neuroscience 23: 594–8
- Kobbert C, Apps R, Bechmann I, Lanciego L, Mey J, Thanos S 2000 Current concepts in neuroanatomical tracing. Progress in Neurobiology 62: 327–51
- Morgan J I, Curran T 1995 Immediate—early genes: Ten years on. Trends in Neuroscience 18: 66–7
- Paddock S W 1999 Methods in Molecular Biology, Confocal Microscopy Methods and Protocols. Humana Press, Totowa, NJ, Vol. 122
- Pawley J B 1995 Handbook of Biological Confocal Microscopy, 2nd edn. Plenum Press, New York
- Peters A, Palay S L, de Webster H 1991 The Fine Structure of the Nervous System, 3rd edn. Oxford University Press, New York
- Prasher D C, Eckerode V K, Ward W W, Prendergast F G, Cormier M J 1992 Primary structure of the Aequorea Victoria green-fluorescent protein. Gene 111: 229–33
- Van der Loos H 1967 The history of the neuron. In: Hyden H (ed.) The Neuron. Elsevier, Amsterdam
- Yoshihara Y, Mizuno T, Nakahira M, Kawasaki M, Watanabe Y, Kagamiyama H, Jishage K, Ueda O, Suzuki H, Tabuchi K, Sawamoto K, Okano H, Noda T, Mori K 1999 A genetic approach to visualization of multisynaptic neural pathways using plant lectin transgene. Neuron 22: 33–41
- Yuste R, Lanni F, Konnerth A (eds.) 2000 Imaging Neurons. Cold Spring Harbor Press, Cold Spring Harbor, NY
- Zilles K, Clarke S 1997 Architecture, connectivity, and transmitter receptors of human extrastriate visual cortex: Comparison with nonhuman primates. In: Rockland K S, Kaas J H, Peters A (eds.) Cerebral Cortex: Extrastriate Cortex in Primates 12. Plenum Press, New York, pp. 637–742
ORDER HIGH QUALITY CUSTOM PAPER

Always on-time

Plagiarism-Free

100% Confidentiality