
View sample Survey Sampling Methods Research Paper. Browse other research paper examples and check the list of research paper topics for more inspiration. If you need a religion research paper written according to all the academic standards, you can always turn to our experienced writers for help. This is how your paper can get an A! Feel free to contact our research paper writing service for professional assistance. We offer high-quality assignments for reasonable rates.
A survey consists of a number of operations or steps of survey design. The ultimate goal of the survey is to generate estimates of population parameters, based on observations of (a sample of) the units that comprise the population. The design steps can be viewed as a chain of links. The chain is no stronger than its weakest link.
Academic Writing, Editing, Proofreading, And Problem Solving Services
Get 10% OFF with 24START discount code
The steps can be labeled in the following way: (a) Research objectives are defined, i.e., the subject-matter problem is translated into a statistical problem. Researchers must define the target population they want to study and the concepts they wish to measure. Indicators (variables) of the concepts are chosen and eventually, questions are formulated. Problems in this first step usually result in relevance errors, see Hox (1997). (b) A frame of the population is developed. The frame could be a list of population units, a map, or even a set of random numbers that could be used to access a population of individuals with telephones. Coverage errors result when frame units do not completely correspond with population units. (See Groves 1989.) (c) The mode of administrating the survey is chosen. The suitable survey mode depends on budget constraints, topic, and the type of measurement that is being considered. Common modes include face-to-face interviews, telephone interviews, diaries, and administrative records. New modes related to the Internet have recently entered the scene, see Lyberg and Kasprzyk (1991) and Dillman (2000). (d) The questionnaire is developed. For each survey construct, one or more survey questions are developed. Questionnaire development is complicated since the perception of questions varies among respondents and is sensitive to a number of cognitive phenomena. Effects that are treated in the literature include: question wording, question order, order between response alternatives, context, navigational principles, and the influence of interviewers. Many large survey organizations emphasize this step and have created cognitive laboratories to improve their questionnaire work, see Sudman et al. (1996) and Forsyth and Lessler (1991). (e) The sampling design specifies the sampling unit, the method for randomly selecting the sample from the frame, and the sample size. The choice depends on the assumed population variability and the costs of sampling different units, see Sarndal et al. (1992). (f)
Data are collected, i.e., observations or measurements are made of the sampled units. Typically both random and systematic errors occur at this stage, see de Leeuw and Collins (1997). (g) Data are processed. This step is needed to make estimation and tabulation possible, given that only raw data exist. The processing includes editing activities where data consistency and completeness are controlled, entry of data (data capture), and coding of variables, see Lyberg and Kasprzyk(1997).
All design steps are interdependent. A decision regarding one step has an impact on other steps. Thus, several iterations of the above steps of the design process may be necessary before the final design is determined. There follows details of the survey process.
1. Populations And Population Parameters
A population is a set of units. For example, a population might be the inhabitants of a country, the households in a city, or the companies in a sector of industry. The ‘units of study’ are the units used as a basis of the analysis, for example individuals, households, or companies. The ‘target population’ is that particular part of the population about which inference is desired. The ‘study variables’ are the values of the units studied, for example the age of an individual, the disposable income of a household, or the number of employees in a company. The ‘population parameters’ are characteristics of the population, summarizing features of the population, for example the average disposable income for households in a population. Most often interest centers on finding the population parameters for specific subsets of the population such as geographical regions or age groups. The subsets are called ‘domains of study.’
2. Sampling Units, Frames, And Probability Samples
Frequently, statements about some population parameters are problematic because of a lack of time and funding necessary for surveying all units in the population. Instead we have to draw a sample, a subset of the population, and base conclusions on that sample. High quality conclusions concerning the parameter values require care when designing the sample. Assessing the quality of the conclusions made can be accomplished by using a probability sampling design, which is a design such that all units in the population is given a known probability of being included in the sample. Given that knowledge, it is possible to produce estimates of the parameters that are unbiased and of high precision. Moreover it is also possible to estimate the precision of the estimates based on the sample. This is usually in contrast to nonprobability sampling designs where, strictly speaking, the statistical properties of the estimators are unknown unless one is willing to accept distribution assumptions for the variables under study in combination with the sampling design.
Probability sampling requires a frame of sampling units. The units of study in the population can be of different types, such as individuals, households, or companies. Even if the analysis is intended to be based on these units it is often practical or even necessary to group the population units into units that are better suited for sampling. The reason for this can be that, due to imperfect frames, there is no register of the units of study and therefore the units cannot be selected directly. Instead, groups of units can be selected, for example, villages or city blocks, and interviews are conducted with the people in the villages or blocks. Here the sampling unit consists of a cluster of units of study. In many countries, the demarcation of the clusters are based on geographical units identified through areas on maps. Often the clusters are formed to be a suitable workload for an interviewer or enumerator and are called the enumeration area. The enumeration areas are often formed and updated in population censuses. In countries where the telecommunication system is well developed, interviews are often done by telephone. The sampling unit in this case is the cluster of individuals, i.e., the household members that have access to the same telephone.
The frame can take different shapes. For example, a list of N students at a university complete with names and addresses is a frame of students. In this case the sampling units and the units of study are the same. This makes it easy to select a sample of n students by numbering the students from 1 to N and generating n random numbers in a computer. Then we select the students that have the same number as the realized random numbers. Note that in doing so we deliberately introduce randomization through the random number generation. This is in contrast to methods that do not use randomization techniques but act as if data are independent identically distributed random variables regardless of how the data was obtained.
Often, the sampling units are not the same as the study units. If, for example, the units of study are individuals in a country and the target population consists of all individuals living in the country at a specific date, there is seldom a list or data file that contains the individuals. Also the cost of making such a list would be prohibitive.
Using a sequence of frames containing a sequence of sampling units of decreasing sizes can improve this situation. For example, if there exists a list of villages in the country, then this is a frame of primary sampling units. From a sample of villages, a list of all households within the villages selected can be made. This is a frame of secondary sampling units. Note that there is a need for making the list of households only for the villages selected. Using this list, some of the households may be selected for interviews. Thus, a sequence of frames containing a sequence of sampling units has been constructed in a way that permits selection of a probability sample of units of study without enumerating all the individuals in the country. The existence of, or the possibility of, creating reliable frames is a prerequisite for making efficient sampling designs. Often the frame situation will govern the sampling procedure. Ideally the frame should cover the target population and only that population. It should provide the information necessary for contacting the units of study such as names, addresses, telephone numbers, or the like. If there is auxiliary information about the units, it is very practical if it is included in the frame. Auxiliary information is useful for constructing efficient sampling designs. A specific type of frame is used in ‘Random Digit Dialing’ (RDD). When telephone numbers are selected, a common technique is to select numbers by generating them at random in a computer. The frame is the set of numbers that could be generated in the computer. The selection probability of the cluster is proportional to the number of telephones to which the household members have access.
3. Sampling Methods And Estimators
The overall goal is to be able to make (high) quality estimates of the parameters as cheaply as possible. This is implemented using a ‘sampling strategy,’ i.e., a combination of sampling design (a certain combination of sampling methods) and an ‘estimator,’ which is as efficient as possible, i.e., gives the highest precision for a given cost. There exists a variety of sampling methods that can be applied in different situations depending on the circumstances. The most frequently employed sampling methods are:
(a) Simple Random Sampling (SRS). Every unit in the population is given an equal chance of being included in the sample.
(b) Systematic Sampling. Every kth unit in the frame is included in the sample, starting from a randomly selected starting point. The sampling step k is chosen so that the sample has a predetermined size.
(c) Stratified Sampling. The units are grouped together in homogenous groups (strata) and then sampled, for example, using SRS within each group. Stratified sampling is used either for efficiency reasons or to ensure a certain sample size in some domains of study, such as geographical regions or specific age groups. It is necessary to know the values of a stratification variable in advance to be able to create the strata. Stratification is efficient if the stratification variable is related to the variables under study. If the number of units that are being selected within each stratum is proportional to the number of units in the stratum, then this is called proportional allocation. Usually this will give fairly efficient estimates. It can be improved upon using optimal allocation, which requires knowledge of the variability of the study variables or correlated variables within each stratum. In many cases the improvement is small compared to proportional stratification.
(d) Unequal Probability Sampling. This is a method, which can be employed either for efficiency reasons or for sheer necessity. Often the probability of selecting a cluster of units is (or is made to be) proportional to the number of units in the cluster. This is called selecting with probability proportional to size (PPS), with size in this case equal to the number of units. The measure of size can vary. The efficiency of the estimator will increase if the measure of size is related to the study variables.
(e) Multistage Sampling. This is a technique, which is typically used in connection with frame problems.
The above-mentioned sampling methods can be combined to produce good sampling designs. For example, the following is an example of a ‘master sample design’ that is used in some countries. Suppose that the object is to conduct a series of sample surveys concerning employment status, living conditions, and household expenditures. Also suppose that based on a previous census there exist enumeration areas (EAs) for the country, which are reasonably well updated so that approximations of the population sizes are available for each EA. Suppose that it is deemed appropriate to stratify the EAs according to geographical regions both because the government wants these regions as domains of study and because there is reason to believe that the consumption pattern is different within each region. Thus, the stratification of the EAs would serve both purposes, namely controlling the sample sizes for domains of study and presumably being more efficient than SRS. A number of EAs are selected within each stratum. The number of EAs to be selected is chosen to be proportional to the aggregated population figures in the regions according to the most recent census. The EAs are the primary sampling units. If the EAs vary a lot in size it could be efficient to select the EAs with PPS; otherwise SRS could be used.
The EAs so selected, constitute the master sample of primary sampling units that will be kept the same for a number of years. The actual number of years will depend on the migration rate within the regions. From this master sample a number of households are selected each time a new survey is to be conducted. When selecting the households, it is possible to make a new updating of the EAs, i.e., to make a new list of the households living in the area and then select with systematic sampling or SRS a number of households to be interviewed. The households are the secondary sampling units. Often the sampling fractions in the second stage are determined in such a way that the resulting inflation factor for the households is the same. This is called a ‘self-weighting design.’ In principle, a self-weighting design makes it possible to calculate the estimates and the precision of the estimates without a computer.
4. Estimators, Auxiliary Information, And Sample Weights
To each sampling design there corresponds at least one estimator, which is a function of the sample data used for making statements about the parameters. The form of the estimator depends on the sampling design used and also on whether auxiliary information is included in the function. In survey sampling, some auxiliary information is almost always available, i.e., values of concomitant variables known for all units in the population. If this information is correlated to the study variables, it can be used to increase the efficiency of the sampling strategy either by incorporating the information in the sampling method, as in stratification, or in the probability of including the unit in the sample as in PPS, or in adjusting the estimator. A very general form of an estimator is the so-called generalized regression estimator (Cassel et al. 1976), which for estimating the population total takes the form
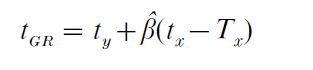
where x denotes the values of the auxiliary variable, Tx the known value of the population total of x, β is the regression coefficient estimated from the sample be- tween x and the study variable y and
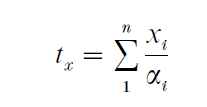
is the so-called Horvitz–Thompson estimator of X, and αi the inclusion probability of unit i. The function ty is the estimator of the unknown value of the parameter. The motivation for using this estimator is based on the conviction that the study variable and the auxiliary variable are linearly related. Thus, this can be seen as one example of the use of models in survey sampling. If the inclusion probabilities are the same for all units, i.e., if αi = (n/N ), then the Horvitz– Thompson estimator becomes the expanded sample mean, which is an unbiased estimator of the population total under the SRS scheme if the expectation is taken with respect to the design properties.
The sample weights are the inflation factors used in the estimator for inflating the sample data. They are usually a function of the inverted values of the inclusion probabilities. In the Horvitz–Thompson estimator, the sample weights are N(αin)−1 . For the sample mean, the sample weights become N/n. As was noted earlier, to each sampling design, there exists an estimator that is natural, i.e., it is unbiased in the design sense. For example, in the case of multistage probability sampling, the sampling weights are functions of the different selection probabilities in each selection step. If the selection probabilities are carefully selected they may form a weight, which is constant for all units in the sample, and the value taken by the estimator can be calculated simply by summing the values of the units in the sample and multiplying the sum by the constant. This is called a ‘self-weighted estimator’ (and design). This technique was important before the breakthrough of the personal computer, because it saved a lot of manual labor but with today’s powerful PCs, it has lost its merits. The generalized regression estimator can be rewritten in the form:
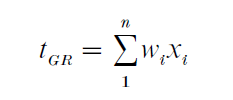
where wi are the sample weights pertinent to unit i for this estimator. The ‘calibration estimator’ is the form of the regression estimator where the sample weights have been adjusted so that tx = Tx. This adjustment causes a small systematic error, which decreases when the sample size increases.
5. Assessing The Quality Of The Estimates—Precision
The quality of the statements depend among other things on the precision of the estimates. Probability sampling supports measurement of the sampling error, since a randomly selected subset of the population is a basis for the estimates. The calculation takes into consideration the randomization induced by the sampling design. Because the design might be complex, the calculation of the precision might be different from what is traditionally used in statistics. For example the variance of the sample mean ys for estimating the population mean y under SRS with replacement is S2/ n where S2 is the population variance, where
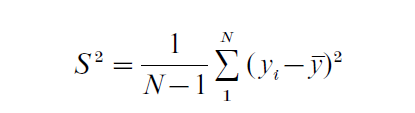
and n is the sample size. This formula is similar to that used in traditional statistical analysis. However for the Horvitz–Thompson estimator, the variance is:
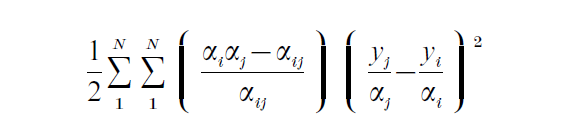
where αij is the joint inclusion probability of units i and j. As can be seen, the calculation of the variance becomes complicated for complicated sampling de- signs, having a large number of selection stages and also unequal selection probabilities in each step. This complexity becomes even more pronounced when estimating population parameters in subgroups where the means are ratios of random variables. However some shortcut methods have been developed: ultimate cluster techniques, Taylor series, jack-knifing, and replications, see Wolter (1985). It is also evident from the formula for the variance that the variance of the Horvitz–Thompson estimator depends on the relation between the values of the study variable y and the inclusion probability α. If the inclusion probability can be made to be approximately proportional to the values of the study variable, then the variance becomes small. That is one reason why much emphasis is put on the existence of auxiliary information in survey sampling. However, as was shown by Godambe (1955) there does not exist a uniformly minimum variance unbiased estimator in survey sampling when inference is restricted to design-based inference.
6. Assessing The Quality Of The Estimates—Total Survey Error
The total survey error can be measured by the mean squared error (MSE), which is the sum of the variance and the squared bias of the estimate. Regular formulas for error estimation do not take all MSE components into account but rather the precision components mentioned above. Basically, a variance formula includes random variation induced by the sampling procedure and the random response variation. Components such as correlated variances induced by interviewers, coders, editors, and others have to be estimated separately and added to the sampling and response variance. The same goes for systematic errors that contribute to the bias. They have to be estimated separately and added, so that a proper estimate of MSE can be obtained.
Often the survey quality is visualized by a confidence interval, based on the estimated precision. Obviously such an interval might be too short because it has not taken the total error into account. Some of the sources of correlated variances and biases can be traced to:
(a) respondents who might have a tendency to, for instance, under-report socially undesirable behaviors;
(b) interviewers who might systematically reformulate certain questions and do so in an interviewer-specific fashion;
(c) respondents who do not participate because they cannot be contacted or they refuse;
(d) incomplete frames resulting in, e.g., under coverage; and
(e) coders who might introduce biased measurements if they tend to erroneously code certain variable descriptions.
There are of course many other possibilities for error to occur in the estimates. There are basically two ways of assessing the quality of estimates: (a) The components of MSE can be estimated—this is a costly and time-consuming operation and (b) by a modeling approach—it might be possible to include, e.g., non-response errors and coverage errors in the assessment formulas. This method’s success depends on the realism of the modeling of the error mechanisms involved.
One should bear in mind, however, that for each survey step there are methods designed to keep the errors small. Systematic use of such known dependable methods decreases the need for evaluation studies or heavy reliance on modeling.
Bibliography:
- Cassel C M, Sarndal C E, Wretman J H 1976 Some results on generalized difference and generalized regression estimation for finite populations. Biometrika 63: 615–20
- De Leeuw E, Collins M 1997 Data collection methods and survey quality: An overview. In: Lyberg L et al. (eds.) Survey
- Measurement and Process Quality. Wiley, New York Dillman D 2000 Mail and Internet Surveys. Wiley, New York
- Godambe V P 1955 A unified theory of sampling from finite populations. Journal of Royal Statistical Society, Series B 17: 269–78
- Groves R 1989 Survey Errors and Survey Costs. Wiley
- Forsyth B, Lessler J 1991 Cognitive laboratory methods: A taxomomy. In: Biemer P et al. (eds.) Measurement Errors in Surveys. Wiley, New York
- Hox J 1997 From theoretical concept to survey question. In: Lyberg L et al. (eds.) Survey Measurement and Process Quality. Wiley, New York, pp. 47–70
- Lyberg L, Kasprzyk D 1991 Data collection methods and measurement error: An overview. In: Biemer P et al. (eds.) Measurement Errors in Surveys. Wiley
- Lyberg L, Kasprzyk D 1997 Some aspects of post-survey processing. In: Lyberg L et al. (eds.) Survey Measurement and Process Quality. Wiley
- Sarndal C E, Swensson B, Wretman J 1992 Model Assisted Survey Sampling. Springer-Verlag, New York
- Sudman S, Bradburn N, Schwarz N 1996 Thinking About Answers: The Application of Cognitive Processes to Survey Methodology. Jossey-Bass, San Francisco
- Wolter K 1985 Introduction to Variance Estimation. SpringerVerlag
ORDER HIGH QUALITY CUSTOM PAPER

Always on-time

Plagiarism-Free

100% Confidentiality