
View sample Stock Market Predictability Research Paper. Browse other statistics research paper examples and check the list of research paper topics for more inspiration. If you need a religion research paper written according to all the academic standards, you can always turn to our experienced writers for help. This is how your paper can get an A! Feel free to contact our research paper writing service for professional assistance. We offer high-quality assignments for reasonable rates.
One of the most enduring cornerstones of modern financial theory has been that stock markets are reasonably efficient in reflecting new information and that price movements closely fit a random walk model where future prices cannot be predicted from an examination of past prices. Toward the end of the twentieth century, however, financial economists and statisticians began to question received doctrine, and many came to believe that stock prices were at least partially predictable. Moreover, although far more controversial, many have argued that these predictable patterns enable investors to earn excess risk-adjusted rates of returns and provide evidence that the efficient market theory should be rejected. This survey reviews the findings of the empirical work concerning stock market predictability. It reviews the work done on stock prices that appears to reject the random walk hypothesis and looks at the body of studies suggesting that future returns can be predicted on the basis of such fundamental variables as dividend yields, price earnings, and price-to-book value ratios, market capitalization (size), etc. The survey also examines the relationship between predictability and market efficiency.
Academic Writing, Editing, Proofreading, And Problem Solving Services
Get 10% OFF with 24START discount code
1. The Efficient Market Theory And Its Critics
The basic idea behind the efficient market theory is that securities markets are extremely efficient in digesting information about individual stocks or about the stock market in general. When information arises about a stock (or the market as a whole), the news spreads very quickly and is immediately incorporated into the prices of securities. Thus, neither technical analysis (an analysis of past price patterns to determine the future) nor fundamental analysis (an analysis of a company’s earnings, dividends, future prospects, etc. to determine a stock’s proper value) will help investors to achieve returns greater than would be obtained by buying and holding one of the broad stock market indices. The efficient market theory is associated with the idea of a ‘random walk,’ which is a term loosely used in the finance literature to characterize a price series where all subsequent price changes represent random departures from previous prices. The logic of the random walk idea is that if the flow of information is unimpeded and information is immediately reflected in stock prices, then tomorrow’s price change will reflect only tomorrow’s news and will be independent of the price changes today. But news is by definition unpredictable and, thus, resulting price changes must be unpredictable and random. As a result, prices fully reflect all known information, and even uninformed investors buying a diversified portfolio at the tableau of prices given by the market will obtain a rate of return as good as that achieved by market professionals. Discussions of the random walk hypothesis can be found in Samuelson (1965) and Fama (1970).
Academic work published mainly during the 1980s and 1990s has tended to cast doubts on many of the tenets of the efficient market theory. This work has suggested that the random walk model is not supported and that future stock prices and returns can be predicted, at least in part, by an examination of past stock prices and certain ‘fundamental’ valuation methods such as the ratio of stock prices to earnings and book values. Moreover, some of this work has been interpreted as implying that markets are inefficient in the sense that arbitrage opportunities exist that enable investors to earn excess risk-adjusted returns.
2. The Major Predictable Patterns That Have Been Discovered
This research paper will now focus on the findings of empirical work about stock market predictability done during the 1980s and 1990s. The general thrust of much of the published academic work has been along the following two lines. First, it appears that there are many predictable patterns in the stock market. The stock market is not random. Indeed, a book published by Lo and MacKinlay (1999) has the arresting title, A Nonrandom Walk Down Wall Street. Second, although this is far more controversial, many have argued that these predictable patterns enable an investor to earn big risk-adjusted rates of return and are proof that the efficient market theory is wrong.
2.1 There Is Some Evidence Of Short-Run Momentum In The Market
When stock returns for individual stocks and market averages are calculated over days, or weeks, or even months, there is positive serial correlation. In other words, a positive rate of return one week is more likely than not to be followed by a positive return the next week. The market is not a perfect random walk. Further evidence provided by Lo and MacKinlay uses a simple specification test based on variance estimators. Their test exploits the fact that the variance of the increments of a random walk is linear in the sampling interval. For example, if stock prices are generated by a random walk then the variance of monthly sampled log-price relatives must be four times as large as the variance of a weekly sample. Using data over a 23-year time frame from 1962 through 1985, Lo and MacKinlay reject the random walk hypothesis. The rejection cannot be explained completely by infrequent trading (where news affects smaller company stocks with a lag because they trade less frequently) or by time-varying volatilities.
This work suggests that quantitative managers who use momentum to help guide purchases have some empirical support on their side. Whether this is a true inefficiency or not, however, is open to more question. Certainly any investor who pays transactions costs is not able to outperform a buy-and-hold strategy because the kind of momentum that has been found is small relative to the transactions costs involved, and it is far from clear how dependable any patterns that can discovered will be. The market is not statistically random, but it is nearly so.
2.2 But There Is Mean Reversion
Returns may be positively correlated for short periods, such as days or weeks, but when returns are measured over longer periods, such as three or four years, there tends to be negative correlation. Just as in the Bible seven lean years followed seven fat years, so in the stock market extraordinary returns are somewhat more likely to be followed by lackluster returns. For example, Fama and French (1988) demonstrated that long holding period returns are negatively serially correlated. The serial correlation is significant and implies that 25–40 percent of the variation in long holding period returns can be predicted on the basis of past returns. Similar results were found by Poterba and Summers (1988), who conclude that there is substantial mean reversion in stock market returns at longer horizons. Some studies have attributed this forecastability to the tendency of stock market prices to ‘overreact.’ DeBondt and Thaler (1985), for example, argue that investors are subject to waves of optimism and pessimism that cause prices to deviate systematically from their fundamental values and later to exhibit patterns of reversal. These findings give some support to investment techniques that rest on a ‘contrarian’ strategy, that is buying the stocks, or groups of stocks, that have been out of favor for long periods of time, and avoiding those stocks that have had large run-ups over the last several years.
While there is considerable support for this view, it should be pointed out that such mean reversion is quite a bit weaker in some decades than it is in other periods. Indeed, the strongest empirical results come from periods including the Great Depression. Moreover, such return reversals for the market as a whole may be quite consistent with the efficient functioning of the market and could result, in part, from the volatility of interest rates. There is a tendency when interest rates go up for stocks to go down, and as interest rates go down for stocks to go up. If, in fact, interest rates fluctuate over time, one will tend to get return reversals, or mean reversion, and this is quite consistent with the efficient functioning of markets where stock returns will need to go up or down to be competitive with bonds.
Moreover, it may not be possible to profit from the tendency for individual stocks to exhibit patterns of return reversals. For example, Fluck et al. (1997) simulated over the period a strategy of buying stocks that had particularly poor returns over the past three to five years. They found very strong statistical evidence of return reversals, but it was truly reversion to the mean, not an opportunity to make extraordinary returns. They found that stocks with very low returns over the past three to five years had higher returns in the next period. Stocks with very high returns over the past three to five years had lower returns in the next period, but the returns in the next period were similar for both groups. While they found strong evidence of mean reversion, they could not confirm that a contrarian approach would yield higher than average returns. There was a statistically strong pattern of return reversal, but not one that implied an inefficiency in the market that would enable investors to make excess returns.
2.3 There Do Seem To Be Some Seasonal Patterns In The Stock Market
A number of researchers have found that January has been a very unusual month for stock market returns. Returns from an equally weighted stock index have tended to be unusually high during the first two weeks of the year. The return premium has been particularly evident for small stocks i.e., those with relatively small total capitalizations, as has been demonstrated by Keim (1983). Haugen and Lakonishok (1988) detail the high January returns in a book entitled The Incredible January Effect.
There also appears to be a number of seasonal effects. For example, French (1980) documents significant Monday returns. There appear to be significant differences in average daily returns in countries other than the USA, as summarized by Hawawini and Keim (1995). There also appear to be some patterns in returns around the turn of the month, as shown by Lakonishok and Smidt (1988), as well as around holidays as shown by Ariel (1990).
The general problem with these anomalies, however, is that they are not dependable from period to period. The January effect has not been useful to investors through much of the 1990s. Moreover, these nonrandom effects (even if they were dependable) are small relative to the transactions costs involved in trying to exploit them. They do not appear to offer investors any arbitrage opportunities that would enable them to make excess returns.
2.4 The Size Effect
Probably one of the strongest effects that investigators have found is the so-called size effect: the tendency over long periods of time for small stocks to generate larger returns than those of large stocks. Since 1926, small-company stocks in the USA have produced a rate of return about 1.5 percentage points larger than the returns from large stocks.
Fama and French (1992) looked at data from 1963 to 1990 and divided all stocks into deciles according to their size as measured by total capitalization. Decile 1 contained the smallest 10 percent of all stocks while decile 10 contained the largest stocks. The results plotted in Fig. 1 show a clear tendency for the deciles made up of portfolios of smaller stocks to generate higher average monthly returns than deciles made up of larger stocks.
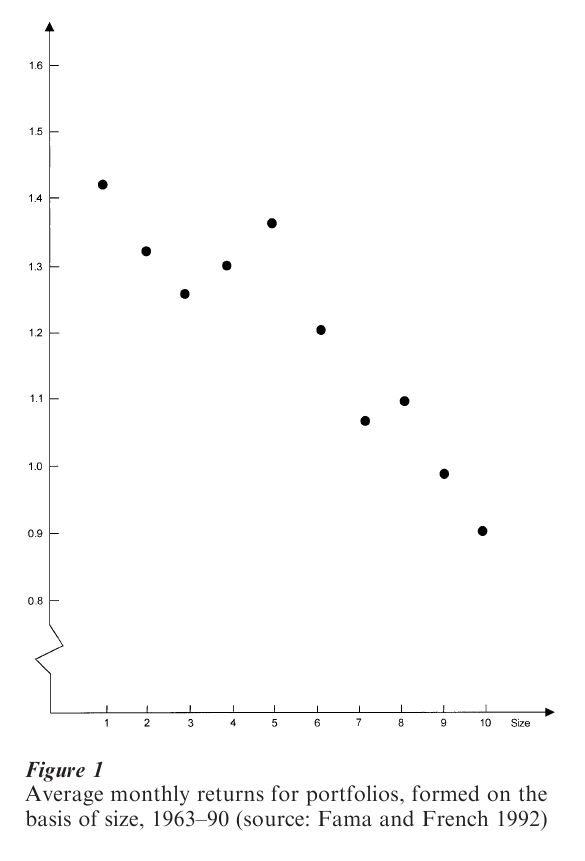
If the ‘Beta’ measure of systematic risk from the capital asset pricing model is accepted as the correct risk measurement statistic, the size effect can be interpreted as indicating a market inefficiency. This is so because portfolios consisting of smaller stocks have excess risk-adjusted returns. But any conclusion that an inefficiency exists involves accepting the joint hypothesis that a size effect is present and that the capital asset pricing model (CAPM) is correct. Fama and French point out, however, that the average relationship between ‘Beta’ and return is flat—not upward sloping as the CAPM predicts. Moreover, within Beta deciles, ten portfolios constructed by size display the same kind of positive relationship shown in Fig. 1. On the other hand, within size deciles, the relationship between Beta and return continues to be flat. Fama and French conclude that size may well be a far better proxy for risk than Beta, and therefore that their findings should not be interpreted as indicating that markets are inefficient.
The dependability of the size phenomenon is also open to question. Certainly during the decade of the 1990s there has been little to gain from holding smaller stocks. Indeed, in most world markets it has been the large stocks that have done especially well. Finally, it is also possible that the small-firm effect is simply a result of survivorship bias in currently available computer tapes of past returns. Today’s lists of companies include only small firms that have survived, not the ones that later went bankrupt. Thus, a researcher who examined the 10-year performance of today’s small companies would be measuring the performance of those companies that survived—not of the ones that failed.
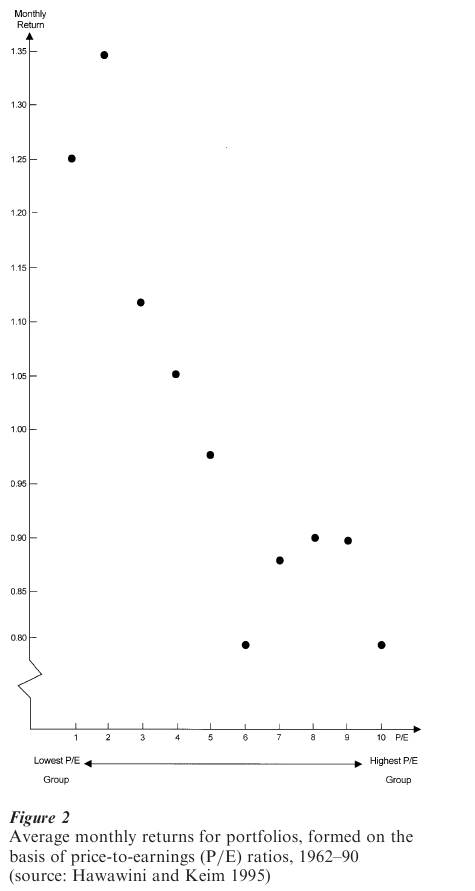
2.5 There Is Evidence That Stocks With Low Price Earnings Multiples Generate Higher Returns Than Those With High Price Earnings Multiples
As Fig. 2 shows, evidence first published by Nicholson (1960) and later confirmed by Ball (1978) and Basu (1983) shows that low price earnings (P E) stocks provide higher rates of return than high P E stocks. This finding is consistent with the views of behavioralists (see, for example, Kahneman and Riepe 1998) that investors tend to be overconfident of their ability to project high earnings growth and thus overpay for ‘growth’ stocks. The finding is also consistent with the views of Benjamin Graham and David Dodd (1934), first expounded in their classic book on security analysis and later championed by the legendary US investor, Warren Buffett. Similar results have been shown for price/cash-flow multiples, where cash flow is defined as earnings plus depreciation and amortization. See Hawawini and Keim (1995).
2.6 Stocks With Low Price-To-Book Value (P/BV) Ratios Generate Larger Returns Than Stocks With High P/BV Ratios
The ratio of stock price to book value (the value of a firm’s assets minus its liabilities divided by the number of shares outstanding) has also been found to be a useful predictor of future security returns. Low priceto-book (along with low P/E) is considered to be another hallmark of so-called ‘value’ in equity securities, and is also consistent with the view of behavioralists that investors tend to overpay for ‘growth’ stocks that subsequently fail to live up to expectations. Fama and French (1992) concluded that size and P BV together provide considerable explanatory power for future returns and once they are accounted for, little additional influence can be attributed to P E multiples. Fama and French (1997) also conclude that the P BV effect is important in many world stock markets other than that of the USA.
Lakonishok et al. (1994) argue that such results raise questions about the efficiency of the market. But these findings do not necessarily imply inefficiency. P/BV may be a more accurate proxy for the systematic risk priced in the stock market than traditional estimates of the CAPM Beta because of measurement errors in the traditional estimates. Indeed, this is the explanation Fama and French give for this predictable pattern. Moreover, especially with so much merger and restructuring activity, book value is increasingly hard to interpret. Thus, it is far from clear that the pattern will continue. In fact, stocks with low P/BV ratios underperformed the general market during the 1990s. Indeed, if one looks at the behavior of growth stocks and value stocks (those with low P BV and P/E) in the USA over a 75-year period to 2000, it appears that the Fama–French period from the early 1960s through 1990 may have been a unique period in which value stocks rather consistently produced higher rates of return.
2.7 Predicting Market Returns From Initial Dividend Yields
Another apparently predictable relationship concerns the returns realized from stocks and the initial dividend yields at which they were purchased. The data since 1926 for the USA are presented in Fig. 3. The figure was produced by measuring the dividend yield of the broad stock market (in this case, the Standard and Poor’s 500 Stock Index) each quarter between 1926 and 2000, and then calculating the market’s subsequent 10-year total return. The observations were then divided into deciles depending upon the level of the initial dividend yield. In general, the figure shows that investors have earned a higher rate of return from the stock market when they purchased stocks with an initial dividend yield that was relatively high, and a below average rate of return when they purchased them at initial dividend yields that were low.
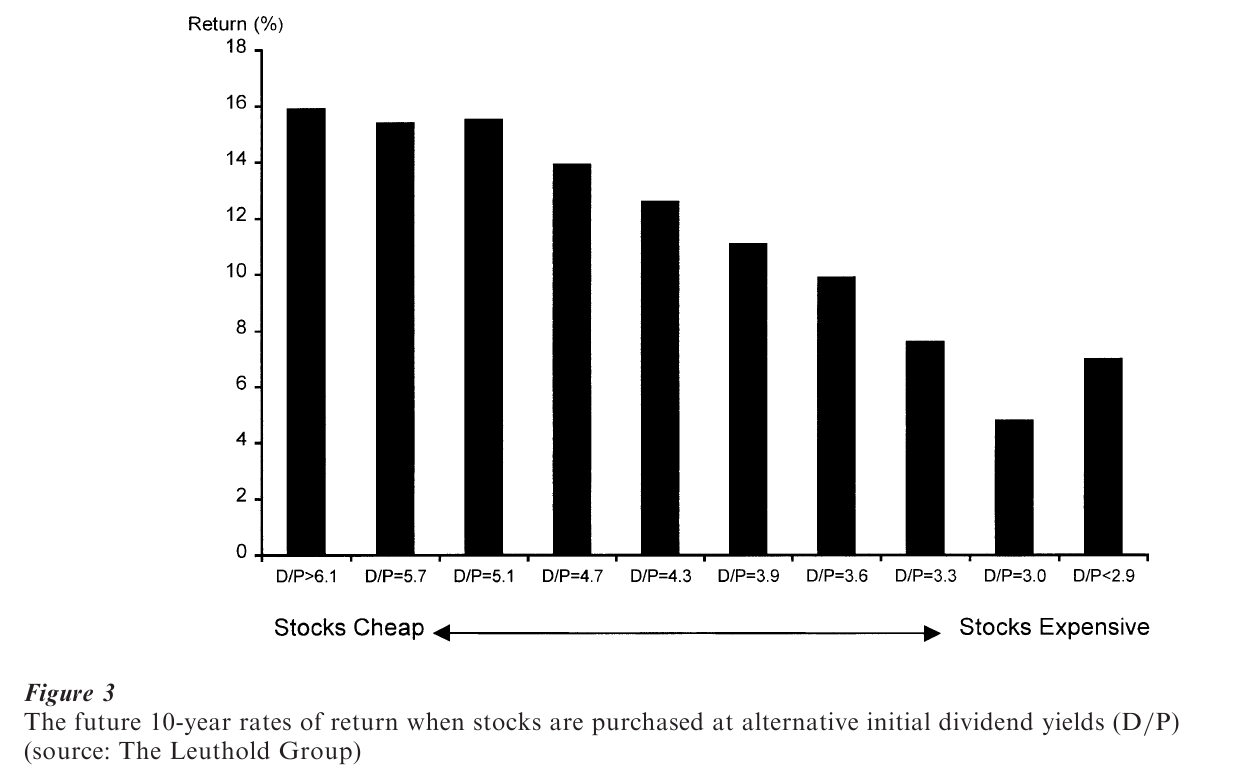
Formal statistical tests of the ability of dividend yields (dividend-price ratios) to forecast future returns have been conducted by Fama and French (1988) and Campbell and Shiller (1988). Depending on the forecast horizon involved, as much as 40 percent of the variance of future returns can be predicted on the basis of initial dividend yields.
These findings are not necessarily inconsistent with efficiency. Dividend yields of stocks tend to be high when interest rates are high, and they tend to be low when interest rates are low. Consequently, the ability of initial yields to predict returns may simply reflect the adjustment of the stock market to general economic conditions. Moreover, the dividend behavior of US corporations may have changed over time (see Fama and French 1999). Companies in the twenty-first century may be more likely to institute a share repurchase program rather than increase their dividends. Thus, dividend yield may not be as meaningful as in the past. Moreover, it is worth pointing out that dividend yields were unusually low at the start of 1995. An investor who avoided US stocks then would have missed out on one of the steepest five-year increases in stock prices in history.
Finally, it is worth noting that this phenomenon does not work consistently with individual stocks. Investors who simply purchase a portfolio of individual stocks with the highest dividend yields in the market will not earn a particularly high rate of return. One popular implementation of such a ‘high dividend’ strategy is the ‘Dogs of the Dow Strategy,’ which involves buying the ten stocks in the Dow Jones Industrial Average with the highest dividend yields. For some periods this strategy handily outpaced the overall average, and so several ‘Dogs of the Dow’ funds were brought to market and aggressively sold to individual investors. Such funds have generally underperformed the market averages during the 1995–9 period.
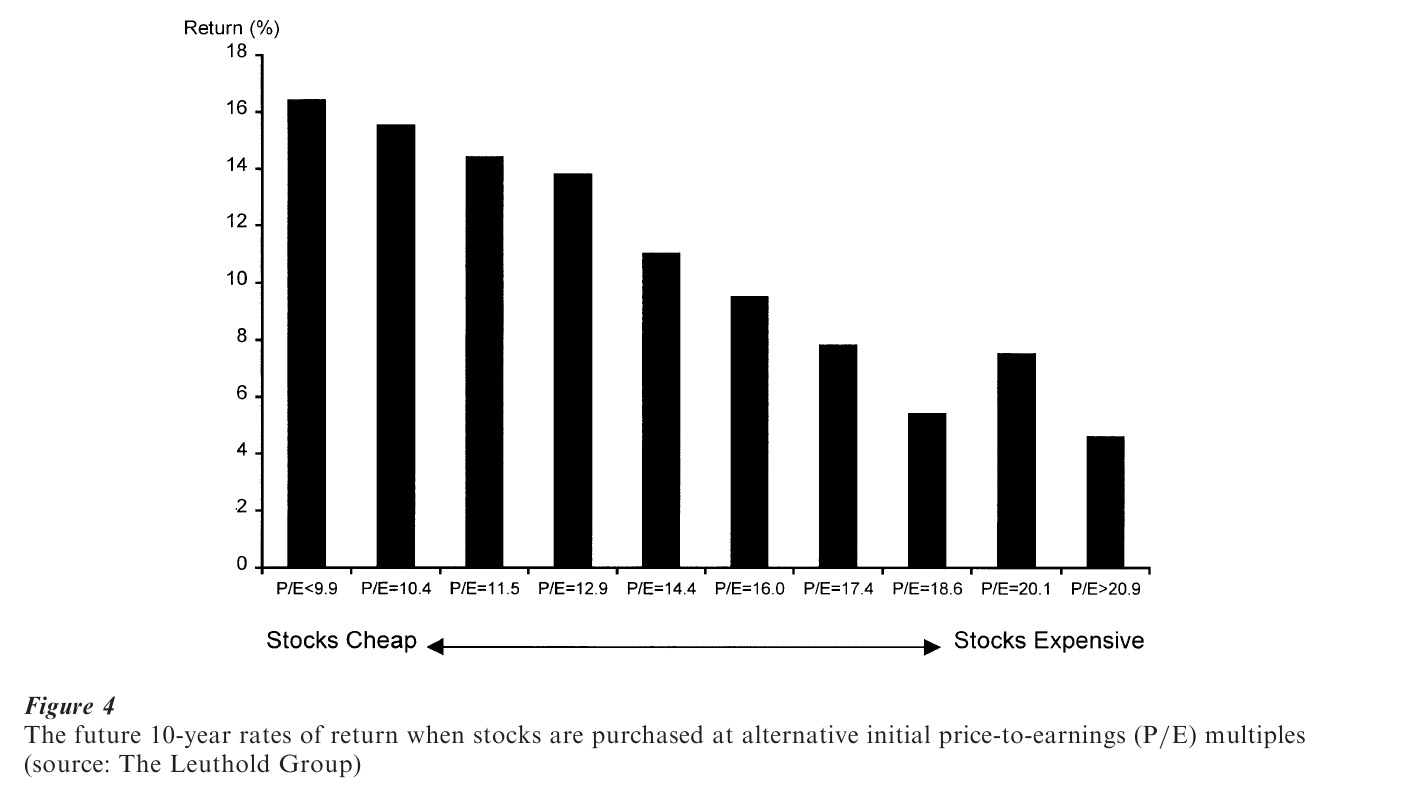
2.8 Predicting Market Returns From Initial Price Earnings Multiples
The same kind of predictability for the market as a whole has been shown for price earnings ratios. The data are shown in Fig. 4. The figure presents a decile analysis similar to that described for dividend yields above. Investors have tended to earn larger long-horizon returns when purchasing stocks at relatively low price earnings multiples. Campbell and Shiller (1988) report R2s (a measure of goodness of fit that takes on a maximum value of one) of over 40 percent and conclude that equity returns have been predictable in the past to a considerable extent. Whether such historical relations are necessarily applicable to the future is another matter. Such an analysis conducted by Shiller in January 1996 predicted a long-horizon (nominal) return for the US stock market close to zero.
3. Concluding Comments
In summary, there are many statistically significant predictable patterns in the stock market. It is important to emphasize, however, that these patterns are not dependable in each and every period, and that some of the patterns based on fundamental valuation measures of individual stocks may simply reflect a better proxy for measuring risk. Moreover, many of these patterns could self-destruct in the future, as many of them have already done. Indeed, this is the logical reason why one should be cautious not to overemphasize these anomalies and predictable patterns.
Suppose, for example, that one of the anomalies is really true. Suppose that there is a truly dependable January effect, and that the stock market—especially stocks of small companies—will generate extraordinary returns during the first five days of January. What will investors do? They will buy late in December, on the last day of December, and sell on January 5. But then investors find that the market rallied on the last day of December and so they will begin to buy on the next-to-last day; and because there is so much ‘profit taking’ on January 5, investors will have to sell on January 4 to take advantage of this effect. Thus, to beat the gun, investors will have to be buying earlier and earlier in December, and selling earlier and earlier in January so that eventually the pattern will selfdestruct. Any truly repetitive pattern that can be discovered in the stock market and can be arbitraged away will self-destruct. Indeed, the January effect became undependable after it received considerable publicity.
Similarly, suppose there is a general tendency for stock prices to underreact to certain new events, leading to abnormal returns to investors who exploit the lack of full immediate adjustment (see DeBondt and Thaler 1995 and Campbell et al. 1997 for a discussion of event studies and possible under reaction of market participants). ‘Quantitative’ investment managers will then develop strategies in an attempt to exploit the pattern. Indeed, the more potentially profitable a discoverable pattern is, the less likely it is to survive.
Moreover, many of the predictable patterns that have been discovered may simply be the result of data mining. The ease of experimenting with financial data banks of almost every conceivable dimension makes it quite likely that investigators will find some seemingly significant but wholly spurious correlation between financial variables or among financial and nonfinancial data sets. One amusing one that has been uncannily accurate in the past for US markets is the Super Bowl Indicator, which predicts the sign of market returns for the year by the winner of January’s football Super Bowl. Given enough time and massaging of data series it is possible to tease almost any pattern out of every data set. Moreover, the published literature is likely to be biased in favor of reporting such results. Significant effects are likely to be published in professional journals while negative results, or boring confirmations of previous findings, are relegated to the file drawer or discarded. Data-mining problems are unique to nonexperimental sciences, such as economics, which rely on statistical analysis for their insights and cannot test hypotheses by running repeated controlled experiments.
An exchange at an academic conference (1992) between Robert Shiller (1981), an economist who is sympathetic to the argument that stock prices are partially predictable and skeptical about market efficiency, and Richard Roll, an academic financial economist who also is a businessman managing billions of dollars of investment funds, is quite revealing. After Shiller stressed the importance of inefficiencies in the pricing of stocks, Roll responded as follows:
I have personally tried to invest money, my client’s money and my own, in every single anomaly and predictive device that academics have dreamed up … I have attempted to exploit the so-called year-end anomalies and a whole variety of strategies supposedly documented by academic research. And I have yet to make a nickel on any of these supposed market inefficiencies … a true market inefficiency ought to be an exploitable opportunity. If there’s nothing investors can exploit in a systematic way, time in and time out, then it’s very hard to say that information is not being properly incorporated into stock prices. (Journal of Applied Corporate Finance, Spring, 1992)
Finally, there is a remarkably large body of evidence suggesting that professional investment managers are not able to outperform index funds that simply buy and hold the broad stock market portfolio (see, for example, Malkiel 1995). Three-quarters of professionally managed funds are regularly outperformed by a broad index fund with equivalent risk, and those that do appear to produce excess returns in one period are not likely to do so in the next. The record of professionals does not suggest that sufficient predictability exists in the stock market to produce exploitable arbitrage opportunities.
Pricing irregularities and predictable patterns in stock returns do appear over time and even persist for periods. Undoubtedly, with the passage of time and with the increasing sophistication of our databases and empirical techniques, we will document further apparent departures from efficiency, and further patterns in the development of stock returns. But the end result will not be an abandonment of the belief of many in the profession that the stock market is remarkably efficient in its utilization of information and that whatever patterns do exist are unlikely to provide investors with a method to obtain extraordinary returns.
Bibliography:
- Ariel R A 1990 High stock returns before holidays: Existence and evidence on possible causes. Journal of Finance 45: 1611–26
- Ball R 1978 Anomalies in relationships between securities’ yields and yield-surrogates. Journal of Financial Economics 6: 103–26
- Basu S 1983 The relationship between earning’s yield, market value and the returns for NYSE common stocks: Further evidence. Journal of Financial Economics 12: 129–56
- Campbell J Y, Lo A W, MacKinlay A C 1997 The Econometrics of Financial Markets. Princeton University Press, Princeton, NJ
- Campbell J Y, Shiller R J 1988 Stock prices, earnings, and expected dividends. Journal of Finance 43: 661–76
- DeBondt W F M, Thaler R 1985 Does the stock market overreact? Journal of Finance 40: 793–805
- DeBondt W F M, Thaler R 1995 Financial decision-making in markets and firms: A behavioral perspective. In: Jarrow R, Maksimovic V, Ziemba W (eds.) Handbook in Operations Research & MS. Elsevier Science, Vol. 9
- Fama E F 1970 Efficient capital markets: A review of theory and empirical work. Journal of Finance 25: 383–417
- Fama E F, French K R 1988 Permanent and temporary components of stock prices. Journal of Political Economy 96: 246–73
- Fama E F, French K R 1997 Value vs. growth: The international evidence. Journal of Finance 53: 1975–99
- Fama E F, French K (forthcoming) Disappearing dividends: Changing firm characteristics or increased reluctance to pay? Journal of Financial Economics
- Fluck Z, Malkiel B G, Quandt R E 1997 The predictability of stock returns: A cross-sectional simulation. Review of Economics and Statistics 79: 176–83
- French K R 1980 Stock returns and the weekend eff Journal of Financial Economics 8: 55–69
- Graham B, Dodd D L 1934 Security Analysis: Principles and Techniques. McGraw-Hill, New York
- Haugen R A, Lakonishok J 1988 The Incredible January Eff Dow Jones-Irwin, Homewood, AL
- Hawawini G, Keim D B 1995 On the predictability of common stock returns: Worldwide evidence. In: Jarrow R, Maksimovic V, Ziemba W (eds.) Handbooks in Operations Research & MS. Elsevier Science, Amsterdam New York, vol. 9, pp. 497–544
- Kahneman D, Riepe M W 1998 Aspects of investor psychology. Journal of Portfolio Management 24: 52–65
- Keim D B 1983 Size-related anomalies and stock return seasonality: Further empirical evidence. Journal of Financial Economics 12: 13–32
- Lakonishok J, Schleifer A, Vishny R W 1994 Contrarian investment, extrapolation, and risk. Journal of Finance 49: 1541–78
- Lakonishok J, Smidt S 1988 Are seasonal anomalies real? A ninety-year perspective. Review of Financial Studies 1: 403–25
- Lo A W, MacKinlay A C 1999 A Non-random Walk Down Wall Street. Princeton University Press, Princeton, NJ
- Malkiel B G 1995 Returns from investing in equity mutual funds 1971 to 1991. Journal of Finance 50: 549–72
- Nicholson S F 1960 Price-earnings ratios. Financial Analysts Journal. July/August: 43–50
- Poterba J M, Summers L H 1988 Mean reversion in stock returns: Evidence and implications. Journal of Financial Economics 22: 27–59
- Roll R, Shiller R J 1992 Comments: Symposium on volatility in US and Japanese stock markets. Journal of Applied Corporate Finance 1: 25–9
- Samuelson P 1965 Proof that properly anticipated prices fluctuate randomly. Industrial Management Review 6: 41–9
- Shiller R J 1996 Price-earnings ratios as forecasters of returns: The stock market outlook in 1996. Unpublished manuscript, Yale University
- Shiller R J 1981 Do stock prices move too much to be justified by subsequent changes in dividends? American Economic Review 71: 421–36
ORDER HIGH QUALITY CUSTOM PAPER

Always on-time

Plagiarism-Free

100% Confidentiality