
View sample Nonprobability Sampling Research Paper. Browse other statistics research paper examples and check the list of research paper topics for more inspiration. If you need a religion research paper written according to all the academic standards, you can always turn to our experienced writers for help. This is how your paper can get an A! Feel free to contact our research paper writing service for professional assistance. We offer high-quality assignments for reasonable rates.
A sample collected from a finite population is said to be a probability sample if each unit of the population has nonzero probability of being selected into the sample, and that probability is known. Traditional methods of probability sampling include simple and stratified random sampling, and cluster sampling. Conclusions concerning the population may be obtained by design-based, or randomization, inference. See Sample Surveys: The Field and Sample Surveys: Methods. The values of variables of interest in the population are considered as fixed quantities, unknown except for those units selected into the sample. Inference proceeds by considering the behavior of estimators of quantities of interest under the randomization distribution, based on the known selection probabilities. For example, if the N population values of variable Y are denoted Y1, …, YN and the n sample values by y1, …, yn then y, the sample mean, is a possible estimator for Y, the population mean. If the sample is obtained by simple random sampling, then, with respect to this randomization distribution, y is unbiased for Y and h as sampling variance (N – n)/Nn(N – 1)ΣNi=1 (Yi – Y)2.
Academic Writing, Editing, Proofreading, And Problem Solving Services
Get 10% OFF with 24START discount code
Nonprobability sampling refers to any method of obtaining a sample from a population which does not satisfy the criteria for probability sampling. Nonprobability samples are usually easier and cheaper to collect than probability samples, as the data collector is allowed to exercise some choice as to which units to include in the sample. For a probability sample, this choice is made entirely by the random sampling mechanism. However, methods of design-based inference cannot be applied to assess the bias or variability of estimators based on nonprobability samples, as such methods do not allow for unknown or zero selection probabilities.
Surveys carried out by national statistical agencies invariably use probability sampling. Marsh and Scarborough (1990) also noted ‘the preponderance of probability sampling in university social science.’ Nonprobability sampling is much more common in market and opinion research. However, Taylor (1995 observed large national differences in the extent to which nonprobability sampling, particularly quota sampling, is viewed as an acceptable tool for market research. In Canada and the USA, probability sampling using telephone polling and random-digit dialing is the norm for public opinion surveys. In Australia and South Africa probability sampling is also prevalent, but with face-to-face interviews. On the other hand, in many European countries such as France and the UK, quota sampling is much more common.
1. Convenience Sampling
The easiest and cheapest way to collect sample data is to collect information on those population units which are most readily accessible. A university researcher may collect data on students. Surveys carried out through newspapers, television broadcasts or Internet sites (as described, for example, by Bradley, 1999) are necessarily restricted to those individuals who have access to the medium in question. Sometimes only a small fraction of the population is accessible, in which case the sample may consist of exactly those units which are available for observation.
Some surveys involve an element of self-selection where individuals decide whether to include themselves in the sample or not. If participation is time-consuming, or financial cost is involved, then the sample is more likely to include individuals with an interest in the subject of the survey. This may not be important. For example, an interest in participating in an experimental study of behavior might be considered to be unlikely to be associated with the outcome of the experiment. However, where the variable of interest relates to opinion on a question of interest, as is often the case in newspaper, television or Internet polls, it is likely that interest in participation is related to opinion, and it is much harder to justify using the sample data to make conclusions about a wider population.
A famous example of the failure of such a nonprobability sample to provide accurate inferences about a wider population is the Literary Digest poll of 1936. Ten million US citizens were sent postcard ballots concerning the forthcoming presidential election. Around 2 million of these were returned, a sample size which, if associated with a simple random sample, would be expected to predict the population with negligible error. However, when calibrated against the election results, the Literary Digest poll was in error by 19 percentage points in predicting Roosevelt’s share of the vote.
On the other hand, useful inferences can be made using convenience samples. Smith and Sugden (1988) considered statistical experiments, where the allocation of a particular treatment to the units under investigation is controlled, usually by randomization. In such experiments, the selection of units is not usually controlled and is often a convenience sample. For example, individuals might be volunteers. Nevertheless, inferences are often successfully extended to a wider population. Similarly, obser ational studies where neither treatment allocation nor sample selection is controlled, usually because it is impossible to do so, can be thought of as arising from convenience samples. Smith (1983) noted that Doll and Hill (1964) in their landmark study of smoking and health, used a sample entirely made up of medical practitioners. However, the validity of extending conclusions based on their data, to the general population, is now widely recognized.
Studies based on convenience samples can be an extremely effective way of conducting preliminary investigations, but it is desirable that any important conclusions drawn about a wider population are further investigated, preferably using probability samples. Where some kind of explanatory, rather than simply descriptive, inference is desired, Smith and Sugden (1988) argued that ‘the ideal studies are experiments within surveys in which the scientist has control over both the selection of units and the allocation of treatments.’ This approach was considered in detail by Fienberg and Tanur (1989).
2. Quota Sampling
When using survey data to draw an inference about a population of interest, the hope of the analyst is that sample estimators of quantities of interest are close to the corresponding population values. If a nonprobability sample has been collected, then it is instructive to observe the precision of sample estimators of known population quantities. For example, how do the sample proportions of males and females compare to known population values? If they differ substantially, then the sample is ‘unrepresentative’ of the population and one might have legitimate cause for concern about the reliability of estimates of unknown quantities of interest. Purposive sampling is a term used for methods of choosing a nonprobability sample in a way that makes it ‘representative’ of the population, although there is no generally agreed definition of a representative sample, and purposive sampling is often based on subjective considerations.
In quota sampling, the sample selection is constrained to ensure that the sample proportions of certain control variables approximately match the known population proportions. For example, if the population proportions of males and females are equal, then equal numbers of male and female units are selected into the sample. Age groups are also commonly used in designing quota samples. Sample totals for each cell of a cross-classification of two or more control variables (for example, age by sex) may also be fixed by the design. Examples are given by Moser and Kalton (1971). Quota sampling is most commonly used in market and opinion research, where control variables usually include age, sex, and socioeconomic class. Other variables such as employment status and housing tenure are also used. The known population proportions for the control variables are calculated from census data, or from surveys based on large probability samples. Variables with known population totals which are not used in setting quotas may be used for weighting in any subsequent analyses.
Where data collection involves visiting households, further constraints beyond the quotas may be applied to sample selection. For example, data collectors may be assigned a prespecified travel plan. However, where the mode of data collection involves intercepting individuals on the street for interview, then the only constraint on the data collector may be to satisfy the quotas. It is this freedom given to the data collector that provides both the biggest advantage and biggest disadvantage of quota sampling. The advantage is that with only the quota constraints to satisfy, data collection is relatively easy. Such surveys can be carried out rapidly by an individual data collector performing interviews on a busy street corner. As with any nonprobability sampling scheme, however, there is no way of assessing the bias associated with quota sampling. The sample units are necessarily selected from those which are available to the data collector, given their mode of interviewing. If availability is associated with any of the survey variables, then significant bias may occur. Advocates of quota sampling argue that the quotas control for this, but there is no way of guaranteeing that they do. Neither can design-based inference be used to assess the variability of estimates based on quota samples. Sometimes, a simple model is used to assess this variability. If one assumes that the data collectors used are drawn from a population of possible data collectors, then the ‘between collector’ variance combines both sampling variability and interviewer variability. Deville (1991) modeled the quota sampling process and provided some alternative measures of variability.
Studies comparing quota and probability sampling have been carried out. Moser and Stuart (1953) discovered apparent availability biases in the quota samples they investigated, with respect to the variables occupation and education. In particular, they noticed that the quota samples underestimated the proportion of population with lower levels of education. Marsh and Scarborough (1990) investigated nine possible sources of availability bias in quota samples. They found that, amongst women, their quota sample overestimated the proportion from households with children. Both studies found that the quota samples tended to underestimate the proportion of individuals in the extreme (high and low) income groups.
Quota samples are often used for political opinion polls preceding elections. In such examples they can be externally validated against the election results and historically quota samples have often been shown to be quite accurate. Indeed Worcester (1996) argued that election forecasts using quota samples for UK elections in the 1970s were more accurate than those using probability samples. Smith (1996) presented similar evidence. However, it is also election forecasting which has led to quota sampling coming under closest scrutiny. In the US presidential election of 1948, the Crossley, Gallup, and Roper polls all underestimated Truman’s share of the vote by at least five percentage points, and as a consequence, predicted the wrong election winner. Mosteller et al. (1949) in their report on the failure of the polls found one of the two main causes of error to be errors of sampling and interviewing, and concluded (p. 304) that ‘it is likely that the principal weakness of the quota control method occurred at the local level at which respondents are selected by interviewers.’
The UK general election of 1992 saw a similar catastrophic failure of the pre-election opinion polls, with pre-election polls giving Labour an average lead of around 1.5 percentage points. In the election, the Conservative lead over Labour was 7 percentage points. A report by the Market Research Society Working Party (1994) into the failure of the polls identified inaccuracies in setting the quota controls as one of a number of possible sources of error. As a result the sample proportions of the key variables did not accurately reflect the proportions in the population. Lynn and Jowell (1996) attributed much of the error to the selection bias inherent in quota sampling, and argued for increased use of probability sampling methods for future election forecasts.
3. A Formal Framework
As methods of design-based inference cannot be applied to data obtained by nonprobability sampling, any kind of formal assessment of bias and variability associated with nonprobability samples requires a model-based approach. Smith (1983) considered the following framework, which can be used to assess the validity of inferences from various kinds of nonprobability samples. Let i =1, …, N denote the population units, vector Yi the values of the unknown survey variables, and vector Zi the values of variables which are known prior to the survey. Let A be a binary variable indicating whether a unit is selected into the sample (Ai = 1) or not (Ai = 0), and let As be the values of A for the observed sample. Smith (1983) modeled the population values of Y and the selection process jointly through
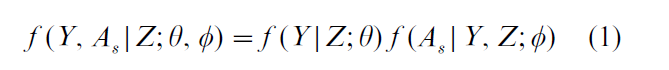
where θ and φ are distinct model parameters for the population model and selection model respectively. Given As, Y can be partitioned as (Ys, Ys) into observed and unobserved values.
Inferences based on the observed data model f (Ys |Z; θ) and extended to the population are said to ignore the selection mechanism, and in situations where this is valid, the selection is said to be ignorable (Rubin, 1976); see Statistical Data, Missing. Selection is ignorable when
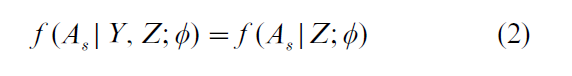
so that the probability of making the observed selection, for given Z, is the same for all Y. A sufficient condition for this is that A and Y are conditionally independent given Z. A probability sampling scheme, perhaps using some stratification or clustering based on Z, is clearly ignorable.
Nonprobability sampling schemes based on Z (for example selecting exactly those units corresponding to a particular set of values of Z) are also ignorable. However, whether or not inferences are immediately available for values of Z not contained in the sample depends on the form of the population model f(Y|Z; θ) and, in particular, whether the entire θ is estimable using Ys. If Y is independent of Z then there is no problem, but this is an assumption which cannot be verified by sample data based on a restricted sample of values of Z. If this assumption seems implausible, then post-stratification may help. Smith (1993) considered partitioning the variables comprising Y into measurement variables Ym and stratification variables Yq, and post-stratifying. If
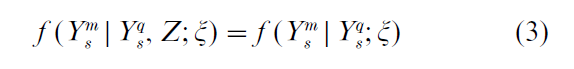
where ξ are parameters for the post-stratification model, then inference for any Z is available. This condition implies that, given the observed values Ym8 of the stratification variables, Z gives no further information concerning the measurement variables. This approach provides a way of validating certain inferences based on a convenience sample, where Z is an indicator variable defining the sample.
Smith (1983) also considered ignorability for quota sampling schemes. He proposed modeling selection into a quota sample in two stages, selection into a larger sample for whom quota variables Yq are recorded, followed by selection into the final sample, based on a unit’s quota variables and the requirements to fill the quota. For the final sample, the variables of interest Ym are recorded. Two ignorability conditions result, requiring that at neither stage does probability of selection, given Yq and Z, depend on Ym
This formal framework makes clear, through expressions such as (2) and (3) when model-based inferences from nonprobability samples can and cannot be used to provide justifiable population inferences. However, it is important to realize that the assumptions required to ensure ignorability cannot be verified using the sample data alone. They remain assumptions which need to be subjectively justified before extending any inferences to a wider population. These formal concepts of ignorability confirm more heuristic notions of what is likely to comprise a good nonprobability sampling scheme. For example, opinion polls with a large element of self-selection are highly unlikely to result in an ignorable selection. On the other hand one might have much more faith in a carefully constructed quota sampling scheme, where data collectors are assigned to narrowly defined geographical areas, chosen using a probability sampling scheme, and given restrictive guidelines on choosing the units to satisfy their quota.
4. Discussion
The distinction between probability sampling and nonprobability sampling is necessarily coarse. At one extreme is a carefully constructed probability survey with no nonresponse; at the other extreme is a sample chosen entirely for the investigator’s convenience. However, most surveys fall between these two extremes, and therefore strictly should be considered as nonprobability samples. Examples include quota surveys of households where the geographical areas for investigation are chosen using a probability sample, or statistical experiments where a convenience sample of units is assigned treatments using a randomization scheme. The validity of any inferences extended to a wider population depends on the extent to which the selection of units is ignorable for the inference required. This applies equally to any survey with nonresponse. The presence of nonresponders in a probability survey introduces a nonprobability element into the selection mechanism. Considerations of ignorability (of nonresponse) now need to be considered. However, surveys with probability sampling usually make a greater effort to minimize nonresponse than nonprobability surveys, where there is little incentive to do so. Furthermore, even with nonresponse, it is easier to justify ignorability of a probability sampling mechanism.
Further details concerning specific issues may be obtained from the sources referenced above. Alternative perspectives on nonprobability sampling are provided by general texts on sampling such as Hansen et al. (1953), Stephan and McCarthy (1958) and Moser and Kalton (1971).
Bibliography:
- Bradley N 1999 Sampling for internet surveys. An examination of respondent selection for internet research. Journal of the Market Research Society 41: 387–95
- Deville J-C 1991 A theory of quota surveys. Survey Methodology 17: 163–81
- Doll R, Hill A B 1964 Mortality in relation to smoking: ten years’ observations of British doctors. British Medical Journal 1: 1399–410
- Fienberg S E, Tanur J M 1989 Combining cognitive and statistical approaches to survey design. Science 243: 1017–22
- Hansen M H, Hurwitz W N, Madow W G 1953 Sample Survey Methods and Theory. Volume 1: Methods and Applications. Wiley, New York
- Lynn P, Jowell R 1996 How might opinion polls be improved? The case for probability sampling. Journal of the Royal Statistical Society A 159: 21–8
- Market Research Society Working Party 1994 The Opinion Polls and the 1992 General Election. Market Research Society, London
- Marsh C, Scarborough E 1990 Testing nine hypotheses about quota sampling. Journal of the Market Research Society 32: 485–506
- Moser C A, Kalton G 1971 Survey Methods in Social In estigation. Heinemann, London
- Moser C A, Stuart A 1953 An experimental study of quota sampling (with discussion). Journal of the Royal Statistical Society A 116: 349–405
- Mosteller F, Hyman H, McCarthy P J, Marks E S, Truman D B 1949 The Pre-election Polls of 1948: Report to the Committee on Analysis of Pre-election Polls and Forecasts. Social Science Research Council, New York
- Rubin D B 1976 Inference and missing data. Biometrika 63: 581–92
- Smith T M F 1983 On the validity of inferences from nonrandom samples. Journal of the Royal Statistical Society A 146: 394–403
- Smith T M F 1996 Public opinion polls: the UK general election, 1992. Journal of the Royal Statistical Society A 159: 535–45
- Smith T M F, Sugden R A 1988 Sampling and assignment mechanisms in experiments, surveys and observational studies. International Statistical Review 56: 165–80
- Stephan F F, McCarthy P J 1958 Sampling Opinions. An Analysis of Survey Procedure. Wiley, New York
- Taylor H 1995 Horses for courses: how survey firms in different countries measure public opinion with very different methods. Journal of the Market Research Society 37: 211–19
- Worcester R 1996 Political polling: 95% expertise and 5% luck. Journal of the Royal Statistical Society A 159: 5–20
ORDER HIGH QUALITY CUSTOM PAPER

Always on-time

Plagiarism-Free

100% Confidentiality