
Sample Nonsampling Errors Research Paper. Browse other research paper examples and check the list of research paper topics for more inspiration. If you need a religion research paper written according to all the academic standards, you can always turn to our experienced writers for help. This is how your paper can get an A! Feel free to contact our research paper writing service for professional assistance. We offer high-quality assignments for reasonable rates.
Data from sample surveys are subject to two types of errors: sampling and nonsampling errors. Sampling errors result from the fact that we only have information from a portion of the population of interest rather than from the whole population. Nonsampling errors include errors from all other sources: the sampling frame, the questionnaire, the interviewer, and the respondent. Data from both censuses and surveys may suffer from nonsampling errors while only survey data is subject to sampling error.
Academic Writing, Editing, Proofreading, And Problem Solving Services
Get 10% OFF with 24START discount code
Statisticians have traditionally been most concerned with controlling and measuring sampling errors, perhaps because they are easier to handle. Sampling errors are controlled by choice of the survey design; the size of the sampling error can be estimated using the survey data itself. The emphasis of most classical survey sampling books such as Cochran (1977) and Kish (1965) is on measuring sampling error and designing surveys to reduce that error.
More recently, authors such as Lessler and Kalsbeek (1992) and Biemer et al. (1991) have focused on issues related to nonsampling error. Such errors must typically be assessed using information outside of the survey (or census) data or using a statistical model. As is noted by Mosteller (1978), sampling errors typically contribute to the variance of an estimate from survey data (and do not exist for census data), while nonsampling errors can contribute to both variance and bias of an estimate. In collecting survey or census data we try to control, reduce, or avoid nonsampling errors as much as possible because their size and effect on estimates are very hard to assess.
Frame errors, response errors, nonresponse errors, and other sources of errors are all nonsampling errors. The following describes these nonsampling errors and methods for dealing with them.
1. Frame Error
1.1 Definition Of Frame Error
The sampling frame is the list from which units are drawn for the sample. The ‘list’ may be an actual listing of units, as in a phone book from which phone numbers will be sampled, or some other description of the population, such as a map from which areas will be sampled. Frame error results when the sampling frame is not an accurate and complete representation of the population of interest.
Frame errors arise from erroneous inclusions, erroneous exclusions, and multiple inclusions. Erroneous inclusions occur if the frame includes units not in the population of interest so that invalid units have a chance of being included in the sample. Erroneous exclusions occur when members of the population of interest are missing from the list so that they have no chance of being sampled. Multiple inclusions occur if some population members appear multiple times on the list so that they have a higher chance of being sampled.
For an easy example of these types of frame errors, consider sampling households within a city using the telephone white pages as the sampling frame. Some numbers listed in the phone book are no longer working numbers because the people in the household that had the number have moved out of the city; these are erroneous inclusions. Some households choose to have their phone numbers unlisted; these are erroneous exclusions. Some households have multiple listings in the phone book because they have additional telephone lines for a computer modem or a fax machine or for the children; these are the multiple inclusions.
Frame error is a problem because a sample drawn from such a frame may not represent the population of interest, from which you think you are sampling, and some units may have a higher probability of being included in the sample than most units. These errors may result in sample estimates that are biased for the population quantity being estimated. For example, if wealthier households are more likely to have multiple phone lines, then those households are more likely to be included in the sample. This could lead to estimates of, say, amount spent on entertainment that are biased high.
1.2 Dealing With Frame Error
As is the case with all nonsampling errors, the best way to control frame error is to avoid or minimize it. Methods for doing this depend on the type of sampling frame that you are using. We will discuss two commonly used methods in this section: random digit dialing (RDD) and dual-frame sampling.
1.2.1 Random Digit Dialing. For telephone surveys of individuals in households, RDD is often used to avoid problems associated with using a telephone directory as the sampling frame. To create the sampling frame for an RDD sample, one must first list all working area codes in the area to be sampled. Within each area code, one must list all working exchanges. If all possible four-digit numbers that could complete the phone number were used to make up the sampling frame of phone numbers, there would be numerous nonworking numbers and business numbers included. Because calling such numbers to determine that they are not valid household numbers is timeconsuming and expensive, other methods may be used to reduce the number of invalid phone numbers in the frame. One method takes advantage of the fact that phone numbers are typically given out in banks of 100. Thus, the frame is taken to be the list of area codes with their exchanges followed by all possible first two digits of the remainder of the number. These eight-digit numbers are clusters of 100 possible phone numbers. A random sample of these clusters is taken and then two two-digit numbers are chosen at random to give two potential phone numbers within each cluster. The two sampled numbers within each cluster are called. If both are nonworking numbers or business numbers, then the cluster is discarded because it is likely that the remaining possible numbers in that cluster are also invalid numbers.
Once a valid household is reached, one still must determine who is to be interviewed within the household. If a single adult respondent is to be selected, a method proposed by Kish (1949) may be used to randomly select that adult. Because Kish’s method involves creating a roster of all individuals within the household, which can be time-consuming and may be considered intrusive by potential respondents, other methods such as asking for the person who had the last birthday may be used as a quick method of selecting an individual within a household (see Lavrakas 1993, pp. 111–13 for a description of the last birthday and next birthday methods).
There are, of course, some problems with RDD samples. For example, persons who live in households with no telephone are not included in the sampling frame. Households with multiple telephone lines have a higher probability of being selected for the sample. One must account for this by asking respondents how many phone lines they have that are used for voice correspondence and use this information to adjust the selection probability for that household. If one is searching for a very specific population, such as households with disabled persons or early voters, then many of the households reached by telephone will be ineligible for the survey and must be screened out of the sample. The higher the proportion of households that must be screened out because of ineligibility, the higher the final cost of the survey will be.
1.2.2 Dual frame sampling. In many sampling settings there are multiple lists or sources that can be used to develop a sampling frame. For example, the US Department of Agriculture uses lists of farms and area maps to select samples for their crop surveys. Samples from the lists of farms are easier to obtain but miss some farms; the area samples are difficult to handle but encompass all possible farms (see Bosecker and Ford 1976, for details.) A survey of patrons of the arts may use lists of season ticket holders to the symphony, ballet, and opera along with lists of persons who have made contributions to art museums. The challenge when multiple lists are used is to unduplicate the lists or determine how many ways a person could be selected for the sample. Unduplicating lists to create a single sampling frame is complicated by problems such as incorrect spellings of names, use of complete first names vs. initials, and spouses who may donate together or individually. Procedures for unduplicating lists must search for possible matches as well as for exact matches. These possible matches may need to be resolved by hand. Alternately, sampling may be done from the multiple lists and respondents may be asking how many of the lists they should appear on. This allows one to determine the probability that an individual was selected for the sample.
2. Response Error
2.1 Definition Of Response Error
Response error occurs when a respondent intentionally or unintentionally gives an answer to a survey question that is not correct. An intentional response error occurs when the respondent purposely gives an incorrect answer, for example, to a question that asks for sensitive information about illegal activities (drug use, cheating on taxes), for personal information on sensitive topics (being a victim of rape), or about behavior that may not be perceived as socially acceptable (not voting, owning a gun). The respondent may give an intentionally incorrect answer for self-protection if he or she is concerned that the survey responses will not be held confidential and may be used against him or her. Or the respondent may not wish to appear in a bad light to the interviewer and may give the more socially acceptable answer.
Unintentional response errors can occur if questions are poorly worded and the respondent does not understand the question or terms in the question. The order in which questions and response choices are presented to a respondent can influence the responses that are given. In addition, response errors can occur if the respondent does not take time to think about a question that asks for an opinion and instead takes the easy option of agreeing with the statement or choosing the answer that is easiest to recall (called satisficing). (See Krosnick and Alwin 1987 for details on response-order effects and satisficing.)
2.2 Avoiding Response Error
Carefully designed and worded questionnaires, and, for in-person or telephone surveys, well-trained interviewers are the best tools for avoiding response errors. Questionnaires must be pilot tested to ensure that respondents understand questions and that all possible responses are allowed for on closed-form questions.
2.3 Randomized Response Techniques For Sensitive Questions
Randomized response methods have been proposed by a number of researchers (see, for example, Warner 1965, and Nathan 1988) to avoid the problem of having respondents intentionally give an incorrect answer to a question. The idea is to protect the respondent by ensuring that the interviewer is unaware of which question the respondent is answering.
There are several versions of the randomized response technique. In one, the respondent randomly selects one of two types of cards containing opposite versions of the question. For example,
Version A:
I have used cocaine at least once. YES NO
Version B:
I have never used cocaine. YES NO
Whichever the respondent answers, yes or no, the interviewer does not know whether the respondent has used cocaine or not. The data from such responses, however, can be used to estimate the proportion of the population that has used cocaine as long as there are unequal numbers of Version A and Version B cards.
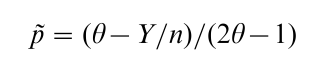
Let p = population proportion of interest (here the proportion that has used cocaine). Let θ = 1/2 be the proportion of Version A cards. Suppose that Y of the n respondents answered ‘yes’ to whichever question they were asked. One can use conditional probability arguments to show that an unbiased estimate of p, assuming simple random sampling and ignoring the finite population correction factor, is
The variance of this estimator is
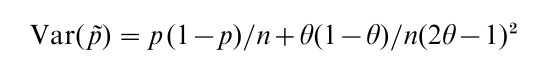
which is larger than that obtained by asking the question directly, p(1-p)/n, because we have introduced extra variability by asking a randomly chosen question. Notice that the variance will decrease as θ gets closer to 0 or 1, so that most of the cards are of one type (Version A or Version B). Thus, from a mathematical perspective, we prefer θ far from 1/2. Respondents, however, prefer θ close to 1/2 so that they feel confident that the interviewer does not know what question is being answered. The tradeoff is an increase in variance in order to ensure that the respondent will provide a true, unbiased response.
In practice, randomized response techniques are not as successful as one would hope. The explanation of the technique may confuse the respondent, or the respondent may not really believe that the interviewer does not know what question is being answered. Thus, such techniques must be used with great care.
3. Nonresponse Error
3.1 Definition Of Nonresponse Error
Almost every data collection endeavor results in missing data or nonresponse. In telephone or inperson surveys and censuses, for example, some sampled individuals cannot be located during the interview period, some are ill or unable to communicate with the interviewer, and some refuse to respond to the survey. The best that one can hope for when there is nonresponse is that the missing data are like a random sample of the units selected for the survey. If this is the case then the data are said to be missing completely at random and the effect on estimates is that they are more variable since they are based on a smaller sample size than planned. More often, however, those who do not respond to the survey differ from those who do respond on at least some survey variables of interest. In these cases the data are said to be missing at random if the missingness can be explained by other variables that are observed; nonresponse is nonignorable if the missingness depends on the value that is not observed (see Little and Rubin 1987 for a more complete discussion of types of missingness). For example, people who are not at home to respond to a telephone survey in the evening may watch less television than those who are at home. In this case, estimates of average hours of television viewing per week based only on data from respondents will be biased low. (Note that the above example also illustrates why it is not appropriate to replace nonresponding units in your sample with other units from the population: if there are differences between responders and nonresponders, choosing additional responders only repeats the bias on a larger scale.)
Nonresponse is a particular problem in longitudinal or multiple-wave surveys and studies where sampled individuals may drop out of the study after several interviews. If the reason for dropping out is related to the variables of interest, then nonresponse bias is introduced. For example, individuals in housing units sampled for the US National Crime Victimization Survey are interviewed seven times over 3.5 years. Individuals who move out of sampled housing units are not followed. If individuals who experience crime are more likely to move, perhaps to a safer neighborhood, then estimates of victimization rates will be biased low (see Lohr 1999 for a description of the National Crime Victimization Survey). A similar problem occurs in longitudinal medical studies if, for example, patients given the placebo see no change in their condition and thus are more likely to drop out of the study than patients receiving a treatment.
There are two types of nonresponse in surveys and censuses: unit nonresponse and item nonresponse. If no survey information is collected from a sampled unit this is termed unit nonresponse; if a sampled unit responds to some, but not all, survey questions this is termed item nonresponse. There are different methods for dealing with unit and item nonresponse.
3.2 Dealing With Nonresponse Error
The best way to deal with nonresponse error is to try to avoid it. Thus, good survey organizations use repeated callbacks on telephone and in-person surveys, and reminder post cards or multiple mailings on mailed surveys to try to reach sampled individuals. Introductory letters or statements at the beginning of questionnaires should describe the purpose of the survey, provide information on who is funding and conducting the survey, stress the importance of the person’s responses to the survey, and assure the respondent that all survey responses will be kept confidential. Some surveys provide a payment or gift to respondents, or draw for prizes from among the respondents to encourage response.
In spite of the best efforts to encourage response, most surveys suffer from nonresponse. A researcher thus has the responsibility, at a minimum, to report the nonresponse rate for the survey along with any results from the survey. There can be many definitions of the response rate for a survey, depending on whether one counts all units originally sampled, only those that led to eligible respondents, only those that resulted in some contact with a respondent, and so forth. See the American Association for Public Opinion Research (1998) for standard definitions of response rates.
The first step in dealing with nonresponse is to conduct exploratory data analysis on the survey data. For unit nonresponse, after determining the overall nonresponse rate one should then look at response rates by other variables that are available for both responding and nonresponding units. For example, in a mailed survey of a larger city, one could look at response rates by zip code. If there are big differences in response rates for various areas of the city, say that there are higher response rates from the more affluent areas, then survey estimates for variables that are related to affluence, such as support of the arts, are likely to be biased. In a survey of university alumni, one can compare respondents and nonrespondents on any of the variables available in the university alumni database, such as GPA. If, for example, those with higher GPAs responded more often than those with lower GPAs, then survey estimates on variables related to GPA, say starting salary in the first job after graduation, are likely to be biased. If one does not find differences such as those suggested above, then at least one knows that there are not differences on the variables that could be explored. This does not, however, insure that there are no differences between respondents and nonrespondents on the survey variables of interest.
For item nonresponse, one should start by determining how much nonresponse there is for each variable with some missingness. For key study variables, one should look at summaries of other variables according to whether or not the key variable is missing. For example, if income is a key variable and subject to nonresponse, one could look at average age, average years in job, proportion married, proportion with high school diploma or less, and so forth for respondents who reported their income and those who did not. Obvious differences between the two groups on the other variables suggest that there are likely to be differences between the respondents and the nonrespondents on the income variable. It also suggests that the other variables might be useful in determining an adjustment for the nonrespondents, as described below.
3.3 Weight Adjustments
The sample-based weights assigned to cases in a sample survey can be interpreted as the number of people in the population of interest that the individual in the sample represents. The initial weight is usually the inverse of the selection probably for each sampled unit. One commonly used method to adjust for unit nonresponse in a sample is to increase the weights of respondents to account for nonrespondents. This adjustment is usually done within weight-adjustment cells within which it must be assumed that nonrespondents are ‘just like’ nonrespondents on variables of interest. That is, within weight-adjustment cells, the nonrespondents can be thought of as a random sample of the sampled units in that cell.
As a simple example, suppose you have a simple random sample of n = 100 individuals: 50 men, of whom 30 respond, and 50 women, of whom 40 reply. (Since we are assuming that a simple random sample of individuals was selected, all individuals in the sample will have equal selection probabilities and thus equal initial weights.) If you believe that within gender the nonrespondents are ‘just like’ the respondents (that is, the nonrespondents can be thought of as a random sample of those originally sampled) on survey variables of interest, then you may decide to use male/female as the weight adjustment cells. The 30 responding males would represent themselves and the 20 nonresponding males. Thus, the original weights of the males must be multiplied by 50/30. Similarly, the original weights of the women would be multiplied by 50/40 to account for the nonresponding women.
In practice, there are usually more than the two nonresponse adjustment cells described in the simple example here. Little and Rubin (1987) describe methods for creating the nonresponse adjustment cells. Brick and Kalton (1996) provide details on weight adjustments for nonresponse.
3.4 Imputation Methods
Imputation methods are most often used to deal with item nonresponse. Imputation is defined as replacing a missing value by a plausible value. An advantage of imputation is that it creates a completed dataset that can be analyzed using standard statistical methods. A disadvantage is that most subsequent analyses ignore the fact that imputation was done and, therefore, underestimate the variance by ignoring the uncertainty due to the imputation. There are many methods for creating plausible values to impute for a missing value. The better methods make use of information in the available data or in an auxiliary data source to estimate the missing values. The following describes some common methods of imputation. More details and additional methods may be found in Little and Rubin (1987) and Statistical Data, Missing.
Mean imputation involves replacing a missing value of some variable by the sample mean computed from all individuals who reported a value for that variable. For example, mean income from those who reported income would be imputed for all those who refused to report income. The main disadvantages of mean imputation are that it distorts the distribution of the variable by creating a spike at the mean value, and it distorts relationships and correlations among variables. For example, the relationship between years experience on the job and income is not preserved when mean income is imputed for all those missing income regardless of years of experience. For this reason, mean imputation may be done within imputation cells that are determined by variables thought to be related to the missing values. Thus, years experience may be used to divide respondents into groups, and the mean income within each group is imputed for those missing income in the group. Mean imputation within group still created spikes in the data (at the mean for each group) and distorts the relationships among variables, but these effects should be less than with overall mean imputation.
Regression imputation involves using a regression model fit from complete cases to estimate missing values. For example, complete cases may be used to develop a model for income based on age, education, tenure in job, and other available data. This fitted model would then be used to estimate income when it is missing. Because this method may also create spikes in the data when there are few possible combinations of the predictor variables used in the regression model, a variation involves adding a random error to the estimated value to be used for imputation.
Cold deck imputation involves using auxiliary data as a source for missing values. For example, data from administrative records might be used to obtain missing survey values, or, in a panel survey, values from a previous interview for the same respondent could be used to replace missing values. Hot deck imputation replaces missing values with values taken from other similar respondents’ records in the same dataset.
The imputation methods described above all result in underestimation of the variance because the imputed values are treated as ‘truth’ and subsequent analyses typically ignore the uncertainty in the imputations. Multiple imputation, first developed by Rubin (1987), allows one to account for this uncertainty. In multiple imputation, a stochastic imputation procedure is used to create, say, m imputations for each missing value. These m completed datasets are used in the standard analysis of the data. The variation among estimates from the m analyses is used to estimate the variance due to imputation. It is combined with the usual variance from the standard analyses to provide an overall variance of the estimates. For most larger surveys, m can be fairly modest: m 5 is often adequate.
4. Other Sources Of Error
There are other sources of nonsampling error that can effect survey data. Errors caused by interviewer bias, panel rotation, survey mode, coding, and data entry are all errors that should be avoided in conducting surveys. We will briefly consider panel rotation and survey mode errors.
Panel rotation error occurs when responses to a survey change depending on the length of time the panel has been included in the survey. Bailar (1975) described the effects of time-in-sample for the US Current Population Survey. In general, the longer a person has been in the sample, the less likely the person is to report being unemployed. A similar effect is found in the US National Crime Victimization Survey; persons in the survey for a longer time are less likely to report a victimization. Possible explanations for this phenomenon include that respondents learn to answer the survey so as to minimize the amount of time it takes to complete the survey or that differential dropout leads to a biased sample over time.
Survey modes include in-person, telephone, self-administered paper-and-pencil questionnaires and, most recently, self-administered Web questionnaires. The same questions asked using different survey modes can elicit different responses. For example, respondents are more concerned about their self-images in personal interviews than on paper-and pencil surveys. Thus, they may be more likely to report personal problems on a self-administered questionnaire than in a face-to-face interview. On the other hand, security and confidentiality concerns may make respondents less likely to respond truthfully to surveys on the Web. The accuracy of responses to Web surveys is an area of ongoing research.
Additional information on these other sources of nonsampling error can be found in references such as Groves (1989) and Biemer et al. (1991). An excellent example of a survey for which all sources of error, both sampling and nonsampling, are explored in detail is the US Current Population Survey (see US Department of Commerce 2000).
Bibliography:
- American Association for Public Opinion Research 1998 Standard definitions: Final dispositions of case codes and outcome rates for RDD telephone surveys and in-person household surveys. AAPOR, Ann Arbor, MI
- Bailar B A 1975 The effects of rotation group bias on estimates from panel surveys. Journal of the American Statistical Association 70: 23–30
- Biemer P P, Groves R M, Lyberg L E, Mathiowetz N A, Sudman S 1991 Measurement Errors in Sur eys. Wiley, New York
- Bosecker R R, Ford B L 1976 Multiple frame estimation with stratified overlap domain. Proceedings of the Social Statistics Section of the American Statistical Association. 219–24
- Brick J M, Kalton G 1996 Handling missing data in survey research. Statistical Methods in Medical Research 5: 215–38
- Cochran W G 1977 Sampling Techniques, 3rd edn. Wiley, New York
- Groves R M 1989 Survey Errors and Survey Costs. Wiley, New York
- Kish L 1949 A procedure for objective respondent selection within the household. Journal of the American Statistical Association 44: 380–7
- Kish L 1965 Survey Sampling. Wiley, New York
- Krosnick J A, Alwin D F 1987 An evaluation of a cognitive theory of response-order effects in survey measurement. Public Opinion Quarterly 51(2): 201–19
- Lavrakas P J 1993 Telephone Survey Methods, 2nd edn. Sage, Newbury Park, CA
- Lessler J T, Kalsbeek W D 1992 Nonsampling Error in Surveys. Wiley, New York
- Little R J A, Rubin D B 1987 Statistical Analysis with Missing Data. Wiley, New York
- Lohr S L 1999 Sampling: Design and Analysis. Duxbury Press, Pacific Grove, CA
- Mosteller F 1978 Errors: Nonsampling errors. In: Kruskal W H, Tanur J M (eds.) The International Encyclopedia of Statistics. Free Press, New York, pp. 208–29
- Nathan G 1988 A Bibliography: on Randomized Response: 1965– 1987. Survey Methodology 14: 331–46
- Rubin D B 1987 Multiple Imputation for Nonresponse in Surveys. Wiley, New York
- US Department of Commerce, Census Bureau 2000 Current Population Survey: Design and Methodology. Government Printing Office, Washington, DC
- Warner S L 1965 Randomized response: A survey technique for eliminating evasive answer bias. Journal of the American Statistical Association 60: 63–9
ORDER HIGH QUALITY CUSTOM PAPER

Always on-time

Plagiarism-Free

100% Confidentiality