
View sample Model-Based Approaches to Sample Surveys Research Paper. Browse other statistics research paper examples and check the list of research paper topics for more inspiration. If you need a religion research paper written according to all the academic standards, you can always turn to our experienced writers for help. This is how your paper can get an A! Feel free to contact our research paper writing service for professional assistance. We offer high-quality assignments for reasonable rates.
The theory for sample surveys has been developed using two theoretical frameworks: design-based and model-based. The design-based approach uses the probabilities with which units are selected for the sample for inference; in the model-based approach, the investigator hypothesizes a joint probability distribution for elements in the finite population, and uses that probability distribution for inference. In this research paper, the two approaches are described and compared, and guidelines are given for when, and how, one should perform a model-based analysis of survey data. The use of models for survey design is discussed briefly.
Academic Writing, Editing, Proofreading, And Problem Solving Services
Get 10% OFF with 24START discount code
1. Inference In Sample Surveys
How does one generalize from individuals in a sample to those not observed? The problem of induction from a sample was much debated by philosophers, social scientists, and mathematicians of the eighteenth and nineteenth centuries, including Immanuel Kant, Charles Peirce, John Venn, and Adolphe Quetelet. In the early years of the twentieth century, many investigators resisted the idea of using survey samples rather than censuses for ‘serious statistics’ because of inference issues. The debates involving official uses of sample surveys in these years resulted in the development of two philosophical frameworks for inference from a sample: design-based inference and model-based inference.
In design-based inference, first expounded systematically by Neyman (1934), the sample design provides the mechanism for inferences about the population. Suppose that a without-replacement probability sample of n units is to be taken from a population of N units. A random variable Zi is associated with the ith unit in the population; Zi = 1 if the unit is selected for inclusion in the sample, and Zi = 0 if the unit is not selected. The joint probability distribution of {Z1,…, ZN } is used for inference statements such as confidence intervals.
The quantity being measured on unit i, yi, is irrelevant for inference in the design-based approach. Whether yi is household income, years of piano lessons, or number of cockroaches in the kitchen, properties of estimators depend exclusively on properties of the random variables {Z1, …, ZN} that describe the probability sampling design. The Horvitz– Thompson (1952) estimator,
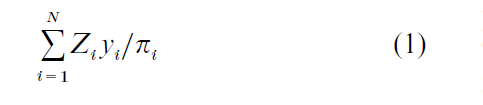
where πi = P(Zi = 1), is an unbiased estimator of the population total ∑Ni=1yi; the variance of the Horvitz– Thompson estimator,
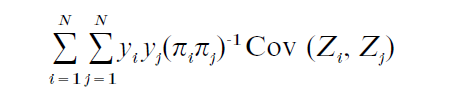
depends on the covariance structure of {Z1, …, ZN}.
The design-based approach differs from the inferential framework used in most other areas of statistics. There, yi is the observed value of a random variable Yi; the joint probability distribution of the Yi’s and proposed stochastic models allow inferential statements to be made. Following questions raised by Godambe (1955) about optimal estimation and survey inference, Brewer (1963) and Royall (1970) suggested that the same model-based frameworks used in other areas of statistics also be used in finite population sampling. Thompson (1997) summarized various approaches to prediction using models.
In the model-based approach to inference, the finite population values are assumed to be generated from a stochastic model. Regression models are often adopted for this purpose: if covariates xi1, xi2, …, xip are known for every unit in the population, a possible model is
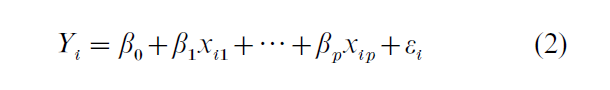
where the εi’s are random variables with mean zero and specified covariance structure. The parameters βj for j = 0, …, p may be estimated by standard techniques such as generalized least squares, and the regression equation used to predict the value of y for units not in the sample. Then the finite population total is estimated by summing the observed values of the yi’s for units in the sample and the predicted values of the response for units not in the sample.
To illustrate the two approaches, consider a hypothetical survey taken to study mental health status in a population of 10,000 women over age 65. A stratified random sample of 100 urban women and 100 rural women is drawn from a population of 6,000 urban women and 4,000 rural women over age 65. One response of interest is the score on a depression inventory. Let yU denote the sample mean score for the urban women and let yR denote the sample mean score for the rural women.
Under the design-based approach as exposited in Cochran (1977), πi = 1/60 if person i is in an urban area and πi = 1/40 if person i is in a rural area. Every urban woman in the sample represents herself and 59 other urban women who are in the population but not in the sample; every sampled rural woman represents herself plus 39 other rural women. The Horvitz– Thompson estimator for the mean depression score for the population is N−1 ∑Ni=1 Ziyi /πi; here, the estimated population mean score under the stratified random sampling design is 0.6y + 0.4yR. A 95 percent confidence interval (CI) for the mean refers to the finite population: if a CI were calculated for each possible sample that could be generated using the sampling design, the selection probabilities of the samples whose CIs include the true value of the population mean depression score sum to 0.95. Inference refers to repeated sampling from the population, not to the particular sample drawn.
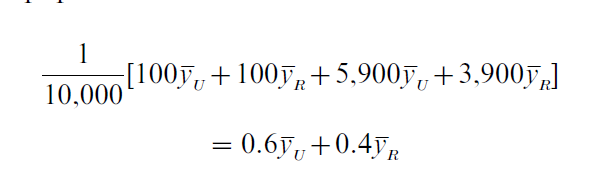
Any number of stochastic models might be considered in a model-based approach. Consider first a special case of the regression model in Eqn. (2), and assume that the εi’s are independent and normally distributed with constant variance. Model 1 has the form Yi = β0 + β1xi + εi, where xi = 1 if person i is an urban resident and xi = 0 if person i is a rural resident. The stochastic model provides a link between sampled and unsampled units: women who are not in the sample are assumed to have the same mean depression score as women with the same urban rural status who are in the sample. Under Model 1, β0 = yR and β1 =yU– yR are the least squares estimates of β0 and β1. Thus the predicted value of y for each urban woman is yU, and the predicted value of y for each rural woman is yR. The model-based estimate of mean depression in this population is thus
With Model 1, the point and interval estimates of the finite population mean are the same as for the designbased approach. The 95 percent confidence interval is interpreted differently, however; 95 percent of CIs from samples with the same values of xi that could be generated from the model are expected to contain the true value of β0 + 0.6β1.
In this example, model-based inference with Model 1 accords with the results from design-based inference. But suppose that the model adopted is Model 2: Y = µ + εi. Then the predicted value of the response for all women in the finite population is y = ( yU + yR)/2, and the mean depression score for the finite population is also estimated by y. If depression is higher among rural women than among urban women, the estimate y from Model 2 will likely overestimate the true mean depression score in the population of 10,000 women because rural women are not proportionately represented in the sample.
In the model-based approach, inference is not limited to the 10,000 persons from whom the sample is drawn but applies to any set of persons for whom the model is appropriate. Random selection of units is not required for inference as long as the model assumptions hold. If the model is comprehensive enough to include all important information, as in Model 1 above, then the sampling design is irrelevant and can be disregarded for inference.
The two types of inference differ in the conception of randomness. Design-based inference relies on the randomness involved in sample selection; it relates to the actual finite population, and additional assumptions are needed to extend the inferences to other possible populations. Model-based inference is conditional on the selected sample; the randomness is built into the model, and the model assumptions are used to make inferences about units not in the sample. Design-based inference depends on other possible samples that could have been selected from the finite population but were not, while model-based inference depends on other possible populations that could have been generated under the model but were not.
The approaches are not completely separated in practice. Rao (1997) summarized a conditional designbased approach to inference, in which inference is restricted to a subset of possible samples. Sarndal et al. (1992) advocated a model-assisted approach, in which a population model inspires the choice of estimator, but inference is based on the sampling design. In the depression example, a model-assisted estimator could incorporate auxiliary information such as race, ethnicity, and marital status through a model of the form in Eqn. (2); however, the stratified random sampling design is used to calculate estimates and standard errors.
2. Models In Descriptive And Analytic Uses Of Surveys
Estimating a finite population mean or total is an example of a descriptive use of a survey: the characteristics of a particular finite population are of interest. In much social science research, survey data are used for analytic purposes: investigating relationships between factors and testing sociological theories. Data from the US National Crime Victimization Survey may be used to estimate the robbery rate in 1999 (descriptive), or they may be used to investigate a hypothesized relationship between routine activities and likelihood of victimization (analytic). In the former case, the population of inference is definite and conceivably measurable through a census. In the latter, the population of inference is conceptual; the investigator may well be interested in predicting the likelihood of victimization of a future person with given demographic and routine activity variables.
Smith (1994) argued that design-based inference is the appropriate paradigm for official descriptive statistics based on probability samples. Part of his justification for this position was the work of Hansen et al. (1983), who provided an example in which small deviations from an assumed model led to large biases in inference. Brewer (1999) summarized work on design-based and model-based estimation for estimating population totals and concluded that a modelassisted generalized regression estimator (see Sarndal et al. 1992), used with design-based inference, captures the best features of both approaches. Models must of course always be used for inference in nonprobability samples; they may also be desirable in probability samples that are too small to allow the central limit theorem to be applied for inference.
Lohr (1999 Chap. 11) distinguished between obtaining descriptive official statistics and uncovering a ‘universal truth’ in an analytic use of a survey. Returning to the depression example, the investigator might be interested in the relationship between depression score ( y) and variables such as marital status, financial resources, number of chronic health problems, and ability to care for oneself. In this case, the investigator would be interested in testing a theory that would be assumed to hold not just for the particular population of 10,000 women but for other populations as well, and should be making inferential statements about the βs in model (2). The quantity for inference in the design-based setting is bp, the least squares estimate of β that would be obtained if the xis and yi were known for all 10,000 persons in the finite population. The quantity bp would rarely be of primary interest to the investigator, though, since it is merely a summary statistic for this particular finite population. In social research, models are generally motivated by theories, and a model-based analysis allows these theories to be tested empirically.
The generalized least squares estimator of β, βLS, would be the estimator of choice under a pure model-based approach because of its optimality properties under the proposed model. This estimator is, however, sensitive to model misspecification. An alternative, which achieves a degree of robustness to the model at the expense of a possibly higher variance, is to use the design-based estimator of bp. If the proposed stochastic model is indeed generating the finite population and if certain regularity conditions are met, an estimator that is consistent for estimating bp will also be consistent for estimating β. Under this scenario, a design-based estimate for bp also estimates the quantity of primary interest β and has the advantage of being less sensitive to model misspecification.
Regardless of philosophical differences on other matters of inference, it is generally agreed that two aspects of descriptive statistics require the use of models. All methods currently used to adjust for nonresponse employ models to relate nonrespondents to respondents, although the models are not necessarily testable. In small area estimation, sample sizes in some subpopulations of interest are too small to allow estimates of sufficient precision; models are used to relate such subpopulations to similar subpopulations and to useful covariates.
3. Models For Small Area Estimation
In small area estimation, a model is used to estimate the response in subpopulations with few or no sample observations. As an example, the US Current Population Survey (CPS) provides accurate statistics about income and poverty for the nation as a whole. It was not designed, though, to provide accurate estimates in domains such as states, counties, or school districts—the sample would have to be prohibitively large in order to provide precise estimates of poverty for every county in the USA. These domains are called small areas—the term ‘small’ does not refer to the size of the area or the population, but to the fact that the sample size in the domain is small or may even be zero.
Consider the states to be the small areas, and let yk be the proportion of school-age children who are poor in state k. The direct estimate yk of yk is calculated using data exclusively from the CPS, and V(yk) is an estimate of the variance of yk. Since in some states V( yk) is unacceptably large, the current practice for estimating poverty at the state level (see National Research Council, 2000, p. 49) uses auxiliary information from tax returns, food stamp programs, and the decennial census to supplement the data from the CPS. A regression model for predicting yk using auxiliary information gives predicted values
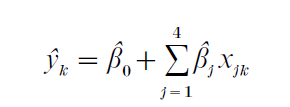
where the xjk s represent covariates for state k (e.g., x1k is the proportion of child exemptions reported by families in poverty in state k, and x2k is the proportion of people receiving food stamps in state k). The predicted value yk from the regression equation is combined with the direct estimate yk from the CPS according to the relative amounts of information present in each: the small area estimate for state k is
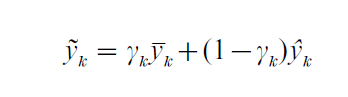
where γk is determined by the relative precision of yk and yk. If the direct estimate is precise for a state, i.e., V( yk) is small, then γk is close to one and the small area estimate yk relies mostly on the direct estimate. Conversely, if the CPS contains little information about state k’s poverty rate, then γk is close to zero and yk relies mostly on the predicted value from the regression model.
The small area model allows the estimator for area k to ‘borrow strength’ from other areas and incorporate auxiliary information from administrative data or other sources. Ghosh and Rao (1994) and Rao (1999) review properties of this model and other models used in small area estimation.
4. Performing A Model-Based Analysis
The first step in a model-based analysis for either descriptive or analytical use is to propose and fit a model to the data. Dependence among units, such as dependence among children in the same school, can be treated using hierarchical linear models or other methods discussed in Skinner et al. (1989).
The biggest concern in a model-based analysis, as pointed out by Hansen et al. (1983), is that the model may be misspecified. Many, but not all, of the assumptions implicit in a model can be checked using the sample data. Appropriate plots of the data provide some graphical checks of model adequacy and correctness of the assumed variance structure, as described in Lohr (1999). These assumptions can also be partially checked by performing hypothesis tests of nested models, and by fitting alternative models to the data. In the depression example, plotting the data separately for rural and urban residents would reveal inadequacy of Model 2 relative to Model 1.
Another method that can sometimes detect model inadequacy is comparison of design-based and model-based estimates of model parameters. As mentioned in Sect. 2, if the model is correct for units in the finite population, then the design-based estimates and the model-based estimates should both be consistent for the model parameters. A substantial difference in the estimates could indicate that the sample design contains information not captured in the model, and that perhaps more covariates are needed in the model.
One crucial assumption that cannot be checked using sample data is that the model describes units not n the sample. This assumption is especially important in nonprobability samples and in use of models for nonresponse adjustment or small area estimation.
5. Models In Survey Design
Kalton (1983) distinguished between the use of models in survey analysis and in survey design, stating that ‘the use of models to guide the choice of sample design is well-established and noncontroversial.’ In good survey practice, a stratified sampling design is often chosen because it is thought that there are differences among stratum means. An unequal probability design may be employed because of prior belief that large counties have more variability in total number of crime victimizations than small counties; models provide a mechanism for formalizing some of the knowledge about population structure and exploring results of alternative assumptions. Cochran (1977) illustrated the use of models for designing systematic samples. Sarndal et al. (1992, Chap. 12) summarized research on optimal survey design, in which auxiliary information about the population is used to select a design that minimizes the anticipated variance of an estimator under the model and design.
Models used for design purposes do not affect the validity of estimates in design-based inference. A poor model adopted while designing a probability sample may lead to larger variance of design-based estimates, but the estimates will retain properties such as unbiasedness under repeated sampling. A good model at the design stage often leads to a design with greatly increased efficiency.
A model-based analysis can be conducted on data from any sample, probability or non-probability. Probability sampling is in theory unnecessary from a pure model-based perspective, and Thompson (1997) and Brewer (1999) concluded that certain forms of purposive non-probability sampling can be superior to probability sampling when a model-based analysis is to be conducted and the model is correct. In practice, however, there is always concern that the assumed model may miss salient features of the population, and probability sampling provides some protection against this concern. For a ratio model, with Yi = βxi + ε+ and V [εi] = σ2xi, the model-based optimal design specifies a purposive sample of the population units with the largest x values. Such a design does not allow an investigator to check whether the model is appropriate for small xs; an unequal probability sample with πi proportional to xi does allow such model checking, and allows inferences under either design- or model- based frameworks. As Brewer (1999) pointed out, there is widespread public perception that ‘randomized sampling is fair’ and that perception provides a powerful argument for using probability sampling for official statistics.
The following sources are useful for further exploration of modes of inference in sample surveys. Lohr (1999, Chap. 11) provides a more detailed heuristic discussion of the role of models in survey sampling; Thompson (1997) gives a more mathematical treatment. The articles by Smith (1994), Rao (1997), and Brewer (1999) contrast inferential philosophies, discuss appropriate use of models in analysis of survey data, and provide additional references.
Bibliography:
- Brewer K R W 1963 Ratio estimation and finite populations: some results deducible from the assumption of an underlying stochastic process. Australian Journal of Statistics 5: 93–105
- Brewer K R W 1999 Design-based or prediction-based inference? Stratified random vs. stratified balanced sampling. International Statistical Review 67: 35–47
- Cochran W G 1977 Sampling Techniques, 3rd edn. Wiley, New York
- Ghosh M, Rao J N K 1994 Small area estimation: An appraisal. Statistical Science 9: 55–76
- Godambe V P 1955 A unified theory of sampling from finite populations. Journal of the Royal Statistical Society B 17: 269–78
- Hansen M H, Madow W G, Tepping B J 1983 An evaluation of model-dependent and probability-sampling inferences in sample surveys. Journal of the American Statistical Association 78: 776–93
- Horvitz D G, Thompson D J 1952 A generalization of sampling without replacement from a finite universe. Journal of the American Statistical Association 47: 663–85
- Kalton G 1983 Models in the practice of survey sampling. International Statistical Review 51: 175–88
- Lohr S L 1999 Sampling: Design and Analysis. Duxbury Press, Pacific Grove, CA
- National Research Council 2000 Small-area Income and Poverty
- Estimates: Priorities for 2000 and Beyond. Panel on Estimates of Poverty for Small Geographic Areas, Committee on National Statistics. National Academy Press, Washington, DC
- Neyman J 1934 On the two different aspects of the representative method: The method of stratified sampling and the method of purposive selection. Journal of the Royal Statistical Society 97: 558–606
- Rao J N K 1997 Developments in sample survey theory: An appraisal. Canadian Journal of Statistics 25: 1–21
- Rao J N K 1999 Some recent advances in model-based small area estimation. Survey Methology 25: 175–86
- Royall R M 1970 On finite population sampling theory under certain linear regression models. Biometrika 57: 377–87
- Sarndal C E, Swensson B, Wretman J 1992 Model Assisted Survey Sampling. Springer-Verlag, New York
- Skinner C J, Holt D, Smith T M F 1989 Analysis of Complex Surveys. Wiley, New York
- Smith T M F 1994 Sample surveys 1975–1990; an age of reconciliation? International Statistical Review 62: 5–34
- Thompson M E 1997 Theory of Sample Surveys. Chapman & Hall, London
ORDER HIGH QUALITY CUSTOM PAPER

Always on-time

Plagiarism-Free

100% Confidentiality