
View sample Multidimensional Scaling Research Paper. Browse other statistics research paper examples and check the list of research paper topics for more inspiration. If you need a religion research paper written according to all the academic standards, you can always turn to our experienced writers for help. This is how your paper can get an A! Feel free to contact our research paper writing service for professional assistance. We offer high-quality assignments for reasonable rates.
The term ‘Multidimensional Scaling’ or MDS is used in two essentially different ways in statistics (de Leeuw and Heiser 1980a). MDS in the wide sense refers to any technique that produces a multi-dimensional geo- metric representation of data, where quantitative or qualitative relationships in the data are made to correspond with geometric relationships in the representation. MDS in the narrow sense starts with information about some form of dissimilarity between the elements of a set of objects, and it constructs its geometric representation from this information. Thus the data are ‘dissimilarities,’ which are distance-like quantities (or similarities, which are inversely related to distances). This entry only concentrates on narrow-sense MDS, because otherwise the definition of the technique is so diluted as to include almost all of multivariate analysis.
Academic Writing, Editing, Proofreading, And Problem Solving Services
Get 10% OFF with 24START discount code
MDS is a descriptive technique, in which the notion of statistical inference is almost completely absent. There have been some attempts to introduce statistical models and corresponding estimating and testing methods, but they have been largely unsuccessful. I introduce some quick notation. Dissimilarities are written as δij, and distances are dij(X ). Here i and j are the objects of interest. The n × p matrix X is the configuration, with coordinates of the objects in Rp. Often, data weights wij are also available, reflecting the importance or precision of dissimilarity δij.
1. Sources Of Distance Data
Dissimilarity information about a set of objects can arise in many different ways. This research paper reviews some of the more important ones, organized by scientific discipline.
1.1 Geodesy
The most obvious application, perhaps, is in sciences in which distance is measured directly, although generally with error. This happens, for instance, in triangulation in geodesy, in which measurements are made which are approximately equal to distances, either Euclidean or spherical, depending on the scale of the experiment.
In other examples, measured distances are less directly related to physical distances. For example, one could measure airplane, road, or train travel distances between different cities. Physical distance is usually not the only factor determining these types of dissimilarities.
1.2 Geography Economics
In economic geography, or spatial economics, there are many examples of input–output tables, where the table indicates some type of interaction between a number of regions or countries. For instance, the data may have n countries, where entry fij indicates the number of tourists traveling, or the amount of grain exported, from i to j. It is not difficult to think of many other examples of these square (but generally asymmetric) tables. Again, physical distance may be a contributing factor to these dissimilarities, but certainly not the only one.
1.3 Genetics Systematics
A very early application of a scaling technique was Fisher (1922). He used crossing-over frequencies from a number of loci to construct a (one-dimensional) map of part of the chromosome. Another early application of MDS ideas is in Boyden (1931), where reactions to sera are used to give similarities between common mammals, and these similarities are then mapped into three-dimensional space.
In much of systematic zoology, distances between species or individuals are actually computed from a matrix of measurements on a number of variables describing the individuals. There are many measures of similarity or distance which have been used, not all of them having the usual metric properties. The derived dissimilarity or similarity matrix is analyzed by MDS, or by cluster analysis, because systematic zoologists show an obvious preference for tree representations over continuous representations in p.
1.4 Psychology Phonetics
MDS, as a set of data analysis techniques, clearly originates in psychology. There is a review of the early history, which starts with Carl Stumpf around 1880, in de Leeuw and Heiser (1980a). Developments in psychophysics concentrated on specifying the shape of the function relating dissimilarities and distances, until Shepard (1962) made the radical proposal to let the data determine this shape, requiring this function only to be increasing.
In psychophysics, one of the basic forms in which data are gathered is the ‘confusion matrix.’ Such a matrix records how many times row-stimulus i was identified as column-stimulus j. A classical example is the Morse code signals studied by Rothkopf (1957). Confusion matrices are not unlike the input– output matrices of economics.
In psychology (and marketing) researchers also collect direct similarity judgments in various forms to map cognitive domains. Ekman’s color similarity data is one of the prime examples (Ekman 1963), but many measures of similarity (rankings, ratings, ratio estimates) have been used.
1.5 Psychology Political Science Choice Theory
Another source of distance information is ‘preference data.’ If a number of individuals indicate their preferences for a number of objects, then many choice models use geometrical representations in which an individual prefers the object she is closer to. This leads to ordinal information about the distances between the individuals and the objects, e.g., between the politicians and the issues they vote for, or between the customers and the products they buy.
1.6 Biochemistry
Fairly recently, MDS has been applied in the conformation of molecular structures from nuclear resonance data. The pioneering work is Crippen (1977), and a more recent monograph is Crippen and Havel (1988). Recently, this work has become more important because MDS techniques are used to determine protein structure. Numerical analysts and mathematical programmers have been involved, and as a consequence there have been many new and exciting developments in MDS.
2. An Example
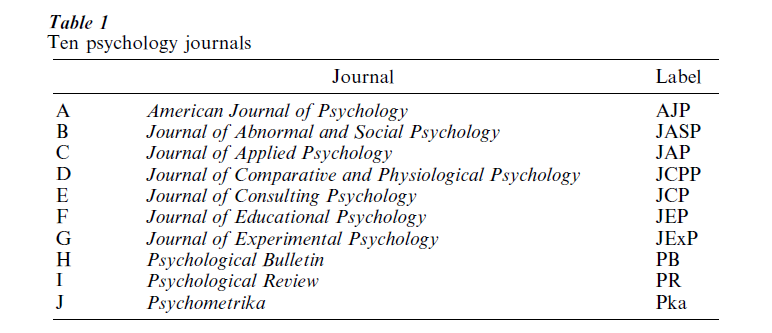
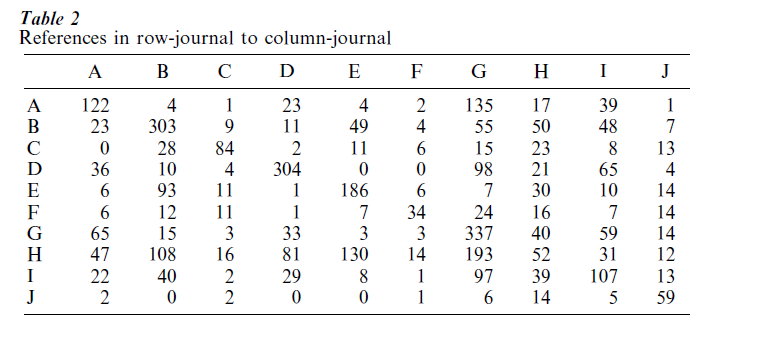
Section 1 shows that it will be difficult to find an example that illustrates all aspects of MDS. We select one that can be used in quite a few of the techniques discussed. It is taken from Coombs (1964, p. 464). The data are cross-references between ten psychological journals. The journals are given in Table 1. The actual data are in Table 2. the basic idea, of course, is that journals with many cross-references are similar.
3. Types Of MDS
There are two different forms of MDS, depending on how much information is available about the distances. In some of the applications reviewed in Sect. 1 the dissimilarities are known numbers, equal to distances, except perhaps for measurement error. In other cases only the rank order of the dissimilarities is known, or only a subset of them is known.
3.1 Metric Scaling
In metric scaling the dissimilarities between all objects are known numbers, and they are approximated by distances. Thus objects are mapped into a metric space, distances are computed, and compared with the dissimilarities. Then objects are moved in such a way that the fit becomes better, until some loss function is minimized.
In geodesy and molecular genetics this is a reasonable procedure because dissimilarities correspond rather directly with distances. In analyzing input– output tables, however, or confusion matrices, such tables are often clearly asymmetric and not likely to be directly translatable into distances. Such cases often require a model to correct for asymmetry and scale. The most common class of models (for counts in a square table) is E ( fij) =αi βj exp { -φ(dij(X ))}, where φ is some monotone transformation through the origin. For φ equal to the identity this is known as the choice model for recognition experiments in mathematical psychology (Luce 1963), and as a variation of the quasi-symmetry model in statistics (Haberman 1974). The negative exponential of the distance function was also used by Shepard (1957) in his early theory of recognition experiments.
As noted in Sect. 1.3, in systematic zoology and ecology, the basic data matrix is often a matrix in which n objects are measured on p variables. The first step in the analysis is to convert this into an n × n matrix of similarities or dissimilarities. Which measure of (dis)similarity is chosen depends on the types of variables in the problem. If they are numerical, Euclidean distances or Mahanalobis distances can be used, but if they are binary other dissimilarity measures come to mind (Gower and Legendre 1986). In any case, the result is a matrix which can be used as input in a metric MDS procedure.
3.2 Nonmetric Scaling
In various situations, in particular in psychology, only the rank order of the dissimilarities is known. This is either because only ordinal information is collected (for instance by using paired or triadic comparisons) or because, while the assumption is natural that the function relating dissimilarities and distances is monotonic, the choice of a specific functional form is not.
There are other cases in which there is incomplete information. For example, observations may only be available on a subset of the distances, either by design or by certain natural restrictions on what is observable. Such cases lead to a distance completion problem, where the configuration is constructed from a subset of the distances, and at the same time the other (missing) distances are estimated. Such distance completion problems (assuming that the observed distances are measured without error) are currently solved with mathematical programming methods (Alfakih et al. 1998).
3.3 Three-Way Scaling
In ‘three-way scaling’ information is available on dissimilarities between n objects on m occasions, or for m subjects. Two easy ways of dealing with the occasions is to perform either a separate MDS for each subject or to perform a single MDS for the average occasion. Three-way MDS constitutes a strategy between these two extremes.
This technique requires computation of m MDS solutions, but they are required to be related to each other. For instance, one can impose the restriction that the configurations are the same, but the transformation relating dissimilarities and distances are different. Or one could require that the projections on the dimensions are linearly related to each other in the sense that dij(Xk) = dij(XWk), where Wk is a diagonal matrix characterizing occasion k. A very readable introduction to three-way scaling is Arabie et al. (1987).
3.4 Unfolding
In ‘multidimensional unfolding,’ information is only available about off-diagonal dissimilarities, either metric or nonmetric. This means dealing with two different sets of objects, for instance individuals and stimuli or members of congress and political issues, and dissimilarities between members of the first set and members of the second set, and not on the withinset dissimilarities. This typically happens with preference and choice data, in which how individuals like candies, or candidates like issues is known, but not how the individuals like other individuals, and so on.
In many cases, the information in unfolding is also only ordinal. Moreover, it is ‘conditional,’ which means that while it is known that a politician prefers one issue over another, it is not known if a politician’s preference for an issue is stronger than another politician’s preference for another issue. Thus the ordinal information is only within rows of the off-diagonal matrix. This makes unfolding data, especially nonmetric unfolding data, extremely sparse.
3.5 Restricted MDS
In many cases it makes sense to impose restrictions on the representation of the objects in MDS. The design of a study may be such that the objects are naturally on a rectangular grid, for instance, or on a circle or ellipse. Often, incorporating such prior information leads to a more readily interpretable and more stable MDS solution.
As noted in Sect. 3.3, some of the more common applications of restricted MDS are to three-way scaling.
4. Existence Theorem
The basic existence theorem in Euclidean MDS, in matrix form, is due to Schoenberg (1935). A more modern version was presented in the book by Torgerson (1958).
I give a simple version here. Suppose E is a nonnegative, hollow, symmetric matrix or order n, and suppose Jn = In – I/n enen is the ‘centering’ operator. Here In is the identity, and en is a vector with all elements equal to one. Then E is a matrix of squared Euclidean distances between n points in Rp only if – 1/2 JnEJn is positive semi-definite of rank less than or equal to p. This theorem has been extended to the classical non-Euclidean geometries, for instance by Blumenthal (1953). It can also be used to show that any nonnegative, hollow, symmetric E can be embedded ‘nonmetrically’ in n – 2 dimensions.
5. Loss Functions
5.1 Least Squares On The Distances
The most straightforward loss function to measure fit between dissimilarities and distances is STRESS, defined by
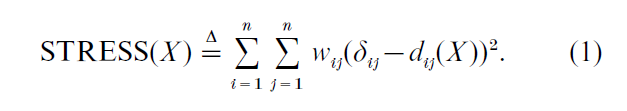
Obviously this formulation applies to metric scaling only. In the case of nonmetric scaling, the major breakthrough in a proper mathematical formulation of the problem was Kruskal (1964). For this case, STRESS is defined as,
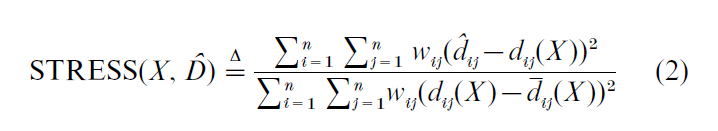
and this function is minimized over both X and D, where D satisfies the constraints imposed by the data. In nonmetric MDS the D are called disparities, and are required to be monotonic with the dissimilarities. Finding the optimal D is an ‘isotonic regression problem.’ In the case of distance completion problems (with or without measurement error), the dij must be equal to the observed distances if these are observed, and they are otherwise free.
One particular property of the STRESS loss function is that it is not differentiable for configurations in which two points coincide (and a distance is zero). It is shown by de Leeuw (1984) that at a local minimum of STRESS, pairs of points with positive dissimilarities cannot coincide.
5.2 Least Squares On The Squared Distances
A second loss function, which has been used a great deal, is SSTRESS, defined by
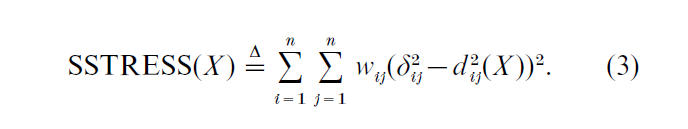
Clearly, this loss function is a (fourth-order) multivariate polynomial in the coordinates. There are no problems with smoothness, but often a large number of local optima results.
Of course a nonmetric version of the SSTRESS problem can be confronted, using the same type of approach used for STRESS.
5.3 Least Squares On The Inner Products
The existence theorem discussed above suggests a third way to measure loss. Now the function is known as STRAIN, and it is defined, in matrix notation, as
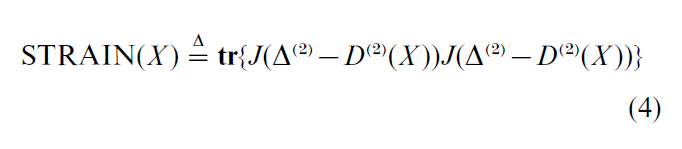
where D(2) (X ) and ∆(2) are the matrices of squared distances and dissimilarities, and where J is the centering operator. Since JD(2) (X )J = -2XX` this means that -1/2J∆(2) J is approximated by a positive semi-definite matrix of rank r, which is a standard eigenvalue–eigenvector computation.
Again, nonmetric versions of minimizing STRAIN are straightforward to formulate (although less straightforward to implement).
6. Algorithms
6.1 Stress
The original algorithms (Kruskal 1964) for minimizing STRESS use gradient methods with elaborate stepsize procedure. In de Leeuw (1977) the ‘majorization method’ was introduced. It leads to a globally convergent algorithm with a linear convergence rate, which is not bothered by the nonexistence of derivatives at places where points coincide. The majorization method can be seen as a gradient method with a constant step-size, which uses convex analysis methods to prove convergence.
More recently, faster linearly or superlinearly convergent methods have been tried successfully (Glunt et al. 1993, Kearsley et al. 1998).
One of the key advantages of the majorization method is that it extends easily to restricted MDS problems (de Leeuw and Heiser 1980b). Each subproblem in the sequence is a least squares projection problem on the set of configurations satisfying the constraints, which is usually easy to solve.
6.2 SSTRESS
Algorithms for minimizing SSTRESS were developed initially by Takane et al. (1977). They applied cyclic coordinate descent, i.e., one coordinate was changed at the time, and cycles through the coordinates were alternated with isotonic regressions in the nonmetric case. More efficient alternating least squares algorithms were developed later by de Leeuw, Takane, and Browne (cf. Browne (1987)), and superlinear and quadratic methods were proposed by Glunt and Liu (1991) and Kearsley et al. (1998).
6.3 STRAIN
Minimizing STRAIN was, and is, the preferred algorithm in metric MDS. It is also used as the starting point in iterative nonmetric algorithms. Recently, more general algorithms for minimizing STRAIN in nonmetric and distance completion scaling have been proposed by Trosset (1998a, 1998b).
7. Analysis Of The Example
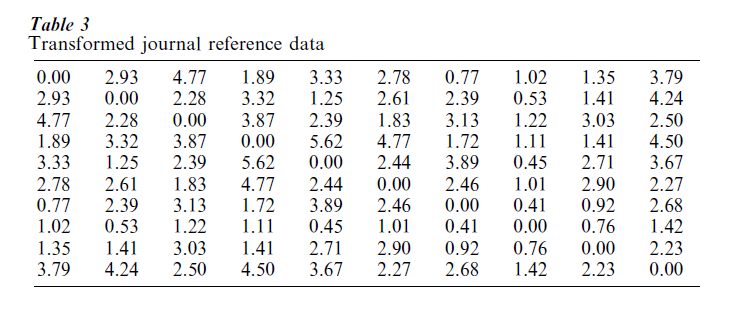
7.1 Initial Transformation
In the journal reference example, suppose E( fij) = αiβj exp { – φ(dij(X ))}. In principle this model can be tested by contingency table techniques. Instead the model is used to transform the frequencies to estimated distances, yielding
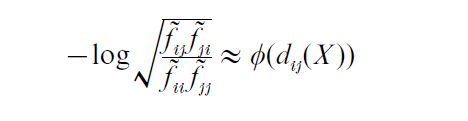
where fij = fij + 1/2 . This transformed matrix is given in Table 3.
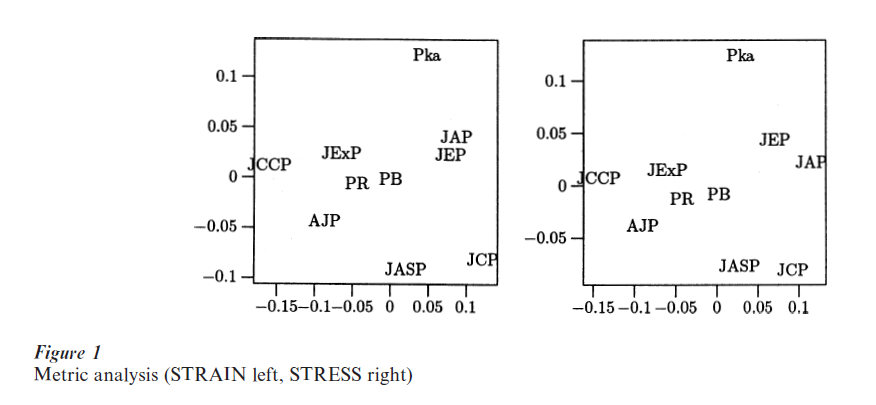
7.2 Metric Analysis
In the first analysis, suppose the numbers in Table 3 are approximate distances, i.e., suppose that φ is the identity. Then STRAIN is minimized, using metric MDS by calculating the dominant eigenvalues and corresponding eigenvectors of the doubly-centered squared distance matrix. This results in the following two-dimensional configurations. The second analysis iteratively minimizes metric STRESS, using the majorization algorithm. The solutions are given in Fig. 1. Both figures show the same grouping of journals, with Pka as an outlier, the journals central to the discipline, such as AJP, JExP, PB, and PR, in the middle, and more specialized journals generally in the periphery. For comparison purposes the STRESS of the first solution is 0.0687, that of the second solution is 0.0539. Finding the second solution takes about 30 iterations.
7.3 Nonmetric STRESS Analysis
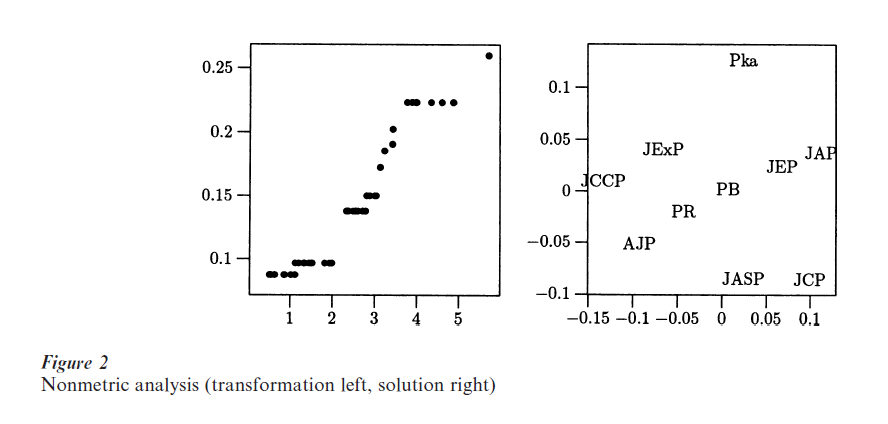
Next, nonmetric STRESS is minimized on the same data (using only their rank order). The solution is in Fig. 2. The left panel displays the transformation relating the data in Table 3 to the optimally transformed data, a monotone step function. Again, basically the same configuration of journals, with the same groupings emerges. The nonmetric solution has a (normalized) STRESS of 0.0195, and again finding it takes about 30 iterations of the majorization method. The optimal transformation does not seem to deviate systematically from linearity.
8. Further Reading
Until recently, the classical MDS reference was the little book by Kruskal and Wish (1978). It is clearly written, but very elementary. A more elaborate practical introduction is by Coxon (1982), which has a useful companion volume (Davies and Coxon 1982) with many of the classical MDS papers. Some additional early intermediate-level books, written from the psychometric point of view, are Davison (1983) and Young (1987).
More recently, more modern and advanced books have appeared. The most complete treatment is no doubt Borg and Groenen (1997), while Cox (1994) is another good introduction especially aimed at statisticians.
Bibliography:
- Alfakih A Y, Khandani A, Wolkowicz H 1998 Solving Euclidean distance matrix completion problems via semidefinite programming. Computational Optimization and Applications 12: 13–30
- Arabie P, Carroll J D, DeSarbo W S 1987 Three-Way Scaling and Clustering. Sage, Newbury Park
- Blumenthal L M 1953 Distance Geometry. Oxford University Press, Oxford, UK
- Borg I, Groenen P 1997 Modern Multidimensional Scaling. Springer, New York
- Boyden A 1931 Precipitin tests as a basis for a comparitive phylogeny. Proceedings of the Society for Experimental Biology and Medicine 29: 955–7
- Browne M 1987 The Young–Householder algorithm and the least squares multidimensional scaling of squared distances. Journal of Classification 4: 175–90
- Coombs C H 1964 A Theory of Data. Wiley, New York
- Cox T F 1994 Multidimensional Scaling. Chapman and Hall, New York
- Coxon A P M 1982 The User’s Guide to Multidimensional Scaling: With Special Reference to the MDS(X) Library of Computer Programs. Heinemann, Exeter, NH
- Crippen G M 1977 A novel approach to calculation of conformation: Distance geometry. Journal of Computational Physics 24: 96–107
- Crippen G M, Havel T F 1988 Distance Geometry and Molecular Conformation. Wiley, New York
- Davies P M, Coxon A P M 1982 Key Texts in Multidimensional Scaling. Heinemann, Exeter, NH
- Davison M L 1983 Multidimensional Scaling. Wiley, New York
- de Leeuw J 1977 Applications of convex analysis to multidimensional scaling. In: Barra J R, Brodeau F, Romier G, van Cutsem B (eds.) Recent Developments in Statistics: Proceedings of the European Meeting of Statisticians, Grenoble, 6–11 September, 1976. North Holland, Amsterdam, The Netherlands, pp. 133–45
- de Leeuw J 1984 Differentiability of Kruskal’s stress at a local minimum. Psychometrika 49: 111–3
- de Leeuw J, Heiser W 1980a Theory of multidimensional scaling. In: Krishnaiah P (ed.) Handbook of Statistics. North Holland, Amsterdam, The Netherlands, Vol. II
- de Leeuw J, Heiser W J 1980b Multidimensional scaling with restrictions on the configuration. In: Krishnaiah P (ed.) Multivariate Analysis. North Holland, Amsterdam, The Netherlands, Vol. v, pp. 501–22
- Ekman G 1963 Direct method for multidimensional ratio scaling. Psychometrika 23: 33–41
- Fisher R A 1922 The systematic location of genes by means of cross-over ratios. American Naturalist 56: 406–11
- Glunt W, Hayden T L, Liu W M 1991 The embedding problem for predistance matrices. Bulletin of Mathematical Biology 53: 769–96
- Glunt W, Hayden T, Rayden M 1993 Molecular conformations from distance matrices. Journal of Computational Chemistry 14: 114–20
- Gower J C, Legendre P 1986 Metric and Euclidean properties of dissimilarity coeffi Journal of Classification 3: 5–48
- Haberman S J 1974 The Analysis of Frequency Data. University of Chicago Press, Chicago
- Kearsley A J, Tapia R A, Trosset M W 1998 The solution of the metric STRESS and SSTRESS problems in multidimensional scaling using Newton’s method. Computational Statistics 13: 369–96
- Kruskal J B 1964 Multidimensional scaling by optimizing goodness of fit to a nonmetric hypothesis. Psychometrika 29: 1–27
- Kruskal J B, Wish M 1978 Multidimensional Scaling. Sage, Beverly Hills, CA
- Luce R 1963 Detection and recognition. In: Luce R D, Bush R R, Galanter E (eds.) Handbook of Mathematical Psychology. Wiley, New York, Vol. 1
- Rothkopf E Z 1957 A measure of stimulusa similarity and errors in some paired-associate learning tasks. Journal of Experimental Psychology 53: 94–101
- Schoenberg I J 1935 Remarks on Maurice Frechet’s article Sur la definition axiomatique d’une classe d’espaces distancies vectoriellement applicable sur l’espace de Hilbert. Annals of Mathematics 724–32
- Shepard R N 1957 Stimulus and response generalization: A stochastic model relating generalization to distance in psychological space. Psychometrika 22: 325–45
- Shepard R N 1962 The analysis of proximities: Multidimensional scaling with an unknown distance function. Psychometrika 27: 125–40, 219–46
- Takane Y, Young F W, de Leeuw J 1977 Nonmetric individual differences in multidimensional scaling: An alternating least squares method with optimal scaling features. Psychometrika 42: 7–67
- Torgerson W S 1958 Theory and Methods of Scaling. Wiley, New York
- Trosset M W 1998a Applications of multidimensional scaling to molecular conformation. Computing Science and Statistics 29: 148–52
- Trosset M W 1998b A new formulation of the nonmetric strain problem in multidimensional scaling. Journal of Classification 15: 15–35
- Young F W 1987 Multidimensional Scaling: History, Theory, and Applications. Earlbaum, Hillsdale, NJ
ORDER HIGH QUALITY CUSTOM PAPER

Always on-time

Plagiarism-Free

100% Confidentiality