
Sample Economics Of Philanthropy Research Paper. Browse other research paper examples and check the list of research paper topics for more inspiration. If you need a religion research paper written according to all the academic standards, you can always turn to our experienced writers for help. This is how your paper can get an A! Feel free to contact our research paper writing service for professional assistance. We offer high-quality assignments for reasonable rates.
Philanthropy is defined as benevolent behavior, usually in the form of charitable gifts, toward others in society. Charitable giving accounts for a significant fraction of income in the USA and other nations, and is often directly encouraged through government tax policy. This research paper discusses the motives, causes, and influences of philanthropic behavior. Special emphasis is placed on how government policy, through the charitable deduction on income taxes and through direct grants to charities, can affect the amount of philanthropy in the economy.
Academic Writing, Editing, Proofreading, And Problem Solving Services
Get 10% OFF with 24START discount code
1. Introduction
In the late 1990s the media tycoon Ted Turner announced a gift of one billion dollars to the United Nations, software titan Bill Gates donated five billion dollars toward health and education in the developing world, and Oseola McCarthy, an 89-year-old laundrywoman from Mississippi, gave her life savings of $150,000 to establish scholarships for black college students in her state. These are examples of philanthropic, or charitable, behavior—individuals freely giving money to help others. Most people are, in fact, philanthropists, although not on the scale of the three mentioned above. Through the last few decades of the twentieth century, over two-thirds of Americans donated money to charity in any given year, with households giving over two percent of income on average. In 1997, those that gave to charity averaged donations of over $1,000. In fact, people spend more on charitable giving than they do on electricity, telephones, or car insurance.
In addition, the government is an active partner with private donors in funding the charitable sector of the economy. It does this in two ways. First, are direct grants to charities. In 1994, for instance, charitable organizations reported receiving $51.9 billion in government grants. The second way the government spends money on charity is by excluding income spent on charitable donations from income tax. The US tax code was modified in 1917 to allow taxpayers to deduct their charitable donations from their taxable incomes, and by 1998 individuals were claiming over $86 billion in charitable deductions.
This research paper will describe how economists think about and do research on philanthropy, what economists know about charitable giving, and how public policy influences it. The focus will be primarily on gifts of money and assets by individuals, although corporations and other institutions also make charitable gifts (see Boatsman and Gupta 1996), and people also give by volunteering time (see Brown and Lankford 1992). In addition, the discussion will center on philanthropy in the USA, since a large majority of the academic research has centered on the US experience (for information on charitable organizations internationally, see Anheier and Salamon 1996). Finally, the entry will highlight what challenges remain ahead for the study of philanthropy.
2. An Economist’s View Of Charitable Behavior
Economics is founded on the view that people are self-interested. Economists assume that since individuals have a choice in how they behave, they must always make the choices that they think are the best at the time. This assumption, called the ‘axiom of rationality,’ provides the bedrock from which economic models of behavior are formed.
Applying this framework to philanthropic behavior, we can ask why would people who work hard for their money simply turn around and give it away? Does this not contradict the assumption that individuals are self-interested? Maybe. But by the axiom of rationality, we should first look for ways in which an individual believes that giving to charity is the best thing to do with that money at that time.
One possibility is that people desire more of the service provided by the charity. National Public Radio (NPR), for instance, is a charitable organization that survives largely on donations. Over a million people a year give to NPR, with most giving under $100. Are these givers getting their money’s worth? Certainly not. Anyone can listen to NPR broadcasts, even without donating, and anyone who gives $100 is unlikely to notice any increase in broadcast quality as a result. It follows that a self-interested person is better off giving nothing and taking a ‘free ride’ on the donations of others. Hence, this alone cannot be an adequate explanation for why people give to charity (Andreoni 1988).
A second reason is that individuals may be getting something directly from the charity in exchange for their contributions. For instance, big donors to the opera may get better seats, or donors to a university may get buildings named for them. While this must surely matter for large donors, most individuals only receive tokens (a coffee mug?), if anything, in exchange for donations.
A third reason could be that individuals get some internal satisfaction—a ‘warm-glow’—from giving to their favored charity, and the more they give the better they feel (Andreoni 1989). This would mean that giving to charity is like buying any other good, such as ice cream. We easily accept that people have a natural taste for ice cream, so why not a natural taste for warm glow? If we accept this, then we can analyze charitable giving just like any other consumer good—when income goes up people should want more, and when the price goes up people should want less.
Scholars have examined preferences for giving from a number of different approaches, and it seems that warm glow is in fact a core economic motivation for giving (see Andreoni 1993). That is not to say it is the only reason for giving. People may also give from a sense of religious duty, from pressure at work or from friends, or as a signal of social status (Rose-Ackerman 1996). At the heart of all of these processes, however, seems to be a basic human interest in helping others or doing one’s share. This, of course, raises a deeper question that may require a broader social science perspective to answer: why do people enjoy acting unselfishly? This is a question that, fortunately, we do not have to answer to continue with this research paper. We can take as our launching point that people get joy from giving, and we can apply our economist’s tools for analyzing consumer behavior to begin studying charitable giving.
3. The Facts About Philanthropy In The USA
How do we learn about charitable giving? One source is surveys of consumers. The Independent Sector for instance, surveyed about 2,500 households by telephone. Surveys are valuable since they can obtain information on age, education levels, and other personal characteristics of respondents. A disadvantage is that individuals must rely on imprecise memories when answering questions, or may be reluctant to give true information about their incomes or donations.
A second important source is samples of tax returns. Since individuals who itemize their tax returns in the USA can take a charitable deduction, we can learn about donations for this sector of the economy. The advantage of tax returns is that the information on them is precise, as long as people do not cheat on their taxes. (Slemrod 1989 explored this potential problem and found that, while there is some evidence of cheating by overstating charitable deductions, the effects are small and do not appreciably affect the analysis.) The disadvantage to this data is that tax returns contain very little information about the personal characteristics of the filers that would be helpful in explaining giving, such as education levels or religious affiliation, nor can we learn about the giving habits of those who do not itemize their tax returns. Since no data source is perfect, economists must conduct many studies on many data sources in order to uncover the ‘facts’ on charitable giving.
3.1 Sources, Totals, And Trends In Giving
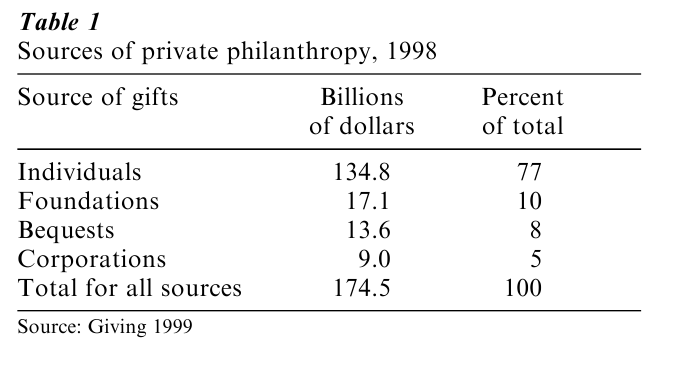
Charitable donations can come from individuals, charitable foundations, corporations, or through bequests. While all are significant, by far the dominant source of giving is from individuals. Table 1 shows that in 1998 individuals gave over 134 billion dollars to charity, or 77 percent of the total dollars donated. The second biggest source, foundations, was responsible for only 10 percent of all donations.
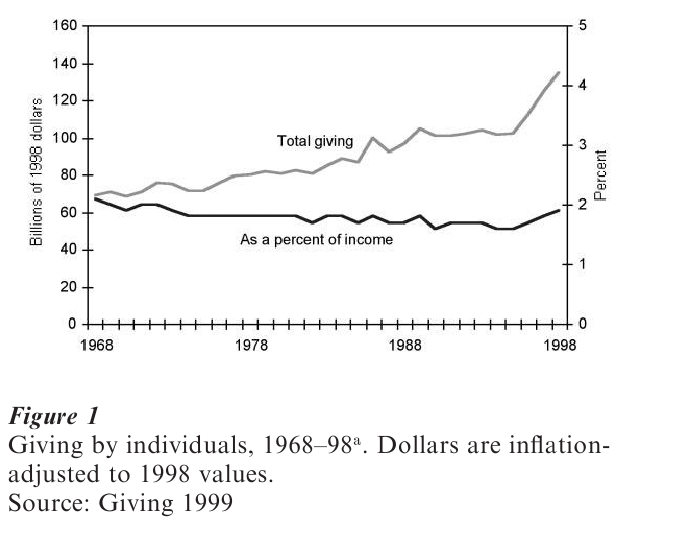
The trends in giving over the last 30 years can be seen in Fig. 1. Total giving has been on a steady rise, with especially big jumps coming in 1996, 1997, and 1998. When measured as a percentage of income, however, giving seems much more stable. Since 1968 giving has varied from 1.6 percent to 2.1 percent of income. In the most recent year shown, 1998, giving ticked up to 2.1 percent of income, the highest in 30 years.
3.2 Who Gives?
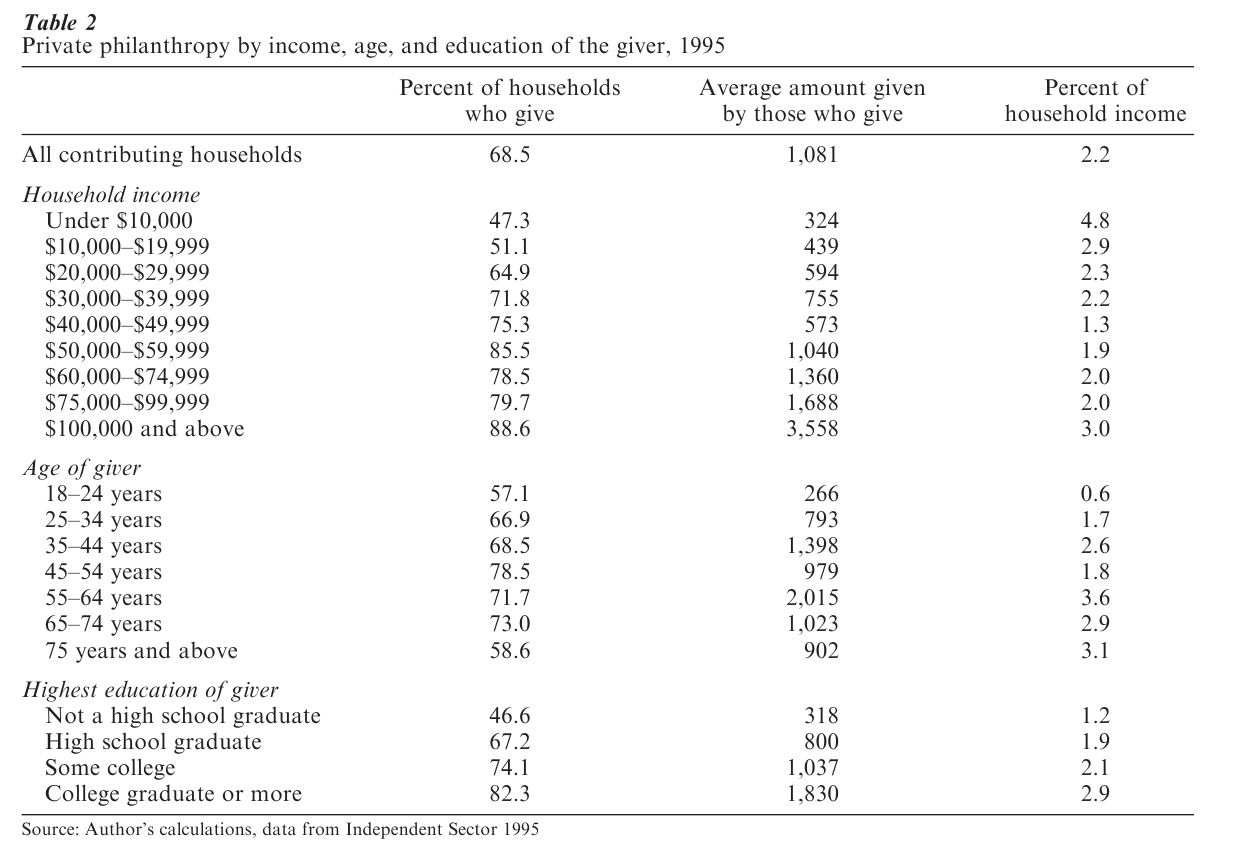
Surveys reveal that 68.5 percent of all households gave to charity in 1995 and that the average gift among those giving was $1,081. Table 2 shows that the more income a household has, the more likely the household is to give to charity, and the more it gives when it does donate. This table also reveals an interesting pattern typically found in charitable statistics. Those with the lowest incomes give over four percent of income to charity. As incomes grow to about $50,000, gifts fall to 1.3 percent of income, but then rise again to 3.4 percent for the highest incomes.
What could cause this ‘U-shaped’ giving pattern? One explanation is that those with low incomes may be young people who know their wages will be rising, hence they feel they can afford more giving now. It may also be due to the composition of the types of charities to which people give, since lower-income people tend to give significantly more to religious causes. Hence, it will be important to account for all the factors that may explain giving before offering explanations for the averages seen in these tables.
Table 2 also illustrates that giving varies significantly with the age and educational attainment of the givers. As people get older they are typically more likely to give to charity and to give a greater fraction of their incomes. Likewise, those with more education give more often, give more dollars, and generally give a higher fraction of income. Note that the table does not show a smooth acceleration of giving with age. Again, age, education, and income all vary with each grouping in the table and will have to be considered jointly.
3.3 What Do They Give To?
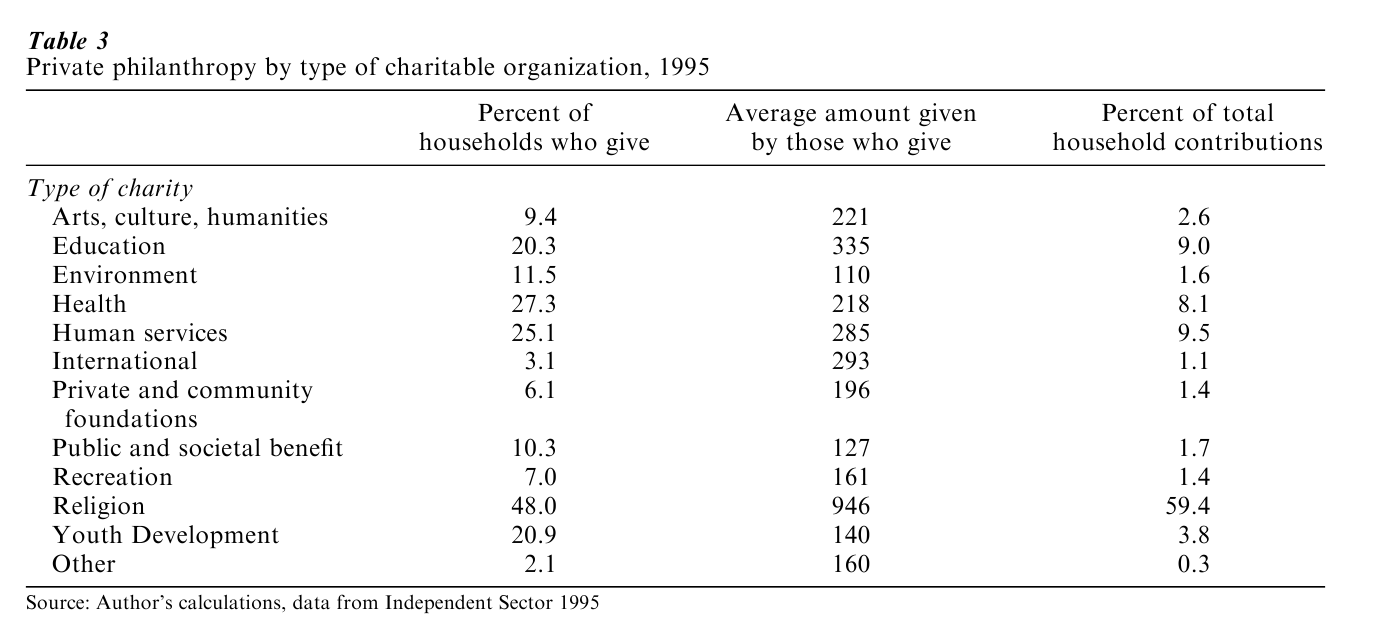
In 1997 over 45,000 charitable, religious, and other nonprofit organizations filed with the US government. Table 3 attempts to categorize these charities by the types of service they provide. This reveals that, among all types, households are most likely to give to religious organizations and to give them the most money—48 percent of all households give to religion and 59 percent of all charitable dollars go to religion.
4. Taxes And Giving
How can taxes encourage philanthropic behavior? Taxpayers in the USA who itemize their deductions can deduct their charitable giving from their taxable income (and from 1982 to 1986 the law also allowed nonitemizers a limited charitable deduction). If someone in the 15 percent marginal tax bracket gives $100 to charity and takes a charitable deduction, this person will save $15 in taxes, making the net cost of the gift $85. If the person was in the 31 percent tax bracket then the $100 gift would have a net cost of $69. Thus, the higher one’s tax rate, the lower the net cost of giving. In this way the tax rate acts as a subsidy rate to giving, and those in higher tax brackets get bigger subsidies. (Note that state income taxes often add additional subsidies. See Feenberg 1987.)
Since the tax deduction subsidizes giving, we should expect that those with higher subsidies will make larger contributions. It is also natural to expect that those with higher incomes will make larger contributions. However, those with higher incomes will typically also have higher subsidies, so when we see richer people giving more how can we know whether their income or the subsidy is causing the change? If we can compare people with similar subsidy rates but different incomes, and similar incomes but different subsidy rates, we can apply statistical techniques to separate the influences of income and the subsidy.
Disentangling these is, of course, very important for policy makers. If, for instance, the subsidy does not increase giving at all, then the policy is costing the government tax dollars without benefiting the charities. If, on the other hand, the subsidy lifts giving significantly, it may be an effective tool to increase social well-being. Generally, policy makers look for the increase in contributions due to the subsidy (the benefit) to be larger than the loss in tax dollars (the cost). The next section discusses how economists explore this issue.
4.1 The Effect Of The Subsidy On Giving
Economists began conducting detailed empirical studies of giving in the 1970s in an attempt to isolate the effect of the subsidy on giving (see Clotfelter 1985 for a review). You can imagine asking the counterfactual policy question this way: consider a proposal that would allow a taxpayer to deduct only 70 percent (or 50 percent or 20 percent, etc.) of his or her charitable contributions for tax purposes, rather than the 100 percent allowed now. This means that the net cost of a $100 contribution would rise. For someone in the 28 percent marginal tax bracket, for instance, the cost would rise from $72 to $80. We would expect that this higher cost would discourage giving, but by how much?
The first generation of studies to explore this counterfactual relied on cross-sectional data, primarily from tax returns. Observing income and deductions for thousands of people in a given tax year, the researchers used the variations in income and cost to estimate how, on average, individuals would respond to such a change in policy. There were several limiting features of the data used in these studies. Of particular importance is that the samples, for reasons of confidentiality, typically did not include extremely wealthy people.
Depending on the source of the data, the years studied, the size of the sample, and the statistical approach, the results naturally varied. It has been generally agreed, however, that the prediction that best characterizes the results is that a policy that would increase the cost by 10 percent for all taxpayers— without affecting the other income taxes paid by the individual—would reduce contributions by about 13 percent (Clotfelter 1990). This suggests that behavior is quite responsive to the incentives offered by the tax deduction, and that the response is large enough to satisfy the policy criterion noted above. In particular, if the government pays an additional 10 percent of the cost of giving and if people respond by giving 13 percent more, then the policy generates more new charity than it costs the government in tax revenue.
These studies also confirmed that giving increases with income. If after-tax incomes were to rise by 10 percent, estimates are that giving would rise by about 8 percent (Clotfelter 1990). Notice that this quantifies the left-hand part of the U-shaped giving curve discussed in Sect. 2—since giving rises by a lesser percentage than income, giving as a percentage of income (all else equal) must be declining.
Later studies were able to supplement these findings using data from surveys rather than tax returns (see Clotfelter 1990, Steinberg 1990). Although the survey results varied, they generally confirmed the policy predictions stated above. In addition, they revealed the importance of other individual characteristics in explaining giving. Most strikingly, they consistently found that giving increases with the age and the education of the giver, again as suggested in the tables above. It could be that those who are educated have more interest in charity or that interest in charity changes with age. A more plausible explanation, however, is that researchers have no information on individual wealth. Since wealth is correlated with both age and education, it is likely that the influence of wealth is being filtered through these other variables.
A second generation of studies, conducted mostly in the 1990s, has begun to shift the consensus view noted above. Unlike the earlier studies that relied on cross-sectional data, these newer studies used panel data, that is, data with observations on the same set of individuals over several years. Panel data is generally seen to be superior to cross-sectional data. The reason is that by observing the same people at different points in time the researcher is able to get a more precise measure of how behavior responds to changes in the environment.
The most influential study with panel data is by Randolph (1995). Using tax returns on about 12,000 people from 1979 to 1988, and using statistical techniques designed explicitly for panel data, he identified a much weaker effect of the subsidy and a much stronger effect of income. His results indicate that a policy that would increase the cost of giving by 10 percent would reduce giving by only about 5 percent, whereas if income were to rise by 10 percent, giving would rise by 11 percent. Others using panel data have found similar effects. Hence, at the end of the 1990s the literature on the effect of the subsidy to giving was in a state of flux. More studies with panel data are needed to reconcile the early and later findings, and to reach a new consensus on the effects of the subsidy.
Finally, these studies cannot reveal all of the subtle and complex influences on giving. Other things outside of these studies clearly matter, such as the social circles to which people relate, the religious organizations to which they belong, and the activities of fundraisers. While many of these influences lie beyond the scope of economic analysis, when economists have examined social factors the effects seem to be small and do not appreciably change the predictions for policy (Andreoni and Scholz 1998). Still, studies that examine noneconomic influences could lead to new insights on policies toward giving.
4.2 The Effects Of Tax Reforms On Giving
During the 1980s there were two major tax reforms that dramatically changed the two important variables discussed above: the cost of giving and after-tax income. Prior to 1980 there were 25 tax brackets, with the top bracket at 70 percent. This meant that a wealthy giver, after the deduction, would pay only 30 cents of each dollar donated. The first tax reform came in 1981. This created 14 tax brackets, with the top rate falling to 50 percent. The second major tax reform, the Tax Reform Act of 1986 (TRA86), was more dramatic. It reduced taxes to two rates, 15 percent and 28 percent. (Actually, it also included a ‘bubble bracket’ of 33 percent for those between $71,900 and $192,930 of annual income, before returning to 28 percent for incomes above this. A 31 percent bracket was added in 1991. Subsequent changes in the law mean that in 1999 there are five brackets: 15 percent, 28 percent, 31 percent, 36 percent, and 39.6 percent.) Hence, most people, but especially those in high tax brackets, had the net cost of their charitable contributions rise.
With the costs of giving going up, many feared that there would be calamitous decline in giving. Auten et al. (1992) and Randolph (1995) looked at the experience from the 1980s and made several interesting discoveries. First, people were sensitive to the anticipation of an increase in their cost. In 1981, for instance, wealthy people saw that the cost of a $100 donation would rise to $50 in 1982 from $30 in 1981, and thus moved up a sizable share of their giving to 1981. For those earning over one million dollars (in 1991 inflation-adjusted dollars), average charitable deductions rose by $32,000 from 1980 to 1981, but fell by $64,000 in 1982. This same sector also anticipated the TRA86, raising deductions by $37,500 in 1986, then reducing them by $52,500 in 1987. Similar, although less pronounced, patterns can be seen in most other income groupings as well. In fact, Randolph (1995) shows econometrically that individuals are far more responsive to short-term (or temporary) changes in the cost of giving than they are to long-term (or permanent) changes.
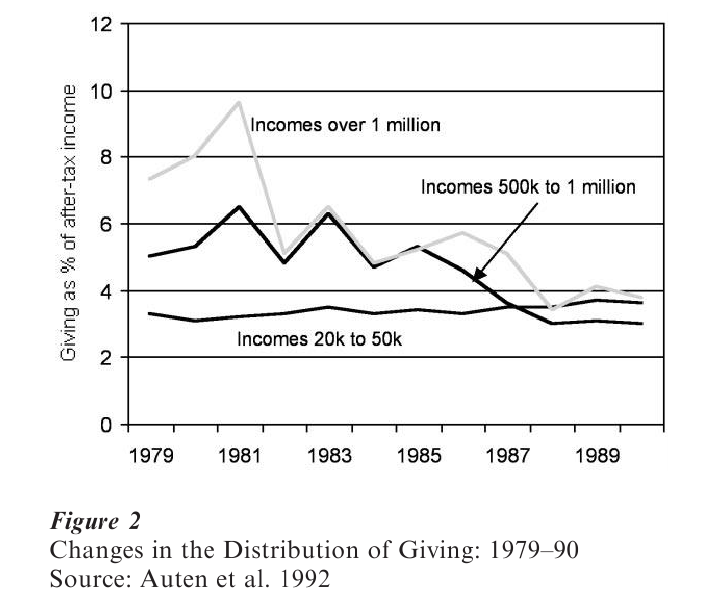
Source: Auten et al. 1992
How did giving change overall in response to the tax reforms? As seen in Fig. 1, dollars given tended to rise over the 1980s, despite this increase in the cost for most individuals. But this does not tell the whole story. First, even though the cost of giving went up, after-tax income also rose for middle-income people, and this should counter the effect of raising the costs. In addition, incomes in general were rising throughout the 1980s. Also, this analysis cannot account for the behavioral response of charities that may have increased their fundraising efforts in response to the tax changes.
Fig. 2 shows one more piece of information that is masked by the averages; that is, that the distribution of giving across income groups also changed. The figure shows that giving by the middle-income group, which is by far the most populous, actually increased as a percentage of income over the 1980s. However, the giving by the wealthy fell quite substantially. To balance this, however, far more people were entering the ranks of the super-rich—the number of tax filers with incomes over one million dollars more than tripled from 1980 to 1989.
4.3 Giving By The Very Wealthy
Auten et al. (2000), in a study of giving by the wealthy, report that in 1994 the 1 percent of US households with the highest income was responsible for over 16 percent of all dollars given. As one might imagine, describing giving by the wealthy in more detail can be complicated, in part because many give through trusts and carryover deductions through several tax years. The most distinguishing characteristic of wealthy givers is perhaps that a great deal of their giving is of appreciated assets, such as art, real estate, or stocks. Donations of appreciated assets are often a heavily tax-favored form of giving (O’Neil et al. 1996). First, the giver can take a deduction on income taxes for the current market value of the asset, not the purchase price, in the year the gift is made. In addition to this, the giver does not have to pay any tax on the capital gains made on the asset. This means gifts of appreciated property often generate two forms of tax savings. Those who had taxable incomes over $2.5 million in 1995 had average charitable deductions of $248,069, 44 percent of which was appreciated property. People with annual incomes of $50,000–$100,000, by comparison, deducted $1,823 on average, of which only 15 percent was appreciated property.
Another distinguishing characteristic of wealthy donors is that their giving is highly variable from year to year. In any given year the median contribution of those making over $2.5 million is only 0.7 percent of income—half the rate of those in the $50,000–$100,000 range. But the 95th percentile gift of the rich is almost 21 percent of income—twice the rate of those in the $50,000–$100,000 range. When averaged over a longer period, however, these numbers become a lot more similar. This indicates that perhaps the super-rich save up their donations over a number of years in order to give bigger gifts when they do give. Why? One reason might be to gain recognition from the charity, such as a brass plate, for being a major donor. Another reason is that large donors are often asked to serve as board members of charities, hence larger gifts can lead to greater control over the future of the organization.
5. Do Government Grants Displace Private Philanthropy?
There are several reasons to suspect that government grants to charities might depress private donations. First, if givers are aware of the grants, then they may perceive the charity as less in need of their donations, leading them to keep the money or give it to a different cause. This is known as the ‘crowding out’ hypothesis (Warr 1982, Roberts 1984, Bergstrom et al. 1986). A second reason giving may decline is that the charity may be less aggressive in fundraising after receiving a government grant. Both effects would lead to government grants to offset private philanthropy.
There are also reasons to think that government grants could have the opposite effect. Citizens who are unsure about the quality of a charity could see a grant as a ‘stamp of approval.’ Alternatively, the grant could be used as ‘seed money’ that will allow the charity to expand into a bigger operation by, for instance, constructing new buildings or opening branches in different cities (Andreoni 1998). In both of these cases, government grants could actually encourage private philanthropy.
From an empirical standpoint, the question of crowding out has been a challenge, and no study to date has been definitive. Three recent studies illustrate the difficulties of this area, and the wide array of findings. Kingma (1989) studied a special sample of givers to National Public Radio (NPR) in 1986. This data is unique in that it ties each giver directly to his or her local NPR station and the grants it receives. He finds that if a typical station were to receive a $10,000 grant, private giving would fall by about $1,350, that is 13.5 percent crowding out.
Two studies using panel data on donations received by charities came to different conclusions. Khanna et al. (1995) used observations on 159 charities in the UK and found that government grants actually encouraged rather than displaced private giving. Payne (1998), using a 10-year panel of 430 US charities, applied special statistical techniques to account for the fact that government grants to charities may be caused by the same needs and interests as private giving. Without accounting for this ‘simultaneity,’ researchers may underestimate crowding out. Payne’s analysis predicts about 50 percent crowding out.
This is clearly a difficult area to study, and all of the researchers must do the best they can with incomplete data. Moreover, researchers have thus far been unable to account for how charitable fundraising, apart from givers’s willingness to donate, responds to government grants. These analyses await future study.
6. Conclusions And Future Research
Philanthropy is a significant factor in the US economy, accounting for about 2 percent of income over the past 30 years. Government and private givers are in a partnership to fund the services of over 45,000 charitable organizations. This research paper has discussed the economic influences on private philanthropy and how it interacts with government policy.
The most important finding is that individuals are indeed sensitive to the charitable deduction in the US tax system. By subsidizing giving, the tax deduction has clearly increased giving by the private sector. Because policies and preferences change with time, new studies are always needed to assess the impact of the deduction. In the 1970s and 1980s, dozens of studies led to a consensus view that the subsidy was highly effective—a 10 percent reduction in the cost of giving led to a 13 percent increase in giving. In the 1990s, new data and new econometric analysis have challenged this view, suggesting that a 10 percent reduction in the cost leads to a 5 percent increase in giving. More studies are needed to clarify the picture about how responsive givers are to the charitable deduction.
The literature on the crowding out of private giving by government grants is also far from settled—some say the crowding out is substantial, at 50 percent, while others find government grants encourage rather than displace private giving. This research makes clear that the study of philanthropy needs to be expanded to consider the role of the charitable organizations more actively in the analysis. Not only do individuals respond to changes in tax policy, but fundraisers do too. How do charities adjust to changes in tax rates or government grants, and how responsive are individuals to fundraising efforts? Exploring these questions will deepen our understanding of philanthropy and help sharpen government policy.
Of course, to accomplish these important research goals, new and better data will be needed. There has not been a large national survey of individual philanthropic behavior since 1973, and another survey could yield many new insights. In addition, data is needed that ties together the actions of fundraisers, private donors, and the government. Such data would allow researchers to learn about the whole market for charitable giving—both supply and demand—and could help form policies to strengthen the partnership between the public and private sector for providing much needed charitable services.
Bibliography:
- Andreoni J 1988 Privately provided public-goods in a large economy: The limits of altruism. Journal of Public Economics 35: 57–73
- Andreoni J 1989 Giving with impure altruism: Applications to charity and Ricardian equivalence. Journal of Political Economy 97: 1447–58
- Andreoni J 1993 An experimental test of the public-goods crowding-out hypothesis. American Economic Review 83: 1317–27
- Andreoni J 1998 Toward a theory of charitable fund-raising. Journal of Political Economy 106: 1186–213
- Andreoni J, Scholz J K 1998 An econometric analysis of charitable giving with interdependent preferences. Economic Inquiry 36: 410–28
- Anheier H K, Salamon L M 1996 The Emerging Nonprofit Sector: An Overview. St. Martin’s Press, New York
- Auten G E, Cilke J M, Randolph W C 1992 The effects of tax reform on charitable contributions. National Tax Journal 45: 267–90
- Auten G E, Clotfelter C T, Schmalbeck R L 2000 Taxes and philanthropy among the wealthy. In: Slemrod J (ed.) Does Atlas Shrug? The Economic Consequences of Taxing the Rich. Harvard University Press, Cambridge, MA, pp. 392–424
- Bergstrom T, Blume L, Varian H 1986 On the private provision of public goods. Journal of Public Economics 29: 25–49
- Boatsman J R, Gupta S 1996 Taxes and corporate charity: Empirical evidence from microlevel panel data. National Tax Journal 49: 193–213
- Brown E, Lankford H 1992 Gifts of money and gifts of time: Estimating the effects of tax prices and available time. Journal of Public Economics 47: 321–41
- Clotfelter C T 1985 Federal Tax Policy and Charitable Giving. The University of Chicago Press, Chicago
- Clotfelter C T 1990 The impact of tax reform on charitable giving: A 1989 perspective. In: Slemrod J (ed.) Do Taxes Matter? The Impact of the Tax Reform Act of 1986. MIT Press, Cambridge, MA, pp. 203–42
- Feenberg D 1987 Are tax price models really identified: The case of charitable giving. National Tax Journal 40: 629–33
- Giving USA 1999 Annual Report. American Association of Fund-Raising Counsel, New York
- Independent Sector 1995 Giving and Volunteering in the United States. Independent Sector, Washington, DC
- Khanna J, Posnett J, Sandler T 1995 Charity donations in the UK: New evidence based on panel-data. Journal of Public Economics 56: 257–72
- Kingma B R 1989 An accurate measurement of the crowd-out effect, income effect, and price effect for charitable contributions. Journal of Political Economy 97: 1197–207
- O’Neil C J, Steinberg R S, Thompson G R 1996 Reassessing the tax-favored status of the charitable deduction for gifts of appreciated assets. National Tax Journal 49: 215–33
- Payne A A 1998 Does the government crowd-out private donations? New evidence from a sample of non-profit firms. Journal of Public Economics 63: 323–45
- Randolph W C 1995 Dynamic income, progressive taxes, and the timing of charitable contributions. Journal of Political Economy 103: 709–38
- Roberts R D 1984 A positive model of private charity and public transfers. Journal of Political Economy 92: 136–48
- Rose-Ackerman S 1996 Altruism, nonprofits, and economic theory. Journal of Economic Literature 34: 701–28
- Slemrod J 1989 Are estimated tax elasticities really just tax evasion elasticities? The case of charitable contributions. Review of Economics and Statistics 71: 517–22
- Steinberg R 1990 Taxes and giving: New findings. Voluntas 1: 61–79
- Warr P G 1982 Pareto optimal redistribution and private charity. Journal of Public Economics 19: 131–8
ORDER HIGH QUALITY CUSTOM PAPER

Always on-time

Plagiarism-Free

100% Confidentiality