
Sample Market Structure and Performance Research Paper. Browse other research paper examples and check the list of research paper topics for more inspiration. If you need a research paper written according to all the academic standards, you can always turn to our experienced writers for help. This is how your paper can get an A! Feel free to contact our research paper writing service for professional assistance. We offer high-quality assignments for reasonable rates.
Why some industries come to be dominated worldwide by a handful of firms, even at the level of the global market, is a question that has attracted continuing interest among economists over the past 50 years—not least because it leads us to some of the most intriguing statistical regularities in the economics literature. Uncovering the forces that drive these regularities provides us with some deep insights into the workings of market mechanisms.
Academic Writing, Editing, Proofreading, And Problem Solving Services
Get 10% OFF with 24START discount code
The literature in this area has developed rapidly since 1980. Indeed, a fairly sharp break occurred at the end of the 1970s, with a new generation of models based on game-theoretic methods. These new models offered an alternative approach to the analysis of cross-industry differences in structure and profitability. Before turning to these models, it is useful to begin by looking at the earlier literature.
1. Preliminaries: Definitions and Measurement
The structure of an industry is usually described by a simple ‘k-firm concentration ratio,’ that is the combined share of industry sales revenue enjoyed by the largest k firms in the industry. Official statistics usually report concentration ratios for several values of k, the case of k 4 being the most commonly used. (From a theoretical point of view, the case k 1 is most natural, but is rarely reported for reasons of confidentiality.) A richer description of structure can be provided by reporting both these ratios and the total number of firms in the industry. If ratios are available for many values of k, we can build up a picture of the size distribution of firms, which is usually depicted in the form of a Lorenz curve. Here, firms are ranked in decreasing order of size and the curve shows for each fraction k n of the n firms in the industry, the combined market share of the largest k firms. (It is more natural in this field to cumulate from the largest unit downwards, rather than from the smallest upwards, as is conventional elsewhere.) Certain summary measures of the size distribution are sometimes used, that of Herfindahl and Hirshman being the most popular (see Hirshman 1964): this is defined as the sum of the squares of firms’ market shares, and its value ranges from 0 to 1. While most measures of market structure are based upon firms’ sales revenue, other measures of firm size are occasionally used, the most common choice being the level of employment.
2. The Cross-section Tradition
The beginnings of the cross-section tradition in the field of industrial organization (IO) are associated with the pioneering work of Joe S. Bain in the 1950s and 1960s (see in particular Bain 1956 and 1966). Bain’s work rested on two ideas.
(a) If the structure of the industry is characterized by a high level of concentration, then firms’ behaviour will be conducive to a more muted degree of competition, leading to high prices and high profits (or ‘performance’). This structure–conduct–performance paradigm posited a direction of causation that ran from concentration to profitability. It therefore raised the question: will the high profits not attract new entry, thereby eroding the high degree of concentration? This leads to Bain’s second idea.
(b) Bain attributed the appearance of high levels of concentration to certain ‘barriers to entry,’ the first of which is the presence of scale economies in production (i.e., a falling average-cost curve). In his pioneering book Barriers to New Competition (1956), Bain reported measures of the degree of scale economies across a range of US manufacturing industries, and went on to demonstrate a clear correlation between scale economies and concentration. This correlation notwithstanding, it was clear that certain industries that did not exhibit substantial scale economies were nonetheless highly concentrated, and this led Bain and his successors to posit additional barriers to entry which included, among others, the industry’s advertising sales ratio and its R and D sales ratio. This raises a serious analytical issue however: while the degree of scale economies can be thought of as exogenously given as far as firms are concerned, the levels of advertising and R and D expenditure are the outcomes of choices made by the firms themselves, and so it is natural to think of these levels as being determined jointly with concentration and profitability as part of the same equilibrium outcome (Phillips 1971, Dasgupta and Stiglitz 1980). This remark provides the key link from the Bain tradition to the modern game-theoretic literature.
2.1 The Modern (Game-theoretic) Literature
A new literature which has developed since 1980 takes a rather different approach to that of the Bain paradigm. First, instead of treating the levels of advertising and R and D as ‘barriers to entry’ facing new firms, these emerge as the outcome of firms individual choices. The models are characterized by ‘free entry,’ but firms that fail to invest as much as rivals on such ‘sunk costs’ suffer a penalty in terms of their future profit flows. The second difference from the Bain approach is that the troublesome question of a possible ‘feedback’ from high profits to subsequent entry is finessed. This is accomplished by formulating the analysis in terms of a simple (game-theoretic) model in which all firms entering the industry anticipate the consequences of their investments on future profit streams.
The multistage game framework is shown in Fig. 1. Over stages 1 to T, firms make various investment decisions (construct a plant, build a brand, spend on R and D). By the end of this process, each firm’s ‘capability’ is determined by the investments it has made. In the final stage subgame (T 1), firms compete in price, their capabilities being taken as given.
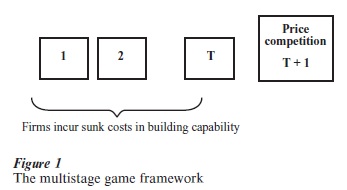
The central problem that underlies this kind of analysis is that there are many reasonable ways of formulating the entry and investment process that takes place in stages 1 to T, just as there are many ways of characterizing the nature of price competition that occurs at stage T 1. Many equally reasonable models could be written down, between which we could not hope to discriminate by reference to the kind of empirical evidence that is normally available. (Such problems are commonplace in the game-theoretic IO literature; see Fisher (1989) and Pelzman (1991) for a critique.)
For this reason, it is useful to begin, not from a single fully specified model, but rather from a ‘class of models,’ defined by a few simple properties (Sutton 1998). The key innovation here lies in moving away from the idea of identifying a fully specified model within which each firm is assigned a ‘set of strategies’ (and where our aim is to identify the combination(s) of strategies that form a (perfect Nash) equilibrium). Instead, an equilibrium concept is defined directly on the set of outcomes that emerge from the investment process that occurs over periods 1 to T. An outcome is described by a list of the firms’ capabilities, from which we can deduce the pattern of market shares that will emerge in the final stage (price competition) subgame. What we aim to do it to place some restrictions on these outcomes, and so on the form of market structure. The restrictions of interest emerge from certain simple and robust properties that must hold good, independently of the detailed design of the entry and investment process. The only assumption imposed on this process is that each firm (‘potential entrant’) is assigned some ‘date of birth’ t between 1 and T, and each firm is permitted to make any (irreversible) investments it chooses either at stage t or at any subsequent stage t+1, t+2, …, T. Given the investments made by the firms (which can be represented formally by a set of points in some abstract ‘set of products’ that the firm is now capable of producing), we define a profit function that summarizes the outcome of the final stage (price competition) subgame. This specifies the (‘gross’) profit earned by the firm in that final stage, as a function of the set of all firms’ capabilities. Finally, it is assumed that there are many potential entrants (in the sense that if all firms made the minimum investment required to enter the industry, then it could not be the case that all firms would earn sufficient profits to recover their outlays). Within the (complete information) setting just described, the set of equilibrium outcomes (formally, the pure strategy perfect Nash equilibrium outcomes) will satisfy two elementary properties:
(a) ‘Viability’: The profit earned by each firm in the final stage subgame suffices to cover the investment costs it incurs.
Restriction (a), together with the assumption of ‘many potential entrants,’ ensures that not all firms will enter the industry. We now focus on any firm that has not entered:
(b) ‘Stability’: Given the configuration of in- vestments undertaken by all the firms who have entered, then there is no investment available to a potential entrant, at time T, such that it will earn a final stage (‘gross’) profit that exceeds its cost of investment.
Outcomes that satisfy (a) and (b) are known as ‘equilibrium configurations.’
From these properties, two sets of results follow. The first set of results pertains to the special case of industries in which neither advertizing nor R and D play a significant role. In analyzing these industries, the only restriction placed on the final stage (‘price competition’) subgame is that a rise in firm numbers or a fall in concentration, holding market size constant, reduces the level of prices and the gross profit earned by each firm. (On this assumption, see Sect. 5 below.) The first result relates to the way in which the level of concentration is affected by the size of the market: as we increase the size of the market (by successive replications of the population of consumers) then the minimum level of concentration that can be supported as an equilibrium configuration falls to zero (‘convergence’). It is important that increases in market size do not necessarily imply convergence to a fragmented market structure: this result specifies only a lower bound to concentration. There will in general be many equilibrium configurations in which concentration lies above this bound.
The second result relates to the way in which, for a market of any given size, this lower bound to concentration is affected by the nature of price competition. Here, the key concept is that of the ‘toughness of price competition,’ which relates to the functional relationship between market structure (number of firms, or level of concentration) and the level of prices or price-cost margins, in the industry. For the sake of illustration, suppose changes in competition law make it more difficult for firms to operate a cartel, or suppose an improvement in transport networks brings into close competition a number of firms that hitherto enjoyed ‘local monopolies.’ In such cirumstances, we have an increase in the toughness of price competition in the present sense, that is for any given market structure, prices and price-cost margins are now lower. The second result states that an increase in the toughness of price competition leads to an upward shift in the lower bound to concentration (leaving unchanged its asymptotic value of zero; see Fig. 2). This result follows from the viability condition alone: the lower bound is defined by the requirement that the viability condition is just satisfied. A rise in the toughness of price competition lowers final stage profit, at a given level of concentration. Restoring viability requires an offsetting rise in concentration.
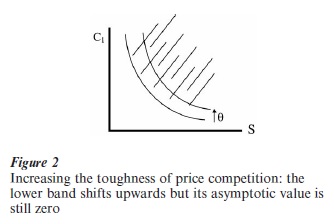
The available empirical evidence offers clear support for this prediction; see Sutton (1991) and Symeonides (2000).
This simple but basic result offers an interesting shift of perspective on the old idea that creating a more fragmented industry structure might offer a way of generating more intense competition, and so lower prices. What it suggests, rather, is that once we treat entry decisions as endogenous then—at least in the long run—the level of concentration and the equilibrium level of prices are jointly determined by the competition policy regime: introducing tough anti-cartel laws, for example, implies inter alia a higher equilibrium level of concentration.
2.2 The Escalation Effect
The second set of results relates to the difference between the industries just considered, where advertising and R and D spending are ‘low,’ and those where advertising and R and D play a significant role. Here, we need to specify how the outlays incurred on advertising and R and D in the earlier stages of the game affect the (‘gross’) profit earned by the firm in the final stage subgame. The key idea runs as follows: denote by F the fixed and sunk cost incurred by the firm, and by Sπ the profit it earns in the final stage subgame. Here, S denotes market size and π is a function of the vector of products entered and so of the fixed costs incurred by all firms in earlier stages. (So long as firms’ marginal cost schedules are flat—an assumption maintained throughout this research paper— and market size increases by way of a replication of the population of consumers so that the pattern of consumer tastes is unaffected, it follows that final stage profit increases in direct proportion to market size, justifying our writing it in this form.)
The main theorem is as follows (Shaked and Sutton (1987)).
Suppose that for some constants a 0 and K 1, a firm that spends K times as much as any rival on fixed outlays will earn a final stage payoff no less than aS; then there is a lower bound to concentration (as measured by the maximal market share of the largest firm), which is independent of the size of the market.
The idea is this: as market size increases, the incentives to escalate spending on fixed outlays rise. Increases in market size will be associated with a rise in fixed outlays by at least some firms, and this effect will be sufficiently strong to exclude an indefinite fall in the level of concentration.
The lower bound to concentration depends on the degree to which an escalation of fixed outlays results in profits at the final stage and so on the ratio a K. We choose the pair (a, K) which maximizes this ratio and write the maximal value of the ratio as α. The theorem says that the number α constitutes a lower bound to the (one-firm) sales concentration ratio.
In order to proceed to empirical testing, it is necessary to get around the fact that α is not easy to measure directly. So long as we have a well-defined market of the classical kind (a point elaborated in Sect. 4), it is easy to develop an ancillary theorem that allows us to use the level of advertising and or R and D intensity as a sufficient statistic for α. Here, we obtain a simple ‘nonconvergence’ prediction, which says that no matter how large the size of the market S, the level of concentration cannot fall below some value C₁. Figure 3 illustrates the basic result for a welldefined market of the classical kind.
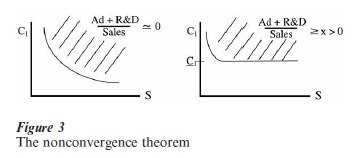
One way of testing this prediction is to look at the same set of advertising-intensive industries across a number of countries of varying size. Since firms must spend on advertising separately in each country to develop their brand image locally, this offers a valid ‘experiment’ relative to the theory. The nonconvergence property illustrated in Fig. 3 has been confirmed by Sutton (1991), Robinson and Chiang (1996), and Lyons et al. (2000).
2.3 Extensions
Underlying the above discussion is an important simplifying assumption relating to the definition of the market. It is tacitly assumed here, as in most of the theoretical literature, that we can think of the market as comprising a number of goods that are more or less close substitutes for each other, and that we can regard all other (‘outside’) goods as being poor substitutes for those in this group. This is the classic approach to the problem of market definition, associated with Robinson (1936): we identify the boundary of the market with a ‘break in the chain of substitutes.’
In practice, this is too simple a picture. The linkages between goods may be quite complex. Apart from the demand side, where goods may be more or less close substitutes, there may also be linkages on the supply side: goods which are independent of each other on the demand side may share some technological characteristics, for example, which imply that a firm producing both goods may enjoy some economies of scope in its R and D activities.
In order to justify the analysis of a single market in isolation from other markets (‘partial equilibrium’), it is necessary to define the market broadly enough to encompass all such linkages. Once we have widened the set of products to this point, however, we are likely to find that there are certain clusters of products that are much more tightly linked to each other, than to products outside the cluster. In other words, the market encompasses a number of ‘submarkets.’
This complication is of particular importance in the context of R and D-intensive industries. It is often the case in these industries that the market comprises a set of submarkets containing products associated with different technologies. The early history of many industries has been marked by competition between rival ‘technological trajectories’. Sometimes, a single ‘dominant’ trajectory emerges (Abernathy and Utterbach 1978). Sometimes, several trajectories meet the preferences of different consumer groups, and all survive. In general, the picture of ‘escalation’ along a single R and D trajectory, which corresponds to the analysis of Sect. 3 above, needs to be extended in this more complex setting. Depending upon the interplay of technology (the effectiveness of R and D along each trajectory) and tastes (the pattern of consumer preferences across products associated with each trajectory), the industry may evolve in one or other of two ways. The first route involves ‘escalation’ along a single dominant trajectory, in the manner of Sect. 3 above. The second route involves the ‘proliferation’ of successive technological trajectories, with their associated product groups (‘submarkets’). In this setting, the predictions of the theory need to be recast in a way that is sensitive to the presence of such distinct submarkets; see Sutton (1998), Part I.
3. Profitability
A central issue of concern in the traditional literature related to the putative link between the level of concentration of an industry, and the average level of profitability enjoyed by the firms (businesses) in that industry. Here, it is necessary to distinguish two quite different questions. The first relates to the way in which a fall in concentration, due for example to the entry of additional firms to the market, affects the level of prices and so of price-cost margins. Here, matters are uncontroversial; that a fall in concentration will lead to a fall in prices and price-cost margins is wellsupported both theoretically and empirically. (This result was embodied as an assumption in the models set out in Sect. 2 above. While theoretical counterexamples can be constructed, they are of a rather contrived kind.) To test this idea it is appropriate to look at a number of markets for the same product, which differ in size (the number of consumers), so that larger markets support more sellers. It can then be checked whether prices and price-cost margins are, therefore, lower in those larger markets which support more sellers. The key body of evidence is that presented in the collection of papers edited by Weiss (1989). For a comprehensive list of relevant studies, see Schmalensee (1989) p. 987.
In terms of the basic models set out in Sect. 2 above, this first question relates to the description of the final stage (price competition) subgame: we are asking how the level of gross profits per firm earned in the final stage subgame relates to the level of concentration that has results from earlier investment decisions. A second, quite different, question relates to the net profit of firms (gross profit minus the investment costs incurred in earlier stages). In the ‘free entry’ models described in Sect. 2, entry will occur up to the point where the gross profits of the marginal entrant are just exhausted by its investment outlay. In the special setting where all firms are identical in their cost structure and in their product specifications, the net profit of each firm will be (approximately) zero, whatever the level of concentration. This symmetric setup provides a useful point of reference, while suggesting a number of channels through which some relationship might appear between concentration and net profits (or more conventionally, by the firm’s rate of return on its earlier investment—gross profit flow per annum divided by the value of the firm’s assets).
There are four channels that are worth noting. (a) Even if all firms are symmetric (whence we can express net profit per firm π as a function of the number of entrants N) free entry implies zero profit only in the sense that π(N)≥ 0 and π(N+1)≤ 0. When N is large, this ‘integer effect’ is unimportant, but in those markets considered in Sect. 2.2, where the number of firms may be very small even if the market is large, this leaves open the possibility of ‘large’ net profits for the firms that enter.
(b) If we, realistically, abandon the assumption that all firms are alike in their cost structures, then we would expect the most efficient firms (those with the lowest level of average variable cost) to produce larger volumes of output at equilibrium. If we compare two hypothetical industries that are alike in all respects, except that the firms forming the pool of (potential) entrants in industry A are alike, but those in industry B differ in their efficiency levels, then we would expect industry B to exhibit both a higher level of concentration and a higher level of (average net) profitability (Demsetz 1973).
(c) Another form of asymmetry between firms may arise, not from any inherent differences in efficiency, but from ‘strategic asymmetries.’ In the models set out in Sects. 2 and 3, the only restriction imposed by the viability condition takes the form of a lower bound to concentration. This lower bound corresponds to a situation in which all earn firms are symmetric ex post, and all earn zero net profit. Above this bound there are other, asymmetric, equilibria, where intra-marginal firms enjoy positive net profit. Outcomes of this kind can arise for several reasons, such as the presence of ‘first mover advantages.’ For example, early entrants to an advertising-intensive industry may spend heavily in advance of rival entry, in building up brand images. Later entrants may then find it optimal to spend less on advertising than these early entrants. Under these circumstances, the first mover may enjoy strictly positive net profits.
(d) If we abandon the maintained assumption of free entry, in favour of the idea—fundamental to Bain’s approach—that high concentration levels are associated with some form of ‘barriers to entry’ that prevent (efficient) firms from entering certain industries, then we would expect these concentrated industries to exhibit high levels of profit, in comparison to a reference group of industries where no such ‘barriers’ were present.
These points notwithstanding, it is important to note that there is no robust theoretical prediction of the kind developed in Sects. 2.1 and 3 above which links concentration to net profits.
4. Empirical Evidence
Following Bain’s early contributions, a large body of empirical work was devoted to the search for correlations, across different manufacturing industries, between concentration and profitability. While the early literature seemed broadly supportive of such a relationship, the interpretation of the results remained highly controversial, the debate being focused primarily on distinguishing between the Bain interpretation ((d) above) and the Demsetz interpretation ((b) above). A turning point in this literature was marked by the appearance of two new databases that allowed the discussion to move beyond its focus on cross industry studies based on average industry profitability, towards an examination of market shares and profitability of each firm within the industry: the Federal Trade Commission’s ‘Line of Business’ dataset, and the PIMS dataset. (See Scherer (1980) for an overview of the main results.)
The most authoritative review of the evidence is that of Schmalensee (1989). A key finding emerges from attempts to discriminate between the views of Bain and Demsetz by regressing the profitability of a business on both the market share of that business, and the level of concentration in the industry concerned. In regressions of this kind, using datasets that span many industries, profitability is strongly and positively correlated with market share, while industry concentration tends not to be positively related to profitability. One important caveat is needed here, in that this finding might suggest that within each industry, firms with larger market shares enjoy higher rates of return: this is not the case. Intra-industries studies of market share versus rates of return suggest that no general relationship of this kind is present. (This, incidentally, is unsurprisingly from a theoretical standpoint: it is easy to find standard examples in which market shares within an industry are either positively or negatively correlated with profitability. In the simple ‘linear demand model,’ for instance, a firm that enters a larger number of product varieties than its rivals will enjoy a larger market share but a lower level of gross profit per product (Sutton 1998, Appendix 2.1).
What appears to be driving these results, as Schmalensee notes, is the presence of a small number of industries in which there is an unusually strong positive correlation between market share and profitability.
Apart from this kind of cross-sectional investigation, a quite different but complementary perspective is provided by the study of the pattern of firms’ profitability over time. Mueller (1986) examined the question of whether, at the firm level, high rates of profitability were transient or persistent over long periods of time. Arguing that observed rates of return showed a substantial degree of persistence over time, Mueller drew attention inter alia to one group of industries (highly concentrated, advertising-intensive industries) as exhibiting unusually high and persistent rates of return. (Observation (c) above provides one candidate interpretation of this finding.)
The above discussion has focused heavily on the role of ‘strategic interactions’ between firms as a driver of market outcomes. It was noted in Sect. 2.3, however, that the general run of markets, as conventionally defined, tend to involve a number of (more or less loosely linked) ‘submarkets.’ The presence of such (approximately) independent submarkets carries some far-reaching implications for the analysis of market structure. In particular, it implies that ‘strategic interactions’ can not in themselves tell the complete story. Any satisfactory theory of market structure must bring together the role of ‘strategic interactions’ between firms or products within each submarket, and the presence of ‘independence effects’ across different submarkets. This becomes particularly important once we begin to look for a richer characterization of market structure by examining the size distribution of firms within each industry. A full discussion of this issue is beyond the scope of this research paper; for details, the reader is referred to Sutton 1997 and (1998, Part II).
Bibliography:
- Abernathy W J, Utterbach J M 1978 Patterns of industrial innovation. Technology Review 80: 40–7 Bain J 1956 Barriers to New Competition. Harvard University Press, Cambridge, MA
- Bain J 1966 International Differences in Industrial Structure: Eight Nations in the 1950s. Yale University Press, New Haven, CT
- Dasgupta P, Stiglitz J E 1980 Industrial structure and the nature of innovative activity. Economic Journal 90: 266–93
- Demsetz H 1973 Industry structure, market rivalry, and public policy. Journal of Law and Economics 16: 1–9
- Fisher F M 1989 Games economists play: A noncooperative view. Rand Journal of Economics 20: 113–24
- Hirshman A O 1964 The paternity of an index. American Economic Review 54: 761
- Lyons B, Matraves C, Moffat P 2000 Industrial concentration and market integration in the european union. Economica 68: 1–26
- Mueller D C 1986 Profits in the Long Run. Cambridge University Press, Cambridge, MA
- Pelzman S 1991 The handbook of industrial organization: A review article. Journal Political Economy 99: 201–17
- Phillips A 1971 Technology and Market Structure: A study of the Aircraft Industry. Heath Lexington, Lexington, MA
- Reinganum J 1989 The timing of innovation: Research, development and diffusion. In: Schmalensee R, Willig R D (eds.) The Handbook of Industrial Organization, ol. 1. Elsevier Science, Amsterdam, pp. 849–908
- Robinson J 1936 Economics of Imperfect Competition. Macmillan, London
- Robinson W T, Chiang J W 1996 Are Sutton’s predictions robust? Empirical insights into advertising, R and D and concentration. Journal of Industrial Economics 44: 389–408
- Scherer F M 1980 Industrial Market Structure and Economics Performance, 2nd edn. Rand McNally College, Chicago, IL
- Schmalensee R 1989 Inter-industry studies of structure and performance. In: Schmalensee R, Willig R D (eds.) The Handbook of Industrial Organisation, Vol. 2. Elsevier Science, Amsterdam, pp. 951–1009
- Shaked A, Sutton J 1987 Product differentiation and industrial structure. Journal of Industrial Economics 36: 131–46
- Sutton J 1991 Sunk Costs and Market Structure. MIT Press, Cambridge, MA
- Sutton J 1997 Gibrat’s legacy. Journal of Economic Literature. 35(1): 40–59
- Sutton J 1998 Technology and Market Structure: Theory and History. MIT Press, Cambridge, MA
- Symeonides G 2000 Price competition and market structure: The impact of cartel policy on concentration in the UK. Journal of Industrial Economics 48: 1–26
- Tirole J 1988 The Theory of Industrial Organization. MIT Press, Cambridge, MA
- Weiss L W 1989 Concentration and Price. MIT Press, Cambridge, MA
ORDER HIGH QUALITY CUSTOM PAPER

Always on-time

Plagiarism-Free

100% Confidentiality