
Sample Analysis Of Large-Scale Social Survey Research Paper. Browse other research paper examples and check the list of research paper topics for more inspiration. If you need a research paper written according to all the academic standards, you can always turn to our experienced writers for help. This is how your paper can get an A! Feel free to contact our research paper writing service for professional assistance. We offer high-quality assignments for reasonable rates.
Large-scale social surveys provide an inexpensive and easily accessible source of information on a wide range of topics including education, health, economics, demography, politics, and criminal justice. These surveys may serve as a primary data source, a preliminary data source to be analyzed prior to conducting a more tailored survey, or in combination with smaller, more specific data sources. After summarizing the advantages of using large-scale social surveys, we discuss how to confront the challenges they present.
Academic Writing, Editing, Proofreading, And Problem Solving Services
Get 10% OFF with 24START discount code
There are many advantages to analyzing data from large-scale social surveys. The data are usually extensive in content and coverage of the target population. Sample sizes are often very large and the data are often easily obtained from the sponsoring agency on CD-ROM or from the internet, in many cases at no cost to the researcher. Moreover, these surveys are typically conducted by large government agencies or private survey organizations that have experienced interviewers, well-designed and tested survey instruments, and the expertise to design efficient sampling plans. As a result, the response rates are typically high (e.g., 75 percent–90 percent) and sophisticated nonresponse adjustments are often incorporated into the data to try to reduce nonresponse bias that results from systematic differences between respondents and nonrespondents. The sample data are also often reweighted, using post stratification, to agree with known population distributions of characteristics such as age, sex, and race. Finally, many surveys contain panel (longitudinal) components in which the same sample units are interviewed repeatedly over time, allowing researchers to follow individual changes over time.
The analysis of large-scale social survey data also presents several difficulties. One of the greatest technical challenges arises because sampling in these surveys is usually carried out according to complex multistage designs that combine stratification, cluster sampling, and unequal probability sampling. Many surveys that are repeated on a regular basis also rotate respondents in and out of the sample. Often point estimates of simple estimands such as population means and proportions can be calculated using a minimal amount of information about the sampling design, but standard error calculations must incorporate the key sampling design elements explicitly. Survey weights, provided along with the survey data, contain important sampling design information. Correct interpretation and use of these weights is key to the analysis of large-scale social survey data, and particularly key to standard error estimation. Analysts must also be aware of the impact of nonresponse adjustments—such as weighting class adjustments for unit nonresponse and imputation for item nonresponse—on standard error estimates. Complex multistage sampling must also be taken into consideration when calculating confidence intervals for population parameters. In particular, the degrees of freedom used when calculating confidence intervals using a t-distribution depends on the sampling design, not solely on the sample size. Methods of incorporating survey weights into estimates of simple population parameters such as means, totals, and proportions are well established; however the appropriate approach is less obvious when fitting more complex statistical models such as linear regression models and loglinear models. We address each of these issues in the following sections.
1. Complex Sample Designs
Although simple random samples are the easiest to design and analyze, large-scale social surveys often take advantage of complex multistage sampling designs to increase the precision of the resulting estimates. These designs typically involve multiple stages of sampling. For example, the first stage of sampling may select a sample of counties; the second stage may select a sample of subregions within each sampled county; the third stage may select a certain number of sample units (e.g., individuals, households, or hospitals) within each sampled subregion. Units selected at the first stage of sampling are called primary sampling units (PSUs). Units selected at the final stage are called ultimate sampling units. One reason for multistage sampling is to minimize the travel costs of interviewers in face-to-face surveys. Another reason is that a sampling frame (a list of all the ultimate sampling units in the population) may not exist for the target population, but may be constructed sequentially as needed. For example, a list of all school-age children in a state may not be readily available, but a list of all school districts in a state may be available; then for a sample of school districts, a list of all the schools in those districts may be obtained; then for a sample of schools, a list of children may be obtained.
Multistage designs often involve cluster sampling in which groups of sampling units are selected, rather than individual units. Examples of cluster sampling include selecting several students in a class, several households in a city block, or several patients in a hospital. Cluster sampling tends to increase the variability of survey estimates compared with a simple random sample of the same size. This occurs because units in the same cluster tend to be correlated and, as a result, each additional unit sampled within the same cluster provides less additional information about the overall population parameters than an element selected at random from the population. However, due to travel costs, frame construction costs, and other overhead costs associated with each sampled cluster, a simple random sample may be much more expensive than a cluster sample of the same size. Therefore, given a fixed budget, a cluster sample may provide the most efficient estimates.
Another common design element used in large-scale multistage surveys is stratification, which involves dividing the population into nonoverlapping segments, called strata, and sampling independently within each stratum. Typical stratifying factors include region of the country and urbanicity (urban, suburban, rural). If the variable of interest tends to take on different values, on average, in each stratum, then stratified sampling can lead to more efficient estimates. In particular, the sample can be optimally allocated so that a larger sample is obtained in strata where there is larger variability in the variable of interest. Another reason for stratification is to ensure adequate representation of all segments of the population, avoiding the possibility of a simple random sample that, by chance, omits part of the population. Often certain strata, such as those containing a large proportion of racial minorities or elderly people, are sampled at a disproportionately greater rate (oversampled) in order to ensure an adequate sample size for research hypotheses that involve these groups. For example the British Crime Survey oversamples inner city areas by a factor of two (Mirrlees-Black et al. 1998). Sometimes a census is conducted in some strata, called self-representing or take-all strata. This type of stratification is particularly useful for very skewed populations that contain a few large units and many small units (e.g., Hidiroglou 1986). Stratification can also be combined with cluster sampling. For example, neighborhoods may be stratified by geographic region and then a sample of households within neighborhoods may be selected; or schools may be stratified by size and then a sample of classes may be selected from each school.
Unequal probability sampling is often used when sampling clusters. In particular, clusters are usually selected with probabilities proportional to their size (PPS sampling), with larger clusters having greater probabilities of selection. The size measure used will depend on the survey, but, as examples, a school can be measured in terms of the number of students enrolled, a company can be measured in terms of the numbers of employees, a farm can be measured in terms of acreage, and a city block can be measured in terms of the number of households. PPS sampling will lead to more efficient estimates whenever cluster totals are proportional to the size of the cluster, which is often the case. For example, larger schools tend to have more students with learning disabilities, larger companies tend to have larger revenue, larger farms tend to have a larger crop yield, larger city blocks tend to have more single parents. Unequal probability sampling is also sometimes used for convenience. For example, random-digit-dial telephone surveys actually select households with probabilities proportional to the number of voice telephone lines in the household. Selecting a simple random sample of households would require a list of the individual households, rather than a list of telephone-numbers, and this may be much more difficult to obtain or construct than a list of telephone numbers,
Finally, many large surveys that are repeated on an ongoing basis (e.g., monthly) use rotation groups. Rather than select new nonoverlapping samples each month, rotation groups remain in the sample for several months in a row (Fienberg and Tanur 1983, Iachan and Jones 1987). Every month a new rotation group enters the survey and an old one drops out so that each month only a fraction of the sample units are new. This reduces costs by not having to draw a new sample each month (there are administrative costs with drawing a new sample, locating the new sample members, explaining the survey to them, etc.) and also provides some longitudinal information. Rotation groups present no complication to cross-sectional analysis of a single wave of data but can complicate analyses that combine several months of data since the same sample units may appear multiple times in these combined datasets. Analysis should then account for correlations between repeated measurements on some sample units. In contrast, some surveys, called rolling surveys (Kish 1998) are specifically designed with nonoverlapping samples each month so that the resulting data can be analyzed for a single month or combined over several months to form larger datasets.
2. Survey Weights
The simplest analysis of survey data assumes that all elements in the population are equally likely to be included in the sample, Unfortunately, this is not generally true for two reasons. First, complex sampling designs often lead to unequal selection probabilities, as discussed in the previous section. Second, even if units are equally likely to be selected, they generally have different probabilities of response; for example, in household surveys, women are usually easier to reach and more likely to cooperate than men.
Survey weights are used for correcting for known or expected differences between sample and population: each unit i is given a weight, wi, and the population mean Y of any variable y is estimated by the weighted sample average,
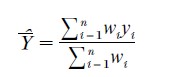
As the formula indicates, only the relative values of the weights are relevant. The weights are usually calculated by the survey producers and provided along with the survey data. An informal interpretation of these weights is that wi is proportional to the number of units in the population represented by respondent i. Estimates of population proportions are calculated using the same formula, where yi is a variable taking on values of 0 and 1.
Survey weights in large-scale surveys are often constructed so that sample estimates agree with current census estimates of key variables such as age, sex, and race, through a process called poststratification and raking (Oh and Scheuren 1983, Gelman and Carlin 2001).Voss, Gelman, and King (1995) detail the various design and weightings strategies used by various national polling organizations for pre-election surveys. Survey weights are also often adjusted to account for nonresponse, through a process called weighting class adjustment (Oh and Scheuren 1983, Kalton and Kasprzyk 1986, Bethlehem 2001).
In most complex multistage samples, sampled units have different survey weights. However, it is possible to design these samples so that all sampled units have the same weight. These designs are called self-weighting (Cochran 1977, p. 91) because the usual unweighted estimators, the same ones used for simple random samples, will produce unbiased estimates of population parameters such as means and proportions. However, the usual unweighted standard error estimation formulas are not necessarily appropriate in these designs. Therefore, although self-weighting designs may simplify point estimation calculations, they do not simplify standard error estimation calculations.
Finally, many surveys produce separate sets of weights for different types of analyses. For example, the US General Social Survey (GSS) (Davis and Smith 1992) provides separate weights for household-level estimates and for individual-level estimates. The GSS is designed to give each household an equal probability of inclusion in the sample so that the sample is self-weighting for household-level variables. However, since only one individual in each household is interviewed, people living in large households are less likely to be interviewed than people in smaller households. Therefore, even though each household has an equal chance of being selected, individuals have different chances of being selected depending on the size of their households, with these inclusion probabilities varying by the type of survey (Gelman and Little 1998). Longitudinal studies may also have separate cross-sectional and longitudinal weights. For example, the 1993 US Panel Study on Income Dynamics (PSID) provides both ‘cross-sectional analysis weights’ and ‘longitudinal analysis weights’ (Hill 1992). Cross- sectional analysis weights can be used to obtain unbiased estimates of population statistics for a given year. Longitudinal analysis weights, on the other hand, can be used to estimate models of changes over time. In particular, the 1993 PSID longitudinal analysis weights assign non-zero weights only to individuals who were respondents during each of the preceding five years. The Canadian Survey of Income and Labour Dynamics also provides both longitudinal and cross-sectional weights (Statistics Canada 1997). When using surveys with multiple sets of weights, consult survey documentation for advice on appropriate choice of survey weight.
3. Standard Errors
Although estimates of simple population parameters such as means and proportions can easily be constructed as weighted averages using survey weights, the corresponding standard error estimation procedures are not included in most standard statistical packages. When the data have been collected from a survey with a complex sample design, standard error estimates of survey statistics derived under simple random sampling assumptions generally underestimate the true standard error, resulting in confidence intervals that are too narrow and hypothesis tests that are too likely to reject the null hypothesis. In particular, most standard statistical packages can handle ‘analytic’ weights that are used in regression estimation when the data values themselves each have different (known) variances, and ‘frequency’ weights that are used to store data concisely by recording the number of times an observation is duplicated in the dataset rather than recording each observation individually, but these weights should not be confused with survey weights. Incorrectly treating survey weights as analytic weights or frequency weights will generally result in unbiased point estimates but underestimated standard errors. Moreover, ignoring the weights altogether and using a standard statistical package to perform an unweighted analysis of complex survey data will generally yield biased estimates of population parameters and underestimated standard errors. Furthermore, standard statistical packages do not account for stratification, cluster sampling, or adjustments such as post-stratification and raking. Brogan (1998) and Wang et al. (1997) illustrate some of the potential consequences of incorrectly analyzing survey data using standard statistical packages.
As a measure of the effect of the sampling design on the variance of survey estimates some surveys report design effect estimates. The design effect (deff) (Kish 1965, p. 162, Lohr 1999, p. 239) measures the increase (or decrease) in variance obtained using the given sample design relative to the variance that would have been obtained if a simple random sample of the same size had been used. For example, Davis and Smith (1992, p. 41) report that the average design effect for 60 variables in the GSS is 1.76, with slightly larger design effects on average for demographic variables which tend to have more clustering and smaller design effects, on average, for attitude variables. Similarly, Hill (1992, p. 67) reports design effects for estimates from the PSID ranging from 0.95 to 2.53, with most in the range 1.1 to 2.2. A design effect of 1.76 indicates that the variance of an estimate from the current design is 1.76 times greater than the variance that would have been obtained using a simple random sample of the same size. The design effect can be used to determine the ‘effective sample size’ by dividing the actual sample size by the design effect. The effective sample size is the number of observations that would yield the same level of precision from a simple random sample. For example, a design effect of 1.5 implies that the precision obtained by sampling 1500 units under the current complex sampling design could be obtained by sampling only 1000 in a simple random sample design. The design effect does not, however, account for differential costs of the two sampling designs.
Several software packages are available to analyze data from complex multistage surveys. Summaries and reviews of these packages are provided by Lepkowski and Bowles (1996), Cohen (1997), Carlson (1998), and Zaslavsky (2000). Stata (StataCorp 1999) and the latest release of SAS (An and Watts 1998) are multipurpose statistical packages that include procedures for analyzing complex survey data. Because variance estimation calculations for sampling designs that use without-replacement unequal probability sampling are complex, most survey software packages approximate these variances using formulae appropriate for unequal with-replacement sampling. This approximation is usually acceptable since, for these survey designs, the resulting variance estimates will slightly overestimate the true variance, resulting in slightly conservative confidence intervals and hypothesis tests. Finally, survey software packages generally use variance formulae that are technically only appropriate when the survey weights represent only the sampling design and do not incorporate nonresponse or poststratification adjustments. A few packages (WesVarPC and VPLX, see Lepkowski and Bowles 1996) use a variance estimation method call replication or resampling (Wolter 1985, Chap. 2, Korn and Graubard 1999, p. 29) that can incorporate the impact of nonresponse weighting adjustments and poststratification adjustments. To take advantage of these capabilities, data users must be provided with ‘replicate weights’ (e.g., Korn and Graubard 1999, p. 34) by the data producers. For example, the US Census Bureau releases replicate weights for the Survey of Income and Program Participation.
Finally, many large-scale surveys provide generalized variance functions (Korn and Graubard 1999, p. 218, Lohr 1999, pp. 308–10) in summary reports of the survey data. To reduce publication costs and calculation effort, these surveys do not publish standard errors for every estimate in the summary report. Instead, generalized variance functions are provided to enable data users to calculate standard errors for their estimates of interest. These functions estimate the standard error of an estimate as a function of the estimate. These standard error estimates are very approximate and their results should be interpreted with caution. Direct calculation of standard error estimates, using the raw data, survey weights, and other sampling design information is always preferable to using generalized variance functions. However, generalized variance functions permit standard error estimation when either the raw data or the sampling design information cannot be released for confidentiality reasons.
4. Confidence Intervals
When constructing confidence intervals for population parameters using survey data, it is usually assumed that survey estimates of means and proportions are approximately normally distributed, so that the usual normal confidence intervals or, for small sample sizes n, t-distribution intervals with n-1 degrees of freedom are appropriate (Cochran 1977, p. 27). For complex multistage sampling, the degrees of freedom for t-intervals is typically equal to the number of sampled primary sampling units minus a correction, c, where c=1 for unstratified cluster sampling and c equals the number of strata for stratified cluster sampling (Korn and Graubard 1999, p. 62). The normality approximation may break down for estimates of proportions that are very close to 0 or 1. In these situations, Korn and Graubard (1999, p. 65) provide approximations to exact binomial confidence intervals that can be used with data from complex multistage sampling schemes.
5. Statistical Modeling With Survey Data
Much has been written on the use of the sample design and weights when fitting statistical models such as linear regression, logistic regression, loglinear models, and survival models to survey data (Fienberg 1980, Groves 1989, Sect. 6.7, Little 1991, Pfeffermann 1993, Lohr and Liu 1994, Winship and Radbill 1994, Korn and Graubard 1995, Lemeshow et al. 1998). In general, it is recommended to include, as explanatory variables in any regression-type analysis, all variables that are used in the design or the weighting of the survey. These variables include stratum indicators, cluster indicators, and demographics (such as age, sex, ethnicity, and education) that are used to construct the weights. It is thus important in such an analysis to know how the weights were constructed, not just their numerical values. If all these variables are included, one can fit the model without survey weights (see DuMouchel and Duncan 1983, Korn and Graubard 1999, p. 177). It may then be necessary to put the weighting information back into the model—after having estimated the parameters—to estimate population quantities of interest. For example, Gelman and Little (1997) present an example in which estimates are obtained for each of the states in the US, summing over demographic categories, which requires the use of census demographic breakdowns for each state. Difficulties can arise when the number of clusters or strata is large relative to the sample size or when stratum or cluster indicators are not released in public-use data for confidentiality reasons. It can also make sense to perform both weighted and unweighted analyses (DuMouchel and Duncan 1983, Groves 1989, p. 290, Lohr 1999, p. 365; see also Sample Surveys: Modelbased Approaches). Large differences between the two analyses may indicate model misspecification.
Modeling is also used for ‘small-area estimation’ in which inferences are made about subsets of the population (e.g., small geographic regions or demographic segments) whose sample sizes are so small that simple weighted mean estimates are too variable to be useful. Hierarchical Bayes and related methods have been useful here (Fay and Herriot 1979, Dempster and Raghunathan 1987), and one area of ongoing research is combining these methods with classical weighting adjustments (Gelman and Carlin 2001).
6. Missing Data
In a sense, all sampling is about missing data, since the goal is to learn about the entire population from a subset. Usually, however, missing data in sample surveys refers to unit nonresponse, which occurs when some sampled units do not participate at all in the survey, either because they refuse or cannot be reached for interview, and item nonresponse, which occurs when a sampled unit responds to some but not all questions in the survey. Survey organizations usually adjust for unit nonresponse by weighting, as discussed earlier in this research paper.
Item nonresponse is typically handled in one of three ways (Little and Rubin 1987). In ‘complete-case’ analysis, one works only with the data from respondents who provided responses to all questions of interest. ‘Available-case’ analysis is the other extreme, where, for each question, one uses all the responses in the data. Both these approaches have the serious problem that item nonresponses do not generally occur completely at random, so it can be misleading to simply ignore them (Rubin 1976). A more flexible approach to item nonresponse is ‘imputation’: filling in values for missing responses.
Imputation can be done in a number of ways, and for large-scale surveys, it is often performed by the survey organization itself. Missing values may be imputed using single or multiple imputation. In single imputation (Kalton and Kasprzyk 1986 Little and Rubin 1987, Sect. 4.5), a single value is imputed for each missing value. In multiple imputation (Rubin 1987), m plausible values are imputed for each missing value to reflect the uncertainty about the missing data (usually m is between 5 and 10). These plausible values create m completed datasets that can each be analyzed seperately as if they had complete response. Simple combining rules (Rubin 1987, p. 76) can be used to combine results from each of these m separate analyses into one overall estimate along with its standard error. If data have been imputed using single imputation, special variance formulae (e.g., Rao 1996) are needed to account for the extra variability introduced into survey estimates due to the uncertainty in the missing values. Most large-scale surveys are currently singly imputed, but multiple imputation is becoming more popular because of the relative ease of analyzing multiply imputed datasets compared to singly imputed data. For example, the US National Health and Nutritional Examination Survey plans to release a multiply-imputed dataset (Schafer et al. 1993, 1996).
Related to imputation are various data-adjustment and correction procedures. For example, survey questions such as income that have occasional very high, unreliable responses can be ‘topcoded’—that is, truncated at threshold values. Difficulties with analyzing topcoded data can sometimes be avoided by working with medians or quantiles (e.g., upper fifth, second fifth, etc.), as these are less sensitive than averages to extreme values.
7. Summary
Large-scale social surveys are an important source of information for a wide range of topics. In analyzing such surveys, it is important to be aware of the complexity of the sampling design and the data adjustments that are used by survey organizations, including weighting to adjust for differences between sample and population and imputation to fill in missing responses. For estimating population means and proportions, the analyst should calculate weighted averages, using survey weights. In regression analysis, it is best to include, among the predictors, the variables that are used in the design and the weighting. Hierarchical models can be used to obtain inferences for small subpopulations.
In general, simple standard error estimates, which assume simple random sampling, are too small because of stratification, clustering, and weighting. These calculations can often be adjusted reasonably well by using design effects reported in the survey documentation or in previous analyses. For more involved analysis, it is advisable to use statistical packages that are specifically designed to correctly handle complex survey data.
References:
- An A B, Watts D L 1998 New SAS procedures for analysis of sample survey data. In (SUGI) SAS User Group International Proceedings. SAS Institute, Cary, NC
- Bethlehem J G 2001 Weighting adjustments for ignorable nonresponse. In: Groves R, Eltinge J, Little R J A (eds.) Survey Nonresponse. Wiley, New York
- Brogan D J 1998 Pitfalls of using standard statistical software packages for sample survey data. In: Armitage P, Cotton T (eds.) Encyclopedia of Biostatistics. Wiley, New York, Vol. 5, pp. 4167–74
- Carlson B L 1998 Software for statistical analysis of sample survey data. In: Armitage P, Colton T (eds.) Encyclopedia of Biostatistics. Wiley, New York
- Cochran W G 1977 Sampling Techniques, 3rd edn. Wiley, New York
- Cohen S B 1997 An evaluation of alternative PC-based software packages developed for the analysis of complex survey data. The American Statistican 51: 285–92
- Davis J A, Smith T W 1992 The NORC General Social Survey: A User’s Guide. Sage, Newbury Park, CA
- Dempster A P, Raghunathan T E 1987 Using a covariate for small area estimation: A common sense Bayesian approach. In: Platek R, Rao J N K, Sarndal C E, Singh M P (eds.) Small Area Statistics: An International Symposium. Wiley, New York, pp. 77–90
- DuMouchel W H, Duncan G J 1983 Using sample survey weights in multiple regression analyses of stratified samples. Journal of the American Statistical Association 78: 535–43
- Fay R E, Herriot R A 1979 Estimates of income for small places: An application of James–Stein procedures to census data. Journal of the American Statistical Association 74: 269–77
- Fienberg S E 1980 The measurement of crime victimization: Prospects for panel analysis of a panel survey. The Statistician 29: 313–50
- Fienberg S E, Tanur J M 1983 Large-scale social surveys: Perspectives, problems, and prospects. Behavioral Science 28: 135–53
- Gelman A, Carlin J B 2001 Poststratification and weighting adjustments. In: Groves R, Eltinge J, Little R J A (eds.) Survey Nonresponse. Wiley, New York
- Gelman A, Little T C 1997 Poststratification into many categories using hierarchical logistic regression. Survey Methodology 23: 127–35
- Gelman A, Little T C 1998 Improving on probability weighting for household size. Public Opinion Quarterly 62: 398–404
- Groves R M 1989 Survey Errors and Survey Costs. Wiley, New York
- Hidiroglou M A 1986 The construction of a self-representing stratum of large units in a survey design. The American Statistician 4: 27–31
- Hill M S 1992 The Panel Study of Income Dynamics: A User’s Guide. Sage, Newbury Park, CA
- Iachan R, Jones B I 1987 Classification and properties of rotation sampling designs. Journal of Official Statistics 3: 169–81
- Kalton G, Kasprzyk D 1986 The treatment of missing survey data. Survey Methodology 12: 1–16
- Kish L 1965 Survey Sampling. Wiley, New York
- Kish L 1998 Space time variations and rolling samples. Journal of Official Statistics 14: 31–46
- Korn E L, Graubard B I 1995 Examples of differing weighted and unweighted estimates from a sample survey. The American Statistician 49: 291–95
- Korn E L, Graubard B I 1999 Analysis of Health Surveys. Wiley, New York
- Lemeshow S, Letenneur L, Dartigues J-F, Lafont S, Orgogozo J-M, Commenges D 1998 Illustration of analysis taking into account complex survey considerations: The association be-tween wine consumption and dementia in the PAQUID Study. American Journal of Epidemiology 148: 298–306
- Lepkowski J, Bowles J 1996 Sampling error software for personal computers. The Survey Statistician 35: 10–17
- Little R J A 1991 Inference with survey weights. Journal of Official Statistics: 405–24
- Little R J A, Rubin D B 1987 Statistical Analysis with Missing Data. Wiley, New York
- Lohr S L 1999 Sampling: Design and Analysis. Duxbury Press, Pacific Grove, CA
- Lohr S L, Liu J 1994 A comparison of weighted and unweighted analyses in the National Crime Victimization Survey. Journal of Quantitative Criminology 10: 343–60
- Mirrlees-Black C, Budd T, Patridge S, Mayhew P 1998 The 1998 British Crime Survey, England and Wales. Home Office Statistical Bulletin 21/98. Home Office, London
- Oh H L, Scheuren F 1983 Weighting adjustment for unit nonresponse. In: Madow W G, Olkin I, Rubin D B (eds.) Incomplete Data in Sample Surveys, Volume 2, Theory and Bibliographies. Academic Press, New York
- Pfeffermann D 1993 The role of sampling weights when modeling survey data. International Statistical Review 61: 317–37
- Rao J N K 1996 On variance estimation with imputed survey data. Journal of the American Statistical Association 91: 499–506
- Rubin D B 1976 Inference and missing data. Biometrika 63: 581–92
- Rubin D B 1987 Multiple Imputation for Nonresponse in Surveys. Wiley, New York
- Schafer J L, Ezzati-Rice T M, Johnson W, Khare M, Little R J A, Rubin D B 1996 The NHANES III multiple imputation project. In: ASA Proceedings of the Section on Survey Research Methods, American Statistical Association, Alexandria, VA, pp. 28–37
- Schafer J L, Khare M, Ezzati-Rice T M 1993 Multiple imputation of missing data in NHANES III. In: Proceedings of the Bureau of the Census Annual Research Conference. US Bureau of the Census, Suitland MD, pp. 459–510
- StataCorp 1999 Stata Statistical Software: Release 6.0. Stata Corporation, College Stations, TX
- Statistics Canada 1997 Survey of Labour and Income Dynamics Microdata User’s Guide. Catalog no. 75M0001GPE. Statistics Canada, Ottawa
- Voss D S, Gelman A, King G 1995 The polls—a review— preelection survey methodology: Details from nine polling organizations, 1988 and 1992. Public Opinion Quarterly 59: 98–32
- Wang S T, Yo M L, Lin Li Y 1997 Consequences of analyzing complex survey data using inappropriate analysis and software computing packages. Public Health 111: 259–62
- Winship C, Radbill L 1994 Sampling weights and regression analysis. Sociological Methods and Research 23: 230–57
- Wolter K M 1985 Introduction to Variance Estimation. SpringerVerlag, New York
- Zaslavsky A 2000 Summary of survey analysis software. American Statistical Association Survey Research Methods Section Webpage. http://www.fas.harvard.edu/stats/survey-soft/survey-soft.html
ORDER HIGH QUALITY CUSTOM PAPER

Always on-time

Plagiarism-Free

100% Confidentiality