
Sample Reliability Measurement Research Paper. Browse other research paper examples and check the list of research paper topics for more inspiration. If you need a religion research paper written according to all the academic standards, you can always turn to our experienced writers for help. This is how your paper can get an A! Feel free to contact our research paper writing service for professional assistance. We offer high-quality assignments for reasonable rates.
Whenever an aspect of human behavior is measured, the question always arises: how good is the measurement process? In the behavioral sciences, conceptual and statistical models for answering that question are generally divided into two major categories: reliability and validity. As a first approximation, one may think of validity as concerned with whether the right construct is being measured. Reliability as concerned with the issue of how well we are measuring whatever it is that is being measured (regardless of whether or not it is the right quantity to measure). When choosing a measurement method, one must consider both of these issues; the total error of measurement comes from both the unreliability and invalidity of a measure. While this research paper primarily concentrates on reliability, it also discusses the measurement process as a whole, and the relationship between reliability and validity issues.
Academic Writing, Editing, Proofreading, And Problem Solving Services
Get 10% OFF with 24START discount code
As with many terms, the scientific and psychometric uses of the word ‘reliability’ derive from, but are different than, the everyday use of the term. In everyday life, a car would be considered reliable if it started every time. If the word were used in the technical sense, one would also say that a car was reliable if it never started; it would only be unreliable if it sometimes started, and sometimes did not. The technical term, in other words, is more concerned with consistency of behavior, regardless of where the behavior is on a scale. The main question is whether one gets the same answer every time a measurement of an individual is made. Whether that measurement is then useful is a question of validity; a measurement procedure could be perfectly reliable but useless.
Reliability theory generally begins with a conceptual framework, which is then translated more formally into a statistical model. Most reliability theory is concerned with a particular type of measurement instrument, multiple-item tests, and some theory is applied in an even more limited setting of items that are scored dichotomously as true or false. The three most commonly used models are (a) classical test theory, based on factor analysis; (b) generalizability theory, based on analysis of variance (ANOVA); and (c) item response theory, based on ‘latent trait models.’ Other statistical methods are usually needed for dealing with measurements that are either not tests, such as observations of behavior, or are not multiple-item tests. While much of measurement theory (and terminology) originally derived from consideration of ability tests, the theory applies equally well to many other areas of behavior, such as personality assessment.
1. Classical Test Theory
Classical test theory (CTT) is based on the assumption that a single underlying dimension (a trait or skill) is being measured, and that every person has a single true score, T, on that dimension. The underlying dimension or test domain may be more or less ‘pure’; for example one might think of skill in (a) doing multiplication of 3-digit numbers, (b) solving algebra word problems, or (c) solving college mathematics problems. The important consideration is that all items on the test are measuring this skill or trait, and that the skill or trait is well defined. Each person’s observed test score, X, is assumed to be determined by his or her true score T plus some error of measurement, e, which would either raise or lower the observed score relative to the person’s true score. The basic equation of classical test theory is therefore:
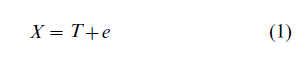
in which the quantities are as defined above, and the errors are assumed to have a mean of zero and to be uncorrelated with (unrelated to) T.
What exactly does T represent? Conceptually, the definition requires a bit of imagination, and tolerance for ambiguity: imagine a person being tested over and over again, using different sets of items selected from the collection of all items designed to measure the underlying construct. (A test may consist of any number of items, including the special case of a single item, such as an essay.) The average of all these scores (more technically, the expected value) is the person’s true score T.
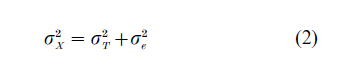
The first major consequence of this model is that the variation among observed test scores (σX2 is the sum of the variation in true scores (σT2) and the variation in the errors of measurement (σe2); that is,
The optimal case is when the error for each person is zero; then there is no variation in errors, so σe2 =0. Consideration of this equation leads to the definition of reliability as the proportion of total variance in scores that is attributable to true variation rather than error variation; that is,
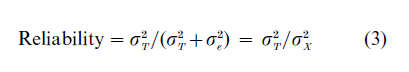
For example, if the true score variance were 8, and the error variance 2, then the total variance would be 10, and the reliability would be 8/10 = 0.8. One useful interpretation of this number is that it is the square of the correlation between true scores ( T ) and observed scores ( X ).
Among the interesting implications of the CTT model is that a test can be made more reliable by making it longer; adding items increases the true score variance at a faster rate than the error variance. One aspect of test design is determining how long a test must be to have a reliability great enough for the intended uses of the test.
Another implication of the model is that the reliability of a test is not a single number, but depends on how individuals were sampled to take the test. If a broad range of people are sampled, so that the true score variance is large, then the reliability will be greater than if people with a more limited range of true scores are sampled. ( This is because the error variance would be the same in each case.) For example, if a test were given to all high school seniors, it would have a higher reliability estimate than if it were only given to seniors who planned to attend a highly selective college or university.
1.1 Estimation Of Reliability
Unfortunately, since true score and error variation are not directly observable, the definitional equation (3) above cannot be applied directly. However, this conceptualization and the accompanying statistical model lead to several possible methods for estimating reliability. First, one could randomly divide any multiple-item test into two halves, and see how the scores on one half related to scores on the other half. If a test were perfectly reliable, then each person would get the same score on both halves of the test. Of course, the correlation is never perfect; the observed correlation allows the calculation of an estimate of the reliability of the whole test. Other methods use the correlation among the items to estimate reliability. These methods, including Cronbach’s alpha (developed from an idea of Louis Guttman), are based on the same conceptual and statistical principles as the split-half coefficient.
Because each person is measured at one time point, any variability due to changes in that person across time is ignored by these methods. Here is where the definition of true score becomes critical. One can think of ‘true’ changes in true score (due to learning or forgetting in between testing times); one can also think of more temporary changes, due to illness, noise or distractions in the testing room, and so on. In addition, some characteristics are expected to be variable over time; these include measures of mood. In personality psychology the more labile characteristics are called states, while the more stable characteristics are called traits. In classical test theory, the temporary effects are included in errors of measurement, while changes in traits are generally not. In spite of this conceptual uncertainty, this suggests another commonly used strategy for assessing reliability: Give the same test to a group of people at two different times, and see whether their scores are closely related. For obvious reasons this is called test-retest reliability. Of course, one assumes that the first measurement does not affect the second measurement, which may or may not be the case, and which must be considered. To minimize the effects of ‘true’ changes in true scores over time, the time period between testings must be kept relatively short.
A related method uses two or more forms of a test, with each form being constructed in an identical manner, so that the forms will be as nearly alike as possible. If in fact they have the same means, variances, and reliabilities, then they are said to be parallel tests. If we administer two such forms to the same group of people (e.g., on two consecutive days), the correlation between scores on the forms is called a parallel test estimate of the reliability.
In addition to measuring the overall performance of the test, we are also interested in how well we have estimated the score of each individual. The standard error of the test score is such a number; if small, then the score is a more accurate estimate of ability than if the standard error is large. As an example, suppose a person has a score of 120 on an IQ test, and the test has a standard error of 5 points. Then we can construct a 95 percent confidence inter al around the estimate by adding and subtracting two standard errors (10 points, in this case); here the interval is from 110 to 130. This means, roughly speaking that there is a 95 percent chance that the interval will contain the person’s true score.
Besides considering the reliability of the test as a whole, one must also consider how good each item is in the test. The most commonly used method to assess this in CTT is the item-total correlation, which measures how well the item discriminates among people of varying skill or ability levels. To calculate this, one correlates scores on the total test (usually with the particular item omitted) with scores on the item (with 0 used for an incorrect response and 1 for a correct response). In other words, an item is good if people who score high on the test tend to get the item right more often than do people who score at lower levels on the test. An item would be considered bad if people with low scores on the test were just as likely to get the item right as people with high scores on the test. In the test construction process, items that have low item-total correlation are generally omitted or rewritten.
Another common item statistic is the proportion of test-takers that get the item right; this is usually called the difficulty of the item (though facility would be more appropriate). While it is commonly reported, it is of little relevance for reliability; item difficulties are more important when trying to tailor a test for different ability levels, or to compare the characteristics of tests that are supposed to be equivalent (parallel, in technical terms).
1.2 Weaknesses Of Classical Test Theory
CTT has several weaknesses that have led to the development of other models for test scores. First, the concept of reliability is dependent on the group used to develop the test. If the group has a wide range of skill or abilities, then the reliability will be higher than if the group has a narrow range of skill or abilities. Thus reliability is not invariant with respect to the sample of test-takers, and is therefore not a characteristic of the test itself; in addition, neither are the common measures of item discrimination (such as the item-total correlation) or item difficulty (percent getting the item correct). As if this were not bad enough, the usual assumption that the standard error is the same for test-takers at all ability levels is usually incorrect. (In some extensions of CTT, this assumption is dropped, but these extensions are not well-known or widely used.) CTT also does not adequately account for observed test score distributions that have floor and ceiling effects, where a large proportion of test-takers score at either the low or high end of the test score range.
CTT has difficulties in handling some typical test development problems, horizontal and vertical equating. The problem of horizontal equating arises when one wishes to develop another test with the same properties as (or at least with a known relationship to) an existing test. For example, students who take college admissions tests such as the ACT or SAT should get the same score regardless of which version of the test they take. Vertical equating involves developing a series of tests that measure a wide range of ability or skill. For example, while we could develop completely independent tests of arithmetic for each elementary school grade, we might instead want to link them to have one continuous scale of mathematical skill for grades 1 through 6. While vertical and horizontal equating is not impossible within CTT, they are much more straightforward with item response theory (IRT).
These problems of CTT are partly due to some fuzziness in the theory (the population to be sampled is usually not considered in any detail in the theory). But they are also due to the failure of most data collection to be carried out on a random sample from any population, let alone a population considered appropriate for the test being investigated. In practice, convenience samples are used; these generally fit some criteria that the investigator specifies, but are otherwise taken as they are available to the researcher. Finally, CTT as originally conceptualized was never intended to address some of the practical testing problems described above.
2. Generalizability Theory
While classical test theory provided a framework that has proved useful in a number of situations, psychometricians realized many of its limitations even as they were developing the theory. Most importantly, they realized that a wide variety of factors could influence observed test scores, including how the items were generated, tests were administered, and items were scored (especially if they were free responses scored by raters). In classical test theory, these factors were all included in the (one and only) error term in the statistical model. To include these factors in their statistical models, psychometricians developed what is known as generalizability theory (GT), which included more than one source of error in test scores.
GT is based on the statistical methods of analysis of variance. Factors thought to have a major influence on test scores are included in a design, and the analysis allows the researcher to determine how much influence each factor has on variation in test scores. GT allows the computation of different estimates of reliability, depending on which factors are considered important for a particular use of the test.
As an example, consider a test of writing, in which each student writes three brief essays, each of which is scored by two raters. GT allows the estimation of how much variation in test scores is due to variation in essay topics, and how much is due to variation in raters.
Like classical test theory, GT is primarily concerned with the behavior of the test as a whole, rather than the performance of components, such as subscores or items. The classic source on GT is the book by Cronbach et al. (1972). Shavelson et al. (1989) provides a less technical overview.
3. Item Response Theory
Since 1980 there has been a steady rise in the use of item response theory, or IRT, to solve some of the problems that CTT could not adequately deal with. IRT, like CTT, is based on an assumption that a single underlying dimension is being measured. But the basic conceptual idea behind IRT is the relationship be-tween the score (usually right wrong) on an item and the underlying dimension, whereas CTT is based on the relationship between total test score and the underlying dimension. This relationship represented by an item characteristic curve, or ICC, shows how the probability of getting the item right (for dichotomous items) changes with the underlying trait. As the probability cannot be below zero or greater than one, the ICC generally has an elongated S shape. In three parameter models, the items may differ in whether the curve starts at zero for people of very low ability (no guessing) or above zero (if guessing correct is likely); how fast the curve rises (discrimination); and whether the curve is to the left (easy), in the middle, or to the right (hard). In two-parameter models, only discrimination and difficulty are used; guessing is fixed at zero. And for one-parameter (Rasch) models, only difficulty is used; guessing is fixed at zero and discrimination at one for all items.
IRT models solve many problems that were difficult for CTT, including the ability to construct a different test for each test-taker, so that students at all levels of ability can be assessed with items appropriate to their status. Such ‘adaptive tests,’ generally administered by computers, are becoming standard in many large-scale testing situations in some countries, including the Graduate Record Examination (GRE) and licensing examinations in many fields.
In IRT, the traditional concept of reliability has no place. Instead, the emphasis is on the more basic concept of standard error of measurement; that is, how accurately has a test-taker’s true score been estimated? For a fixed test given to a group of examinees, the test characteristic curve shows the standard error for each level of ability. Unlike the simplifying assumption of CTT, the standard error can vary with ability. For example, if a test is relatively easy, the standard error will be smaller for students of low ability levels, because the test is better matched to their ability; higher ability students will not be well-measured by an easy test.
4. Reliability In Criterion-Referenced Measurement
In some measurement situations the primary interest is in determining whether or not a person meets a predetermined standard or criterion. These judgments are sometimes made for individuals (e.g., is my student Karol reading at grade level?), and at other times for groups (e.g., what proportion of eighth-graders are reading at or above grade level?) In everyday life, drivers’ license test provides a familiar example of a criterion-referenced test. In education, the theory of criterion-referenced measurement was developed to provide suitable technical scaffolding for making such judgments.
Again using the concept of consistency as a basis for conceptualization, reliability of criterion-referenced measures is concerned with issues such as whether an individual would have received the same classification if tested by different raters, on a different form of the test, or on different days. It is clear that the consistency will depend on how close the individual’s true score is to the cut-point determining mastery. If a person is well above or below the cut-point, decisions will tend to be more consistent than for people near the cutpoint. In the extreme, if a person’s true score is exactly at the cut-point, then that person will pass half the time and fail the other half, no matter how well the test is constructed.
Because of the ‘yes no’ nature of scoring, criterion referenced test theory is somewhat different than the usual classical test theory, but only because some different statistical methods are appropriate for this type of data. Criterion-referenced measurement is also more obviously concerned with decisions made on the basis of a test; other test theory models are only implicitly concerned with such decisions. For more information about criterion-referenced measurement, see Hambleton et al. (1978), Harris et al. (1974), and Popham (1978).
5. Issues For Observational Measures
While many characteristics can be assessed through tests and questionnaires, others are better assessed through observation of behavior. Behavior can be assessed through direct observation, or it can be recorded for later coding into categories. The recording can be more or less direct, ranging from video and audio devices to the memory of observers about past behavior (where the recording is in the mind of the observer).
Behavioral observations tend to take place in ‘real world’ settings, and generally (but not always) under uncontrolled conditions. Unlike tests, where those taking them know and expect that their behavior will be observed, in natural settings one can imagine a range of possibilities for reactivity to the act of being observed. The more unobtrusive the observation, the more confidence one has in the quality of the measurement (though this generally would be classified as affecting validity, rather than reliability). The classic reference on unobtrusive measurement is Webb et al. (1966).
Some issues tend to arise much more frequently in the case of observational measures than with tests and questionnaires. One such issue is the decision of whether to consider a characteristic being assessed as categorical or continuous. For example, one might want to say that a person is either depressed or not, rather than being given a rating on a (nearly) continuous scale from not at all depressed all the way through to extremely depressed. In such a case, the underlying trait is categorical, and different statistical methods are required. The most commonly applied method in this case is latent class analysis, which has been used in settings as diverse as determining stage of development of children, psychiatric diagnosis, and medical diagnosis.
One also tends to see different types of observed measures with observational data. Sometimes a variable has unordered categories, as would be the case if one classified a student in a class as sitting quietly, sitting but making noise, or being out of his or her seat. Other times a variable may be a count or a rate, such as the number of times a student is out of his or her seat, or the number of such times divided by the amount of time during which he or she was observed. Typically there are multiple observers of behavior, or multiple coders of recorded behavior, or both. (This can, of course, occur for certain types of tests, not just in behavioral observations. Essay tests are a common example, because multiple raters are often used. Similarly, portfolio assessments of students’ work are often based on the judgment of multiple raters.)
These considerations present additional problems that affect the reliability of observational measures. While consistency remains the primary concern, and the reliability (and validity) of behavioral observations depends on many of the same factors as for tests, additional factors for observational methods include length of the period of observation, the conditions under which observations are made (including irrelevant stimuli), and the observers, raters, and coders used.
As one might infer from the discussion of generalizability theory (GT), observational measures usually have more than one possible source of error, unlike what is assumed in classical test theory. In addition to inter-observer agreement problems, observers can make their observations at different times, in different settings, and under different conditions; all of these contribute to the error of measurement. GT allows researchers to estimate how much variability in the observations is due to each of these potential sources of error.
These differences from typical test data have additional implications for the statistical theory and data analysis methods generally used with observational data. When data come from observers, the issue of reliability is primarily a matter of whether two or more observers would come to the same conclusion (or, if a rating, the degree to which they agree), and whether the conclusion depends on when and for how long the observation occurs. For variables that fall into categories, one apparently simple method is to calculate the proportion of instances in which two raters or observers agree with each other about the category into which a particular observation should be placed. Unfortunately, the simplicity is only apparent, because for behaviors that are either rare or very common, a high percentage of agreement can occur by chance. For example, if a student is classified as out of seat on 10 percent of occasions by each observer (and in seat the other 90 percent), then the observers would agree 82 percent of the time even if they were responding independently of the actual behavior. Therefore, such measures are typically corrected for chance agreement. Additional complications arise when there are three or more observers, and when observers do not rate or observe for the same period of time.
Details on statistical methods suitable for analyzing observational data are found in Suen and Ary (1989).
6. Relationship Of Reliability To Validity
In classical test theory, one cannot have a validity of a test that is higher than the square root of the reliability. This has led some to conclude that reliability is more important than validity of a measure, because a test cannot be valid if it is not reliable. While a test cannot be valid if its reliability is zero or extremely low, it is possible for one test to have a higher validity coefficient than another, even though the first is less reliable. Suppose that two tests (or other measures) are not actually measuring the same true score, because they are measuring different traits. Then the one with a lower reliability can have a higher validity if the trait it measures is more closely related to the outcome that the tests are meant to predict. For example, a paperand-pencil test of rock-climbing skill might have greater reliability than a performance test done on a climbing wall in a gym, but the latter might still have greater validity as a predictor of performance might in an actual rock-climbing situation.
The (invalid) conclusion about the relationship of reliability and validity has often caused a strain between quantitative researchers and qualitative researchers. Qualitative researchers often use measurement procedures that have lower reliability than the procedures devised by quantitative researchers, but the qualitative researchers prefer these less-reliable measures because they are measuring what they want to measure. It is quite possible that in many cases they are right, and their less reliable measures have greater validity than certain measures that are more reliable.
7. Suggestions For Further Reading
Martin and Bateson (1986) is a short introductory work on measuring behavior. The two most popular undergraduate texts on measurement are those of Anastasi (1988) and Cronbach (1990). At a higher level are texts by Crocker and Algina (1986) and Allen and Yen (1979), and the general reference work edited by Linn (1989). McDonald (1999) is a very new text that provides a unified treatment of many issues in test theory. At a very advanced level, the classic text on both CTT and IRT is Lord and Novick (1968). A more modern text on IRT is Hambleton and Swaminathan (1984); a simpler version is Hambleton et al. (1991).
Bibliography:
- Allen M, Yen W 1979 Introduction to Measurement Theory. Brooks Cole, Monterey, CA
- Anastasi A 1988 Psychological Testing, 6th edn. Macmillan, New York
- Cronbach L J 1990 Essentials of Psychological Testing, 5th edn. Harper and Row, New York
- Crocker L M, Algina J 1986 Introduction to Classical and Modern Test Theory. Holt, Rinehart, and Winston, New York
- Cronbach L J, Gleser G C, Nanda H, Rajaratnam N 1972 The Dependability of Behavioral Measurements. Wiley, New York
- Hambleton R K, Swaminathan H 1984 Item Response Theory: Principles and Applications. Kluwer-Nijhoff, Boston, MA
- Hambleton R K, Swaminathan H, Rogers H J 1991 Fundamentals of Item Response Theory. Sage, Newbury Park, CA
- Hambleton R K, Swaminathan H, Algina J, Coulson D B 1978 Criterion-referenced testing and measurement: a review of technical issues and developments. Review of Educational Research 48: 1–47
- Harris C W, Alkin M C, Popham W J (eds.) 1974 Problems in Criterion-referenced Measurement. Center for the Study of Evaluation, UCLA, Los Angeles, CA
- Linn R L (ed.) 1989 Educational Measurement, 3rd edn. Macmillan, New York
- Lord F M, Novick M R 1968 Statistical Theories of Mental Test Scores. Addison-Wesley, Reading, MA
- Martin P, Bateson P 1986 Measuring Behaviour: An Introductory Guide. Cambridge University Press, Cambridge, UK
- McDonald R P 1999 Test Theory: a Unified Treatment. Lawrence Erlbaum, Mahwah, NJ
- Popham W J 1978 Criterion-referenced Measurement. Prentice Hall, Englewood Cliffs, NJ
- Shavelson R J, Webb N M, Rowley G L 1989 Generalizability theory. American Psychologist 44: 922–32
- Suen H K, Ary D 1989 Analyzing Quantitative Behavioral Observation Data. Lawrence Erlbaum, Mahwah NJ
- Webb E J, Campbell D T, Schwartz R D, Sechrest L 1966 Unobtrusive Measures: Nonreactive Research in the Social Sciences. Rand McNally, Chicago
ORDER HIGH QUALITY CUSTOM PAPER

Always on-time

Plagiarism-Free

100% Confidentiality