
Sample Probabilistic Approach to Demographic Analysis Research Paper. Browse other research paper examples and check the list of research paper topics for more inspiration. iResearchNet offers academic assignment help for students all over the world: writing from scratch, editing, proofreading, problem solving, from essays to dissertations, from humanities to STEM. We offer full confidentiality, safe payment, originality, and money-back guarantee. Secure your academic success with our risk-free services.
1. Random Variation In Demographic Behavior
Demography is one of the many fields of science where statistical theory can be put to good use. Typical events of interest to demographers are births, deaths, the formation and disruption of marital and nonmarital unions, and geographical migration. The quintessential determinants of demographic behavior are sex, age, and cohort or calendar period, and other typical individual-level factors are race, social and family background, ethnicity, religious orientation, labor-force participation, and educational attainment. There may also be contextual determinants, such as institutional settings, laws and regulations (including public policies), and other collective features that individuals face. Aspects of aggregate behavior in the same population may also be important. (When many people already cohabit in nonmarital unions, individuals may find it easier to form such a union themselves. When divorce is common, dissatisfied spouses may find it easier to dissolve their own marriage.) To handle this multitude of features, individual demographic behavior is described in terms of event-history models where individuals move between predefined statuses under the influence of personal or group characteristics, of their own personal history, of contextual factors, and of period influences in the population they belong to.
Academic Writing, Editing, Proofreading, And Problem Solving Services
Get 10% OFF with 24START discount code
Since any human population has finitely many members, there is an amount of random error in analytic procedures based on individual-level data. If life histories are selected in some random manner from a larger population, as in a survey sample, then some identifiable part of the error may be due to the sampling procedure, but another part is caused by the fundamental randomness of the individual process paths. Stochastic variation does not only arise from sampling variation in survey data, or from deliberate randomization of experiments. Whether the data were obtained for a sample or for the whole population segment in question is a separate issue. The size order of the random variation involved usually depends on the number of contributing individuals, not on whet-her the data comes from a sample survey or not. As was expounded by Westergaard (1880) more than a century ago and repeated many times over by people like Udry et al. (1979) and by Brillinger (1986) and his discussants, random variation is intrinsic to data on demographic behavior, just as it is for data from other social and behavioral sciences.
Demography may be special in that some of its data come from populations large enough to permit the investigator essentially to disregard randomness in the corresponding vital rates. In such cases, the challenge is to explain any irregularities in plotted curves of vital rates as local variations of substantive interest, or as caused by systematic registration errors. Significance tests and similar statistical tools may then become less important. This does not preclude random variation from being prominent in data from small populations and from smallish segments of national populations.
2. The Event-History Approach
In event-history analysis, demographic events are seen as transitions between states in a suitable state space. The factors that influence the transitions may be fixed or change over time, they may be exogenous to the individual history or endogenous to it, recorded in an available set of individual-level data, or unobserved causes of observable selectivity. Early behavior on a process may impact on later behavior on the same process, as when age at first birth is shown to influence an individual’s later childbearing behavior; this is one of the most persistent findings in family demography. Individual behavior in one arena may interact with that in another arena, as when a woman’s educational attainment and labor-force participation are seen as influencing her childbearing while conversely having children determines her chances of improving her educational level or maintaining her ties with the labor market.
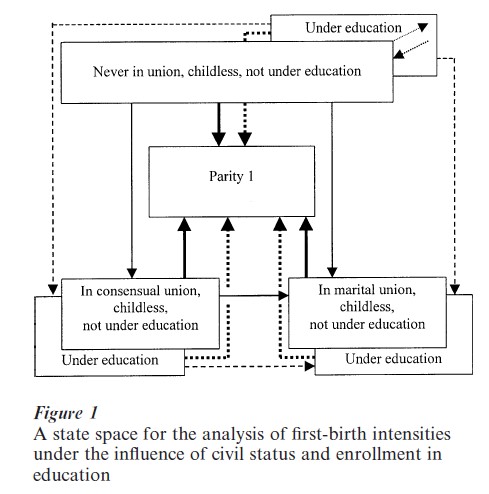
The states between which transitions are made are demographic (and other) statuses like ‘never married,’ ‘in a consensual union,’ ‘married,’ ‘childless,’ ‘of parity n’ (having had precisely n live births), ‘under education,’ ‘in the labor force,’ and so on. When the state space is not too complex, it can sometimes be represented graphically as in Fig. 1, where the boxes represent the various statuses in question and the arrows indicate possible transitions for an analysis of first births before and in first marital or nonmarital unions. There are moves in three dimensions in Fig. 1, namely (a) changes in civil status (never married, married, in consensual union), (b) school enrollment (under education or not in school), and (c) parity (in this case childless or of parity 1). Arrows are formatted to indicate transitions of prime interest, competing risks, and other transitions. As is typical for such diagrams, some states and transitions have been left out to simplify the graphic, namely (a) the moves in and out of education for individuals living in partnerships, and (b) the disruption of existing partnerships. In empirical analyses one would account for (though possibly not analyze) such transitions as well.
A focus of attention is the intensity or hazard λij(t; x(t)) of transition from some state i to some other state j at time t, for a suitable set of pairs (i, j) and a suitable vector x(t) of determinants. The basic time variable t typically is the individual’s own age or else the duration since a given event (duration of partnership, age of youngest child). Theories about individual demographic behavior are reflected in the specification of these elements, including the choice of t, the selection of covariates in the vector x(t), and the form of the intensities λij. For instance, an investigation of stepfamily fertility may address the hypo-thesis that for comparable partnerships, the rate of arrival of their first common child should be independent of the number of children that each partner had before the union was formed (the union-confirmation hypothesis). This would be reflected in a specification of a first-birth (or first-conception) intensity, say φ(t; n , n , y(t)), that at each union-duration t would depend on the parities n and n of the partners at union formation and on some set of fixed and time-varying covariates collected in the vector y(t). Confirmation of the hypothesis would consist in demonstrating that the intensity does not depend on n1 and n2.
In general the intensity λij is the probabilistic counterpart of the empirical rate of transition from i to j. In the simplest case the latter is an occurrence exposure rate λij(g) = Dij(g)/Ri(g) (also called a vital rate of the first kind) of some population group g in a given range for t during a particular period. The occurrences Dij(g) and exposures Ri(g) are recorded for the group g in question. Under such circumstances, λij(g) is the maximum-likelihood estimator for the intensity, it is asymptotically normally distributed with the intensity as its mean and an asymptotic variance that can be estimated by λij(g)/Ri(g), and different such rates are asymptotically independent of each other. This means that there exists a statistical theory for conventional demographic rates, a theory which can be used for the purpose of estimation, testing of hypotheses, the computation of confidence intervals, and so on, in the normal manner of statistical analyses.
Various ways of computing demographic occurrence exposure rates are discussed in Demographic Techniques: LEXIS Diagram. Keiding (1990) has given a probabilistic interpretation of the Lexis diagram in epidemiological research. Many other demographic practices can similarly be given a useful underpinning in statistical theory, as we show in what follows.
3. Individual-Level Demographic Models
For many events, demographers typically compute vital rates for a sequence of age groups and thereby produce a schedule {λx: x=1, 2,…} of age-specific rates (of the first kind ). The next step is often to fit some parametric mathematical function to this schedule, for instance Thiele’s (1871) mortality function
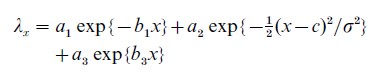
with a1+a2+a3=1. Fitting such a formula to the {λx} is an exercise in what actuaries call analytic graduation, for which a statistical theory also exists (Hoem 1972) and is useful for the selection of fitting criteria, variance computations, testing of hypotheses, and so on. When a formula has been established, it is often called a demographic model. Occasionally the model is developed for a corresponding schedule of binomial probabilities qx=1=e−λx, as in qx =φx/(1+φx) with
![]()
This three-part expression, which was developed by Heligman and Pollard (1980), is based on considerations similar to those of Thiele’s mortality formula. In an unorthodox approach, Ansley Coale (1971) fitted a model for first-marriage formation to first-marriage rates ‘of the second kind,’ i.e., to rates where the number of marriages formed at a certain age is divided by the total person-years at that age, including person-years lived after first-marriage formation, and not only divided by the person-years exposed to risk as in a rate of the first kind. The statistical theory for rates of the second kind is useful for the legitimacy it gives them in empirical analyses and for the further developments it has led to (Finnas 1980; Borgan and Ramlau-Hansen 1985).
Another class of procedures that can benefit from being brought into the realm of statistical theory is what demographers know as Brass’s relational models (Brass 1974, etc.). They can be described in elementary probabilistic terms as follows. Given a ‘standard’ probability distribution function H(x), a whole family of further distribution functions {Hab(x);-∞<a<∞, b>0 can be generated by the ‘relational transformation’ λ{Hab(x)}=a+bλ{H(x)}, where for 0<y<1 λ( y) is some function with a positive derivative everywhere. Brass chose λ( y)=ln{y/(1-y)} and λ( y)=-ln ( -ln y). He used the former for a relational transformation of H(x)= 1-λx and the latter for a corresponding transformation of H(x)=F (x)/F (50), where F (x) is a set of age-specific fertility rates cumulated up to age x. If we let Ψ(x) = λ−1( x), then Ψ(x) is another probability distribution function and λ( y) is its percentile function. Brass’s two choices of λ( y) give Ψ(x) =1/(1+e−x) and Ψ(x) = exp (-e−x), a logistic distribution and an extreme-value distribution, respectively. We can rewrite the generating relation as
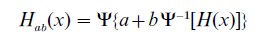
Once it has been established that we are dealing in parameters in a class of statistical models, then the usual considerations from statistical theory can be brought to bear on the issues involved. If H and Ψ are given, then a and b can be estimated in the usual way for statistical parameters, and their statistical properties may be known. If one does not want to use an outside ‘standard’ distribution for H, this function can perhaps be estimated from the data by a method whose statistical properties one knows. In either case, statistical principles are useful. One of these may be that µab(x)=hab(x)/{1-Hab(x)} is more sensitive to subgroup differences than the distribution function Hab(x) itself is. (With hab(x) =dHab(x)/dx, µab(x) is the hazard function of Hab.) Optimal fitting may not be what one strives for, but when it is, one may be well advised to use the hazard as a basis for model fitting, model testing, and so on, as usual. In this connection it may pay to heed the warning that Feller gave against fitting models to sigmoid curves as far back as in 1940 (Feller 1940).
Demographic models for schedules of age-specific rates (and other similar schedules) are valuable in the analysis of inaccurate or incomplete data and as tools for population forecasting and other kinds of ‘technical’ computations. They have a place in data-quality assessment, though such usage should be tempered by the fact that the demographic models themselves may be inaccurate representations of reality. (This is demonstrated by the perennial need to revise model life tables and by amusing report titles asking why we get such lousy fits; see Lockridge and Brostrom 1983.) Demographic models are also useful for smoothing age-specific demographic schedules, and some such efforts may be for the purpose of removing random variation. In most cases, the probabilistic approach provides useful guidelines and helpful operational procedures. In one case, it even makes certain demo- graphic procedures redundant. The whole theory of increment-decrement life tables may be replaced by parts of the theory of time-continuous Markov chains and some elements of numerical analysis (Hoem and Funck Jensen 1982).
4. Standards And Standardization
Brass’s use of a ‘standard’ probability distribution Hx follows an old tradition in demography. Finding and using a ‘standard’ schedule plays a prominent role in much demographic analysis of rate schedules λx . Such a standard is often sought outside of the current data set and is used to highlight special features of the data in hand. Once the relation to statistical theory has been established for an empirical procedure, the need for an outside standard may be removed and all parameters may be estimated from the current data, as was demonstrated by Xie and Pimentel (1992) for the celebrated Coale-Trussell formula (1996) for marital fertility. This approach can sometimes provide solutions to problems that have pestered the discipline for a long time. For instance, the competition between direct and indirect standardization has been settled in favor of the latter (Hoem 1987), in the sense that when standardization is fully legitimate there exists an improved form of indirect standardization based on a maximum likelihood estimator which has minimal variance. This result relieves the user of the onerous job of demonstrating the suitability of a selected outside standard population for use in direct standardization, which is suboptimal in any case. Here is a sketch of the basic ideas.
Suppose that for each of a number of subpopulations, indexed by k, one has a schedule {λxk: x =1, 2,…} of occurrence exposure rates, λxk =Dxk / Rxk. In direct standardization a ‘standard’ population age distribution Px is specified and a quantity like uk =Σx λxk Px /Σx λx Px is used as a measure of the risk level of subpopulation k relative to that of subpopulation 1. (Note that u1=1.) For indirect standardization, a ‘standard’ age schedule ax of risk is specified instead of Px and a quantity like wk = Dk /Σ Rxkax measures the relative risk. The dot symbol in the subscript denotes summation, so Dk =Σx Dxk. (In mortality studies, wk would be called a standardized mortality ratio.) Demographers, epidemiologists, and surely others agonize a lot over the choice of a standard population Px , and they should perhaps agonize as much over ax , though normally one simply chooses ax =Dx / Rx . Correspondingly, one could choose Px = Rx . With these latter choices, no outside standard is involved, of course.
In event-history analysis, λxk would be regarded as an estimator of an underlying model parameter λxk, in the spirit of our account toward the end of Sect. 2 above, and λxk would be a level-parameter in a piecewise-constant transition intensity. Suppose that λxk = axbk with b1 = 1, which means that schedules are essentially proportional to each other and that ax operates as a baseline schedule, since λx1 = ax. (Standardization is usually considered fully legitimate only when such a multiplicative specification holds.) Then both k and wk are estimators of the proportionality factor bk, but both are suboptimal, for one can find maximum-likelihood estimators a*x and b*k from the relations
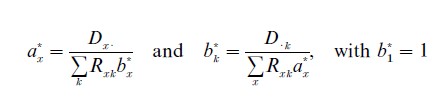
using an iterative numerical procedure to provide a solution. Breslow and Day (1975) have shown that conventional indirect standardization appears as the first step in one such procedure and thus may be regarded as a first approximation to the optimal solution. The approximation is usually excellent. Note how wk has the same form as the second of the maximum-likelihood relations.
5. Population-Le El Models
Beside the focus on individual-level behavior, a large part of demographic analysis is concerned with the dynamics of entire populations, collected in the theory of stable populations and its ramifications. The purpose is to investigate how the consequences of individual-level processes work their way up to the population level. In this connection as in others, a probabilistic approach gives a more satisfactory basis for the mathematical derivations and opens the way for results that cannot be formulated, let alone proved, in deterministic theory. Extinction theorems and stochastic ergodicity theorems in stable population theory fall in this category (Cohen 1979, 1982, Tuljapurkar 1989, and others). The probabilistic approach has inspired a new treatment of uncertainty in population forecasts (Cohen 1986). Keiding and Hoem (1976) have directly addressed long-standing concerns of demographers in a probabilistic vein.
6. Conclusions
The present Encyclopedia article has been devoted to the merits of the probabilistic approach to demo-graphic analysis. Such an approach is generally accepted in other fields of application (biostatistics, epidemiology, insurance mathematics), but in demography there is still considerable tension between those who feel that probabilistic notions are essential to the field’s methodology and others who largely regard them at best as the icing on a cake. It is our contention that it does not pay to develop demographic procedures of analysis in isolation from statistical principles any more than it pays in other disciplines. The probabilistic approach is the way to a deeper understanding of inferential techniques as well as to further methodological development beyond intuitive reasoning.
Bibliography:
- Borgan Ø, Ramlau-Hansen H 1985 Demographic incidence rates and estimation of intensities with incomplete information. Annals of Statistics 13(2): 564–82
- Brass W 1974 Perspectives in population projection (with discussion). Journal of the Royal Statistical Society, Series A 137(4): 532–83
- Breslow N E, Day N E 1975 Indirect standardization and multiplicative models for rates, with reference to the age adjustment of cancer incidence and relative frequency data. Journal of Chronic Diseases 28: 289–303
- Brillinger D R 1986 The natural variability of vital rates and associated statistics (with discussion). Biometrics 42: 693–734
- Coale A J 1971 Age patterns of marriage. Population Studies 25: 193–214
- Coale A, Trussell J 1996 The development and use of demo-graphic models. Population Studies 50(3): 469–84
- Cohen J E 1979 Ergodic theorems in demography. Bulletin of the American Mathematical Society (New Series) 1(2): 275–95
- Cohen J E 1982 Multiregional age-structured populations with changing rates: Weak and stochastic ergodic theorems. In: Land K, Rogers A (eds.) Multidimensional Mathematical Demography. Academic Press, New York, pp. 477–503
- Cohen J E 1986 Population forecasts and confidence intervals for Sweden: A comparison of model-based and empirical approaches. Demography 23(1): 105–26
- Feller W 1940 On the logistic law of growth and its empirical verifications in biology. Acta Biotheoretica 5(2): 51–66
- Finnas F 1980 A method to estimate demographic intensities via cumulative incidence rates. Theoretical Population Biology 17: 365–79
- Heligman L, Pollard J H 1980 The age pattern of mortality. Journal of the Institute of Actuaries 107(1): 49–80
- Hoem J M 1972 On the statistical theory of analytic graduation. Proceedings of the Sixth Berkeley Symposium on Mathematical Statistics and Probability 1: 569–600
- Hoem J M 1987 Statistical analysis of a multiplicative model and its application to the standardization of vital rates: A review. International Statistical Review 55(2): 119–52
- Hoem J M, Funck Jensen U 1982 Multistate life table methodology: A probabilist critique. In: Land K, Rogers A (eds.) Multidimensional Mathematical Demography. Academic Press, New York, pp. 155–264
- Keiding N 1990 Statistical inference in the Lexis diagram. Philosophical Transactions of the Royal Society of London, Series A 332: 487–509
- Keiding N, Hoem J M 1976 Stochastic stable population theory with continuous time. Scandinavian Actuarial Journal 1976: 150–75
- Lockridge K A, Brostrom G 1983 Coale and Trussell’s ‘m’ visits Sweden, or, why do we get such lousy fits? In: Lockridge K A The Fertility Transition in Sweden: A Preliminary Look at Smaller Geographic Units, 1855–1890. Umea University, Demographic Data Base, Report No. 3, Appendix I
- Thiele T N 1871 On a mathematical formula to express the rate of mortality throughout the whole of life, tested by a series of observations made use of by the Danish Life Insurance Company of 1871. Journal of the Institute of Actuaries and Assurance Magazine 16: 313–29
- Tuljapurkar S 1989 An uncertain life: Demography in random environments. Theoretical Population Biology 35(3): 227–94
- Udry J R, Teddlie C, Suchindran C M 1979 The random variation in rates based on total enumeration of events. Population Studies 33(2): 353–64
- Westergaard H 1880 An exposition and evaluation of recent investigations on the mortality of the various classes of society (in Danish). University of Copenhagen Prize Paper. Published 1882 as Die Lehre on der Mortalitat und Morbilitat: Anth-ropologisch-statistische Untersuchungen. Gustav
- Fischer, Jena Xie Y, Pimentel E E 1992 Age patterns of marital fertility: Revising the Coale-Trussell method. Journal of the American Statistical Association 87: 977–84
ORDER HIGH QUALITY CUSTOM PAPER

Always on-time

Plagiarism-Free

100% Confidentiality