
Sample Data Adjustment And Correction Research Paper. Browse other research paper examples and check the list of research paper topics for more inspiration. iResearchNet offers academic assignment help for students all over the world: writing from scratch, editing, proofreading, problem solving, from essays to dissertations, from humanities to STEM. We offer full confidentiality, safe payment, originality, and money-back guarantee. Secure your academic success with our risk-free services.
Demographic data suffer to varying degrees from errors of coverage and of classification. Such errors are more common or more serious in populations with lower levels of education and economic development. Errors in the classification of an individual’s age and parity (number of live-born children) are the most common and most problematic for demographic measurement and estimation. Methods of data evaluation and correction rely on mathematical formulae or on the relationship between demographic processes (birth, death, and migration) and the age distribution.
Academic Writing, Editing, Proofreading, And Problem Solving Services
Get 10% OFF with 24START discount code
1. Errors Of Coverage
In censuses, errors of coverage comprise the under-enumeration or occasionally over enumeration of the population. Such errors usually vary by age and sex and possibly by other variables. For example, young children are often omitted from enumeration in some countries, as are young unmarried adults temporarily absent for work. Less frequently, migrants may be enumerated twice, at both source and destination. The completeness of a census enumeration may be assessed through a postenumeration survey. Incomplete cover-age is also a common deficiency of vital registration data. Since year of registration rather than time of event is the usual basis of compilation, late reporting adds to the inaccuracies involved. Death registration, where it occurs, is usually fairly timely since registration is often a legal requirement for burial, though in some populations such requirements are often ignored, notably in rural areas.
Nonresponse to individual questions in censuses and surveys also raises issues of representativeness and should be minimized. Responses may sometimes be imputed from the respondent’s other characteristics during data editing. For most variables, nonresponses are omitted from analysis, only their extent being reported. For age, however, nonresponses are often distributed on a pro rata basis for each sex because of the need to maintain population size in demographic measurement.
2. Errors Of Classification
Errors of classification may affect all demographic variables and arise from incorrect reporting on the part of the respondent and/or enumerator. Errors may also arise during coding and editing. Errors in the reporting of age (age misreporting) include digit preference (or age heaping) and under-and over-statement.
2.1 Age
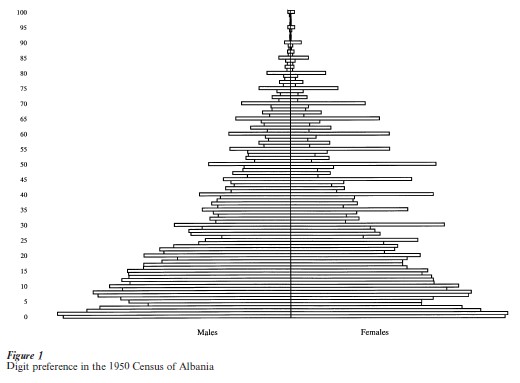
Digit preference occurs where real age is not known and its estimation involves the ‘rounding’ of age (or year of birth) to end in a preferred digit such as 0 or 5. Digit preference is best detected graphically (see Fig. 1). Various indices have been devised to measure the extent of digit preference, but they do not offer a means of correction (US Bureau of the Census 1973). Whipple’s index measures the preference or avoidance of the digits 0 and 5 over the age interval 23 to 62, though other multidecennial intervals can be used. Myers’ blended index measures preference or avoidance of all 10 digits. Since neither index is theoretically precise, Bachi derived a composite index without this deficiency. These indices assume rectangularity or linearity within quinquennial age groups. Later indices, developed by Carrier and by Ramachandran, take account of age structure and variable digit preference over the age range. In practice, the Bachi, Carrier, and Ramachandran indices were laborious and are used less frequently.
Age misstatement may occur with or without digit preference and generally involves a directional tendency often related to cultural factors. Age under-statement may occur among women of lower parity than average for their age, especially in cultures with high fertility. Age overstatement often occurs at older ages, particularly among males, in cultures where status is gained with age. Sex-specific age misstatement may also occur, for example, young female children generally are reported as younger than their male peers. The inaccurate reporting of age affects data on both population and vital events.
In many cases, it is impossible to distinguish between age misstatement, differential coverage by age, and digit preference. Further, one error may offset another. The pattern of overall error may be seen by examination of age ratios and sex ratios for 5 or 10-year age groups. These may be compared with ratios from suitable model life table populations. An indication of the overall accuracy of age reporting is given by the United Nations age-sex accuracy index (or ‘joint score’) (United Nations 1955). Irregularities arising from such factors as past changes in fertility or age-sex-specific migration should be taken into account.
Error may be assessed through comparison with expectation based on external data using demographic relationships. If accuracy permits, a previous enumeration can be ‘updated’ using data on births, deaths, and net migration to derive an expected age distribution. Comparison of the cumulated age distribution with model stable distributions identifies distortion due to misreporting (United Nations 1983). The completeness of birth and death registration may be assessed by indirect estimation techniques.
The effects in demographic measurement and estimation of both digit preference and age misstatement can be reduced by the use of wider (than standard 5-year) age intervals, but this is not always practicable and involves greater approximation. Similarly, the effects on standard quinquennial age groups can be reduced by adopting nonstandard age groups, the optimum choice of which is based on Myers’s index (US Bureau of the Census 1973), but these are generally inconvenient. For some purposes it may be appropriate to smooth or graduate the age distribution. For indirect estimation involving simultaneous estimation and detection of error, or when data on population and vital events are obtained from a single source (e.g., a vital statistics survey), unadjusted data are required.
Methods of smoothing an age distribution include the use of graphs (manual smoothing), moving aver-ages, and curve-fitting. Mathematical graduation is used to smooth narrower age groups within broader age groups. The following Carrier–Farrag and Karup– King–Newton formulae treat all age groups the same, whereas the Arriaga formula treats the first and last differently (Arriaga et al. 1994). In the following formulae, nPx represents the population aged x to x+n=1, x and n being integers. The Carrier–Farrag ratio method is based on the assumption that the relationship of a 5-year age group to its constituent 10- year age group is an average of such relationships in three consecutive 10-year age groups and is
The Karup–King–Newton formula assumes a quadratic relationship between three consecutive 10-year age groups, that is 5Px=10Px/2+(10Px−10 –10Px+10 )/16. The Arriaga formulae are based on second-degree polynomials passing through the midpoints of three consecutive 10-year age groups. Then
when the 10-year age group is the first,
![]()
when it is the last, and
![]()
In all cases, the second 5-year age group is derived by
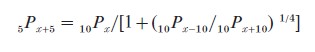
When age misreporting is more severe, the totals of all age groups need potential modification through averaging. The United Nations formula lightly smooths 5-year age groups, based on five consecutive 5-year groups, and gives the smoothed population aged x to x + 4 as
![]()
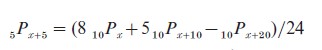
For heavier smoothing, three consecutive 10-year age groups are used to derive the central smoothed age group as
![]()
Neither formula smooths the youngest and oldest age groups. Since smoothing changes overall population size, the smoothed age groups subsequently are adjusted proportionally to achieve their overall enumerated total. The Arriaga (or other such) formulae are then applied to smoothed and adjusted 10-year totals to derive smoothed 5-year age groups.
A single-year distribution may be derived from grouped data by adopting the within-group distribution of a suitable unabridged life table population, but discontinuities at age-group junctions are inherent in this approach. A smoother distribution is obtained by mathematical interpolation, either osculatory or polynomial. Osculatory interpolation gives a smoother distribution, especially for irregular data, because of the constraint of continuity at junctions. The widely-used Sprague multipliers employ fourth-and fifth-difference osculatory interpolation to smooth single-year data within 5-year age groups without changing the totals. They are less satisfactory for the first and last two age groups and where there is marked curvature. Sprague multipliers can be employed with any continuous data including rates, for any age partition (e.g., tenths), and with unequal age intervals. A blended distribution can be derived by averaging smoothed distributions obtained by osculatory interpolation within the five possible age groupings (with terminal digits 0–4, 1–5, 2–6, 3–7, 4–8). Spline interpolation is a type of osculatory interpolation. It involves extensive iteration requiring modern computers and gives a smoother distribution (US Bureau of the Census 1973).
2.2 Parity
Errors in the reporting of parity often involve the omission or understatement of live births. Where adoption is common, overstatement may occur due to both the natural and adoptive mother reporting the birth. The reporting of stillbirths as livebirths also results in slight overstatement. Omissions may be detected and corrected by indirect estimation. Further error arises when childless women are recorded as ‘parity not stated’ due to the ambiguous use of the dash symbol (–) by interviewers. If these apparent not-stated cases are excluded, average parity is over-estimated. If all not-stated cases are included and treated as childless, average parity is underestimated. The El-Badry correction estimates the proportion of women with parity not stated who are in fact childless (El-Badry 1961). Based on the observed high correlation between true proportions childless, Z*(i), and proportions with parity not stated, NS(i) where i =1 to 8 represents the age groups 10–14 to 45–49, El-Badry assumes NS(i) =α Z*(i) +β, where α is the proportion of truly childless women who are erroneously recorded with parity not stated and β is the constant true proportion not stated. Since the reported proportions childless, Z(i), equal (1-α) Z*(i), then NS(i) =[α/(1-α)] Z(i)+β, and α/(1-α) and β can be estimated by ordinary least squares based on the first four or five age groups. Then, β is used to estimate the number of women in each age group for analytical purposes, and true proportions childless are estimated by Z*(i) =Z(i)+NS(i)-β. This correction is based on all women. If data on parity are available only for ever-married women (in which case all never-married women are generally assumed childless), the procedure can be applied on the assumption of a linear relation between the proportions of ever-married women who are childless and who have parity not stated.
3. Other Adjustments
The smoothing of mortality rates or of the survival function can be achieved through use of a device like the Brass logit life-table system, which involves fitting observed data to a suitable standard such as a model life table (Brass et al. 1968). Similarly, the smoothing of fertility rates is done through use of the Brass relational Gompertz model with an appropriate standard such as the Booth standard (Brass 1974, Booth 1984).
Other adjustments include shifting the population to refer to a specified date. This is achieved by linear or exponential interpolation of each age group between two dates for which enumerations are available; or by adjusting the total population exponentially (the growth rate is required) and assuming the same age-sex structure as at the enumeration. The structure of the open-ended age group can be derived using a suitable model stable population. When demographic events in a time reference period are reported retrospectively, errors of timing occur. For births, such errors are corrected through indirect estimation.
Bibliography:
- Arriaga E, Johnson P D, Jamison E 1994 Population Analysis with Microcomputers. Presentation of Techniques. US Bureau of the Census, Washington, DC, Vol. 1, Chap. 2.
- Booth H 1984 Transforming Gompertz’s function for fertility analysis: The development of a standard for the relational Gompertz function. Population Studies—Journal of Demography 38: 495–506
- Brass W 1974 Perspectives in population prediction: Illustrated by the statistics of England and Wales. Journal of the Royal Statistical Society A 137: 532–83
- Brass W, Coale A J, Demeny P, Heisel D F, Lorimer F, Romaniuk A, van de Walle E 1968 The Demography of Tropical Africa. Princeton University Press, Princeton, NJ
- El-Badry M A 1961 Failure of enumerators to make entries of zero: Errors in recording childless cases in population censuses. Journal of American Statistical Association 56: 909–24
- United Nations Department of Economic and Social Affairs 1955 Manual II. Methods of Appraisal of Quality of Basic Data for Population Estimates. ST SOA Series A 23. United Nations, New York
- United Nations 1967 Manual IV. Methods of Estimating Basic Demographic Measures from Incomplete Data. ST SOA -Series A 42. United Nations, New York
- United Nations 1983 Manual X. Indirect Techniques for Demo-graphic Estimation. ST ESA SER.A 81. United Nations, New York
- US Bureau of the Census 1973 Shryoc H S, Siegel J S, Larmon E A (eds.) The Methods and Materials of Demography US Bureau of the Census, Washington, DC, Chaps. 8, 22
ORDER HIGH QUALITY CUSTOM PAPER

Always on-time

Plagiarism-Free

100% Confidentiality