This sample cancer research paper features: 7800 words (approx. 26 pages), an outline, and a bibliography with 35 sources. Browse other research paper examples for more inspiration. If you need a thorough research paper written according to all the academic standards, you can always turn to our experienced writers for help. This is how your paper can get an A! Feel free to contact our writing service for professional assistance. We offer high-quality assignments for reasonable rates.
Abstract
This research paper on global burden of cancer, its trends and projections, is split into four themes. The first section provides a basic description of the main sources of routine cancer information. The second section describes the international variation in cancer using the latest available cancer incidence, mortality, and prevalence estimates. Global trends of the most commonly occurring tumors are then presented in the third section, primarily based on high-quality incidence data from established cancer registries worldwide. The final section discusses how the global profile of cancer might look around 2020, on the basis of projections of population aging and growth and some assumptions on future cancer trends.
Academic Writing, Editing, Proofreading, And Problem Solving Services
Get 10% OFF with 24START discount code
Outline
Routine Measures of Cancer Burden
Definitions, Uses, And Caveats
Producing Global Estimates of Cancer Burden
Geographical Variations in Cancer Worldwide
Global Burden of Cancer 2002
Geographical Variations in The Eight Most Common Cancers
Cancer Trends Worldwide
Temporal Variations in The Five Most Common Cancers
Cancer incidence is the frequency of occurrence of new cases of cancer in a defined population for a given period of time. It can be expressed as the absolute number of cases, although computation of rates is required for comparative purposes, with the denominator the person-time at risk from which the cases in the numerator arose. The statistic is useful in providing clues to the underlying risk factors and in planning and prioritizing resources for primary prevention, where the aim is to reduce incidence via changes in cultural and personal patterns of behavior.
Population-based cancer registries collect and classify information on all new cases of cancer in a defined population and provide statistics on occurrence for the purposes of assessing and controlling the impact of cancer in the community. Registries may cover entire national populations or selected regions. The comparability, completeness, and accuracy of incidence data are essential in making reliable inferences regarding geographical and temporal variations in incidence rates. The Cancer Incidence In Five Continents (CI5) series, first published in 1962, is now in its eighth volume (Parkin et al., 2002) and covers diagnoses of cancer 1993–97 in 186 registries in 57 countries. Inclusion is a good marker of the quality of an individual registry, given that the editorial process includes numerous assessments of data quality.
Mortality provides a measure of the impact of cancer and is expressed either as number of deaths occurring or as a mortality rate: The number of deaths per 100 000 persons per year. Mortality is a product of the incidence and the case fatality from a given cancer. Death rates estimate the average risk to the population of dying from a specific cancer, while fatality, the inverse of cancer survival (the time that elapsed between the diagnosis of cancer and death from it), represents the probability that an individual with cancer will die from it. Data derive from vital registration systems, where usually a medical practitioner certifies the fact and cause of death. The International Classification of Diseases (ICD) provides a standardized system of nomenclature and coding, and a suggested format for the death certificate.
Mortality data are affected by both the degree of detail and the quality of the information, that is, the accuracy of the recorded cause of death and the completeness of registration. These are known to vary considerably between countries and over time. Mortality data are, however, more comprehensively available than incidence: The WHO mortality databank contains national cancer mortality data on over 70 countries, and for many, over extended periods of time. This availability partly explains its common application as a surrogate for incidence in both geographic and temporal studies of cancer, although its use must be guarded where survival differences are suspected between the groups being compared.
Prevalence is a more complex measure of cancer incidence, fatality, and other influences operating in affected individuals prior to death or cure. Partial prevalence is a useful measure for quantifying the resource requirements needed for treating and supporting cancer patients, as it limits the number of patients to those diagnosed during a fixed time in the past. Prevalence for cases diagnosed within a certain number of years are of relevance to initial treatment (within 1 year), clinical follow-up (2–3 years) and possible cure (4–5 years). There are some exceptions, primarily that of female breast cancer, for which the risk of death remains higher than the general population for many more years.
Producing Global Estimates of Cancer Burden
For several decades, the International Agency for Research on Cancer (IARC) has complied and published estimates of global cancer burden. The first publication in 1984 estimated cancer incidence for 12 common cancers in 1975 in 24 world areas (Parkin et al., 1984); the most recent estimates (for 2002) were compiled as part of IARC’s GLOBOCAN series published in 2004 (Parkin et al., 2005). This database contains regional and country-specific estimates of the cancer incidence, mortality, and prevalence worldwide for 26 cancer sites (Ferlay et al., 2004).
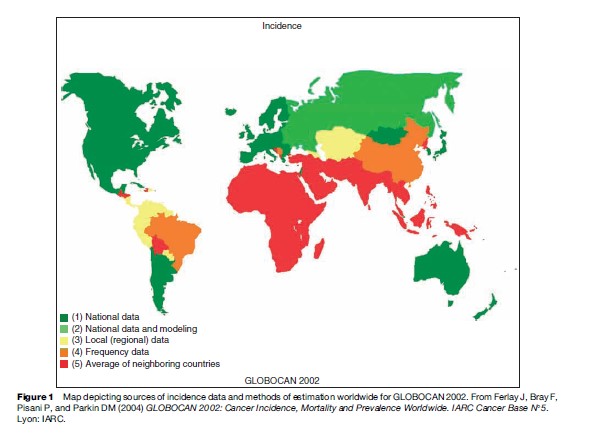
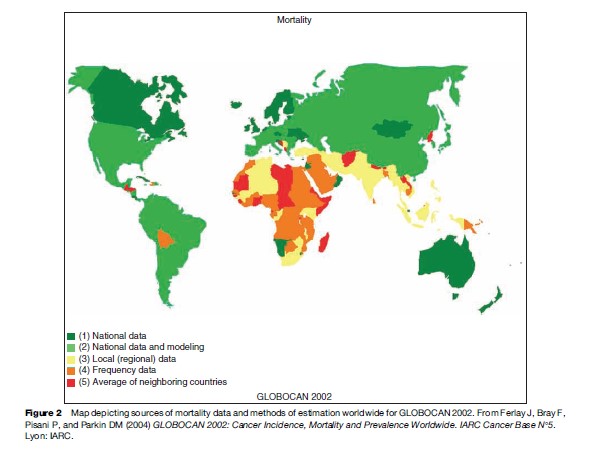
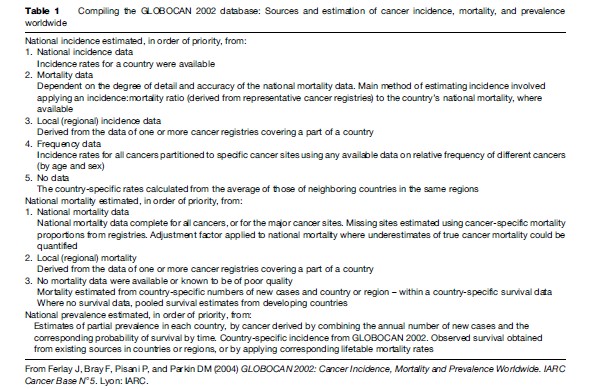
National cancer incidence and mortality data are available for a minority of countries of the world, so estimation procedures are necessary to obtain a comprehensive global picture of cancer. The available sources and methods used to derive the GLOBOCAN 2002 estimates are summarized in Table 1 and Figure 1 (incidence) and Figure 2 (mortality). The baseline data for the compilation are the cancer incidence, mortality, and survival data sets considered the best available within a given country. Incidence rates for a country are obtained wherever possible from cancer registries serving the whole population, or a representative sample of it. The most recent national mortality data from the WHO databank are used to obtain information on cancer deaths. As cancer registries record mortality as well as incidence, a country’s incidence may be estimated by applying a registry-based incidence: mortality ratio to its national mortality data. As mortality data are available for many more countries than incidence (Figures 1 and 2), there are known problems of accuracy and completeness. Adjustments are made where underrecording of mortality is suspected, and deaths recorded as uterus cancer are reallocated back to the specific sites of cervix or corpus uteri. Global prevalence is estimated from combining the estimated incidence data with appropriate estimates of survival (Pisani et al., 2002) (Table 1).
Geographical Variations in Cancer Worldwide
To provide a recent profile of global cancer burden as well as highlight some of the international variations, incidence, mortality, and prevalence estimates are presented from GLOBOCAN 2002. As well as describing the numbers of persons affected, comparisons of risk in different groups are described by the age-standardized rate using the weights from the world standard. Such an adjustment for age allows for the differing population age structures between countries and regions.
The international variability of cancer burden is briefly presented here according to 23 geographical areas for which the United Nations provides population estimates. In the following text, the terms developed and more developed refer to the regions or countries of North America, Europe (including all of the former USSR),
Australia and New Zealand, and Japan, and developing or less developed, the remainder. According to this classification and the corresponding United Nations (UN) population estimates, just over 5.1 billion people of the global population of 6.3 billion were living in less developed regions of the world in 2002, four times the number resident in developed areas (1.2 billion).
Global Burden of Cancer 2002
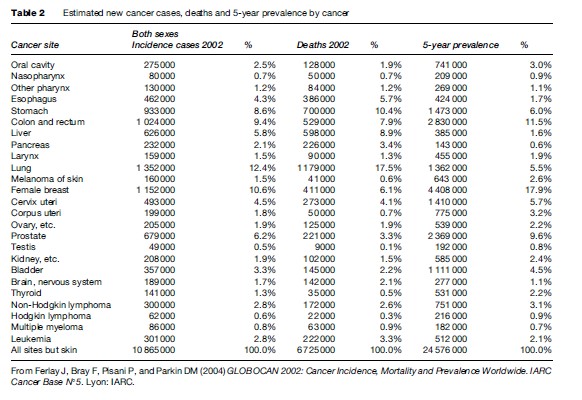
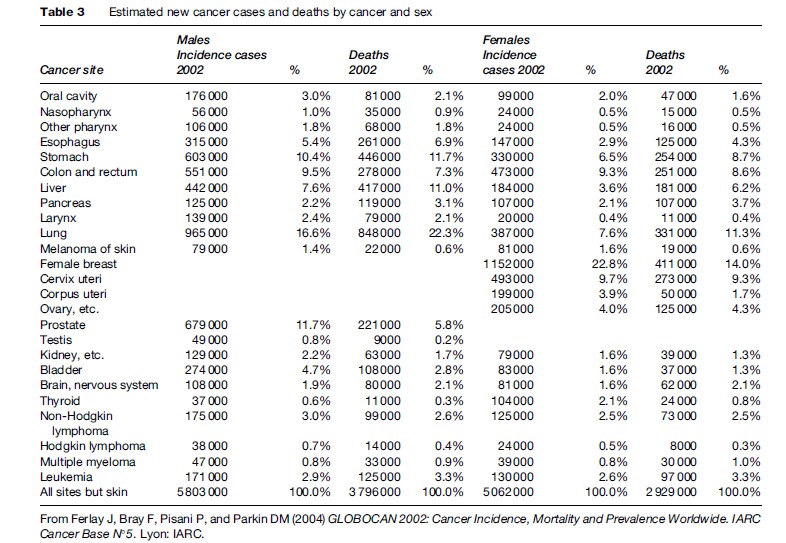
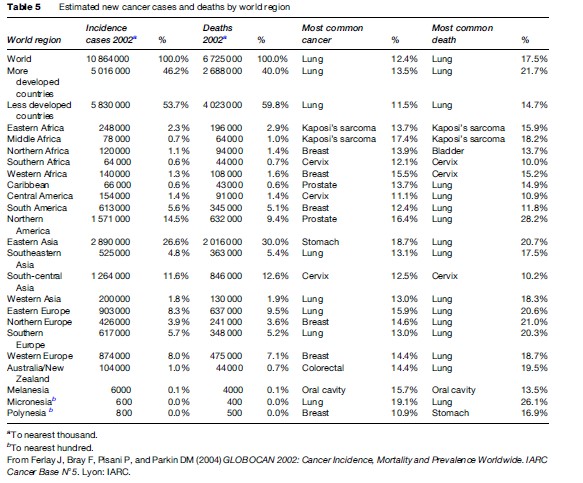
Almost 11 million people were diagnosed with cancer in 2002, over 6.5 million died from cancer, and approximately 24.5 million were living with cancer worldwide (Table 2). These total cancer estimates exclude nonmelanoma skin cancers, given difficulties in their accurate measurement and resultant lack of data. In terms of incidence, the leading four cancers, lung (12.4% of global total), female breast (10.6%), colorectum (9.4%), and stomach (8.6%) comprise over 40% of the world cancer burden. A similar percentage emerges for mortality, although lung cancer alone is responsible for one in every six of the deaths from cancer worldwide in 2002 (17.5%). Half of the global cancer mortality burden is explained by five cancers on adding liver cancer (responsible for 8.9% of all cancer deaths) to the above list. The relative magnitude of prevalence reflects both incidence and prognosis, and therefore the most prevalent cancers are female breast (17.9%) followed by colorectum (11.5%) and prostate (9.6%).
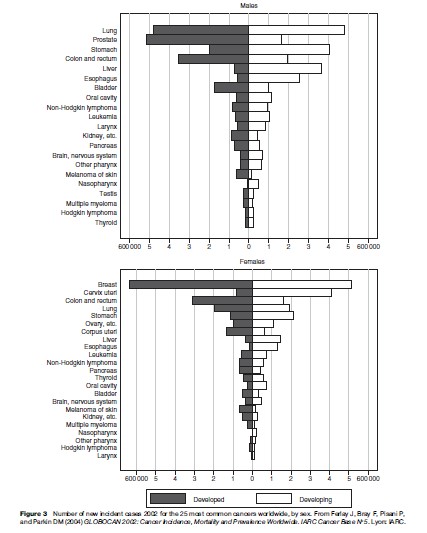
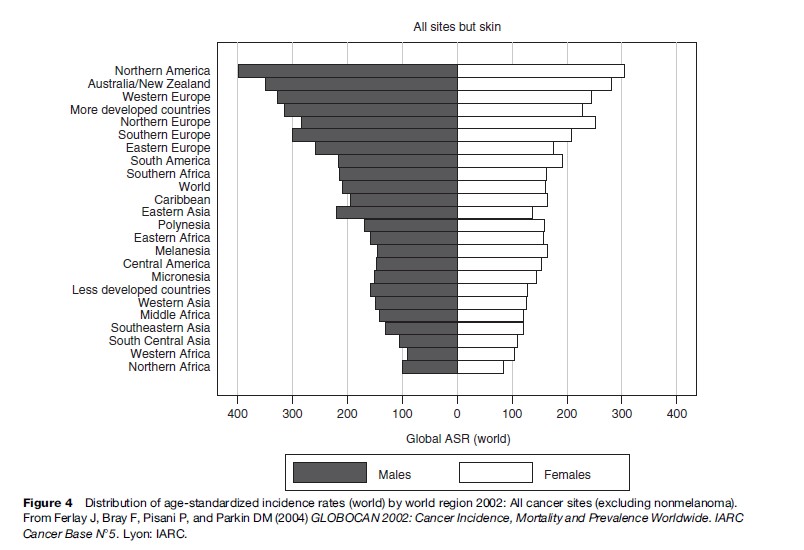
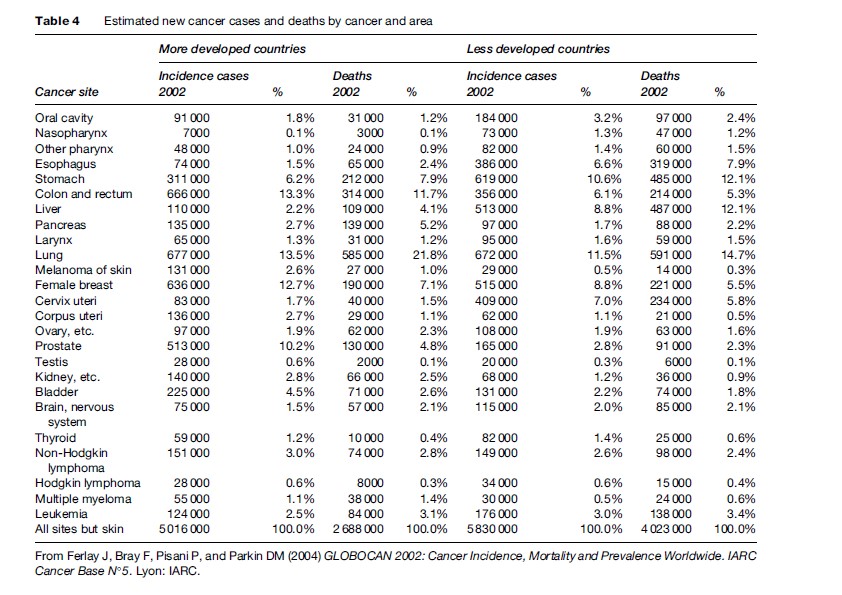
The distribution and frequency of the different cancer types varies by sex and region as well by the measure used to profile disease burden. In women, breast and cervical cancer rank first and second in frequency above colorectal, lung, and stomach cancers worldwide, while liver cancer in men ranks as the fifth most frequent cancer globally and the third most common cause of cancer death (Figure 3 and Table 3). Previous estimates for 1990 showed that the division of cancer burden between less and more developed countries was quite similar (Parkin et al., 1999). The more recent estimates indicate a disproportionate number of cancer cases occur in the developing world (53%), while in terms of mortality, closer to two-thirds of the burden now occurs in less developed regions (Table 4). The shift partly reflects increasing incidence rates of some common cancers in these areas, but the numbers of cases are also profoundly affected by the demographic phenomenon of continuing rapid population growth and aging, particularly in the developing world (see the section titled ‘Predicting cancer in 2020’). According to world area, about one-fourth of the global incidence (2.9 million new cases) and one-fifth of the global mortality (1.4 million deaths) occurs within Eastern Asia, which includes China; in contrast, an estimated 1400 new cases occurred in the Micronesia and Polynesia regions combined. On adjusting for population size and age structure, the comparison reveals a fourfold and threefold variation in age-standardized rates between regions in men and women, respectively (Figure 3). Overall rates are highest in North America, Australia/New Zealand, and Western Europe, and lowest in Northern and Western Africa (Figure 3).
The relative importance of different cancer sites also varies between and within the developing and developed regions (Table 3). Liver and cervical cancer are the fourth and fifth most common new cancers after lung, stomach, and female breast in less developed regions, while the incidence of esophageal cancer (ranking sixth) is more common than colorectal cancer. In developed areas, prostate cancer ranks above stomach cancer as the fourth most frequent cancer in 2002 (after lung, colorectal, and female breast), while cervical and esophageal cancer only rank 16th and 18th in frequency, respectively. The overall risk in different regions evidently reflects the additive contribution of different forms of cancer (Figure 4), so that in Northern Africa, for instance, rates are low for most cancer types other than bladder cancer in men and breast cancer in women. In contrast, in Southern Africa where rates are twice as high, there are elevated rates of a number of neoplasms including prostate, lung, and esophagus in men, and cervix and breast cancer in women.
Geographical Variations in The Eight Most Common Cancers
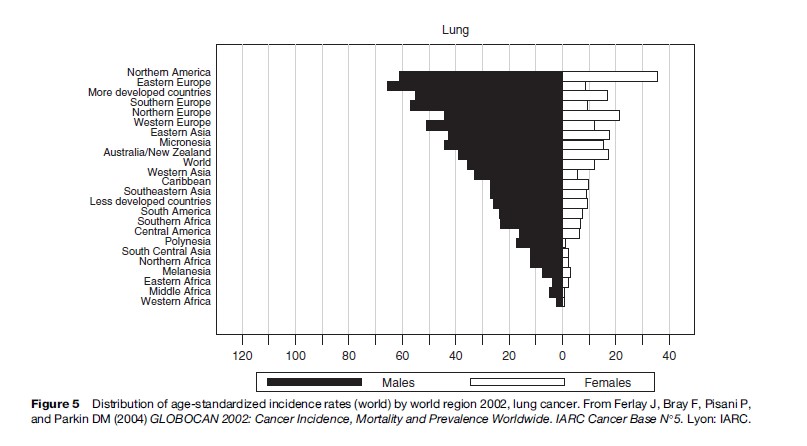
Lung cancer has ranked as the most common neoplasm globally for several decades. In 2002, over 1.3 million new cases were diagnosed, of which almost one million were in men, making it the most frequent cancer to affect men and the third most common among women (Figure 3). Lung cancer incidence and mortality rates rank first in many developed and developing regions. Age-adjusted incidence rates are highest in Northern America (in both sexes) and in Europe, particularly among Eastern European men (Figure 5). Moderately high rates of lung cancer are seen in Eastern Asia (including China and Japan) and Oceania, with rates lowest in Africa.
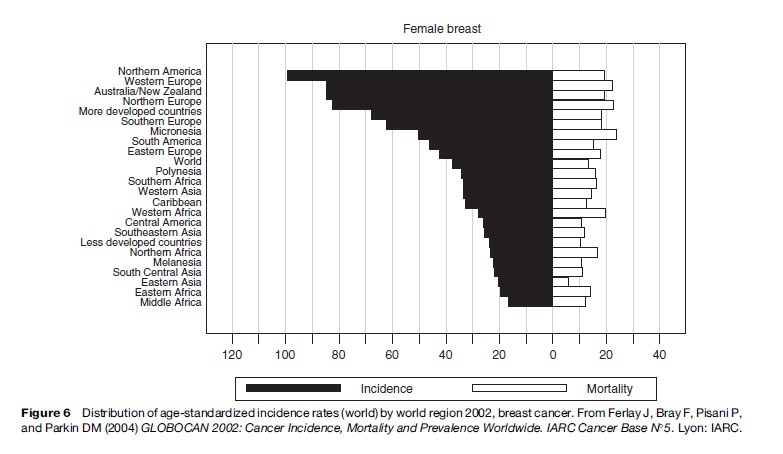
Among women, breast cancer dominates in both developing and developed regions, with over 1.1 million new cases per year worldwide (Figure 3). Thus, close to one in four of the five million women diagnosed with a cancer in 2002 were diagnosed with breast cancer (Table 3), making it the second most frequent cancer when both sexes are considered together. In terms of mortality, breast cancer ranks lower (fifth) and given the high incidence and relatively favorable prognosis, it is by far the most prevalent form of cancer, with almost 4.5 million women diagnosed and living with breast cancer within the 5-year period up to 2002 (Table 2). More than half the incident cases occur in the developed world, with the highest incidence seen in Northern America, Oceania, and Northern and Western Europe (Figure 6). The disease tends to be less common in developing countries, although incidence rates are increasing in many (see the section titled ‘Cancer trends worldwide’).
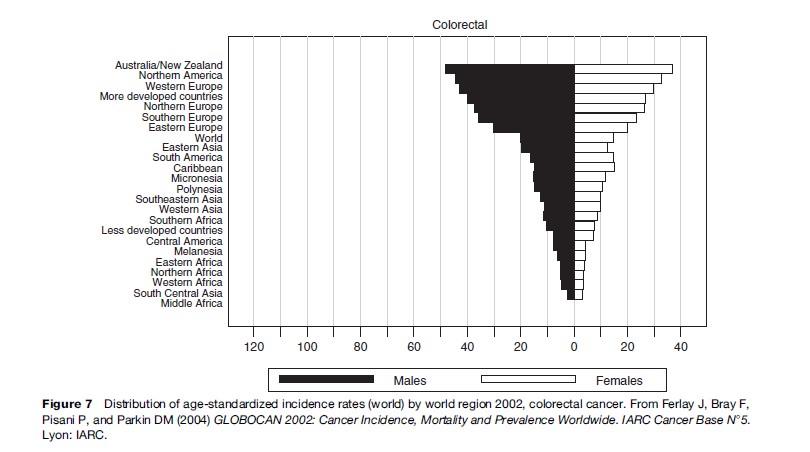
There were just over one million new cases of colorectal cancer in 2002. Similar numbers of men and women are affected, with one in ten cancer patients diagnosed with this cancer. Approximately 50% fewer colorectal deaths (5.3 million) were estimated worldwide in the same year, making it the second most prevalent cancer globally (2.8 million). In more developed countries, two-thirds of a million colorectal cancer cases were estimated for 2002, ranking it second to lung cancer in global frequency (Table 2). It is the most common cause of cancer in Australia and New Zealand, and rates tend to be high in most developed regions (Figure 7 and Table 5). In formerly low-risk Japan, markedly increasing trends in colorectal cancer incidence have been observed in recent decades, to the extent that Japanese populations now have among the highest incidence rates in the world.
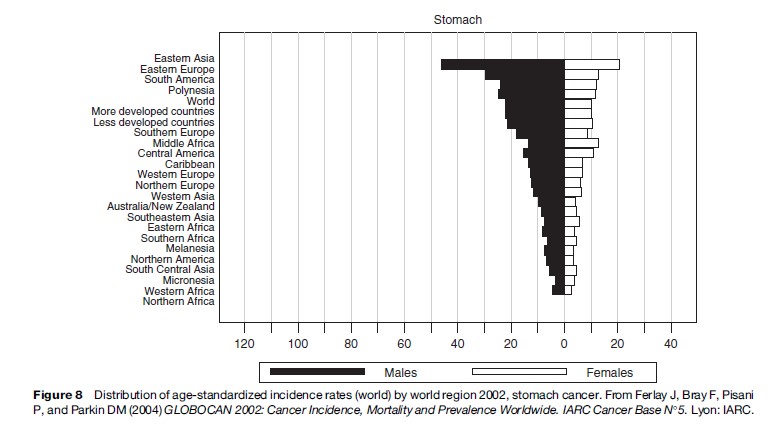
Stomach cancer has historically ranked as the second most frequent cancer worldwide, but according to the 2002 estimates, the disease ranked fourth (0.9 million new cases) behind lung, breast, and colorectum. It remains the second most common cause of mortality from cancer, however, with 0.7 million deaths occurring worldwide in the same year (Table 2). Roughly two-thirds of the new cases and deaths in 2002 occurred in men (Table 3), with a similar fraction occurring in developing countries. Rates are highest in Eastern Asia (Figure 8), notably in Japan, where one in five cancers diagnosed were stomach cancer. Rates are also elevated in Eastern Europe and in some South American countries, notably Uruguay and Argentina.
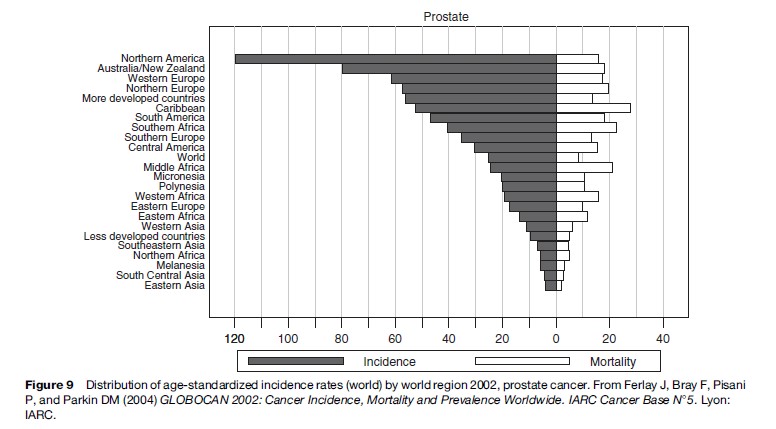
An estimated 0.7 million new cases of prostate cancer occurred worldwide in 2002 (Table 2), making this the fifth most common cancer globally and second in importance in males (Table 3). Mortality is much lower than incidence, with an estimated 0.2 million deaths in the same year (Figure 9). Three-quarters of the prostate cancer incidence worldwide occurred in the developed regions where the disease affects one in five male cancer patients. Incidence rates are notably elevated in North America, with rates considerably higher than next placed Australia/New Zealand, Northern and Western Europe. In contrast, rates in many developed countries are low: There is at least a 75fold variation in the incidence if one compares rates in the United States and China in 2002. The magnitude of such variations reflects more the high prevalence of prostate specific antigen (PSA) testing in some Western countries – as a means to detect latent cancers in asymptomatic individuals – than real differences in risk. In this respect, mortality rates may be a better guide to true geographical differences than incidence.
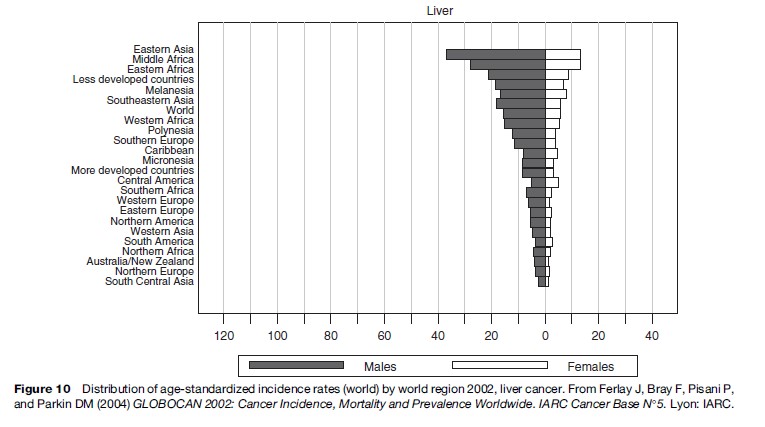
Liver cancer is the fifth most frequent cancer globally: Over 0.6 million new cases were estimated in 2002 (Table 2). Due to its poor prognosis, it is also the third most common cause of cancer death after lung and stomach cancer, with just under 0.6 million deaths in the same year. Much of the burden is observed among men and populations residing in developing regions: It is the third most common cancer of cancer incidence and the second most common cause of cancer death among males. Rates are highest in Eastern Asia, with China having half of the global liver cancer burden (Figure 10). Rates are also elevated in Central and Eastern Asia.
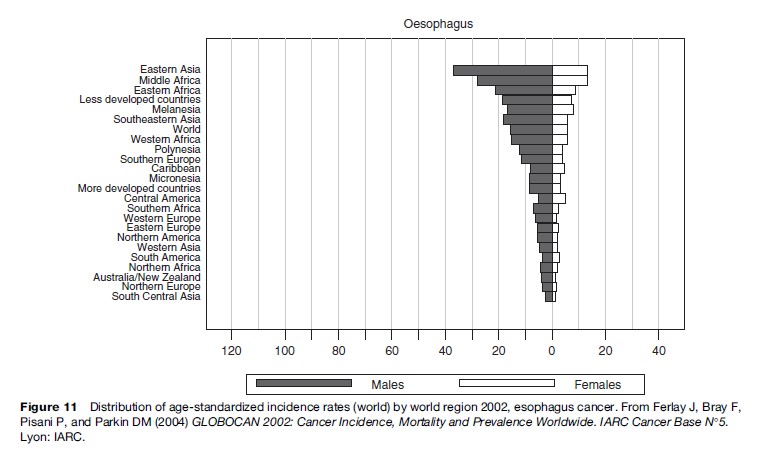
Esophageal cancer was responsible for approximately 0.45 million of the global cancer incidence and has a rather poor prognosis, almost 0.4 million deaths (Table 2). Over four-fifths of the burden is borne by the less developed world, where it is the fourth most common cause of cancer death after lung, liver, and stomach cancer. The geographic variability in the risk of esophageal cancer worldwide is striking, with the highest risk areas of the world in the so-called esophageal cancer belt, which extends from northern Iran through central Asia to north-central China. Rates are thus elevated in Eastern Asia, but are also high in sub-Saharan Africa (Figure 11).
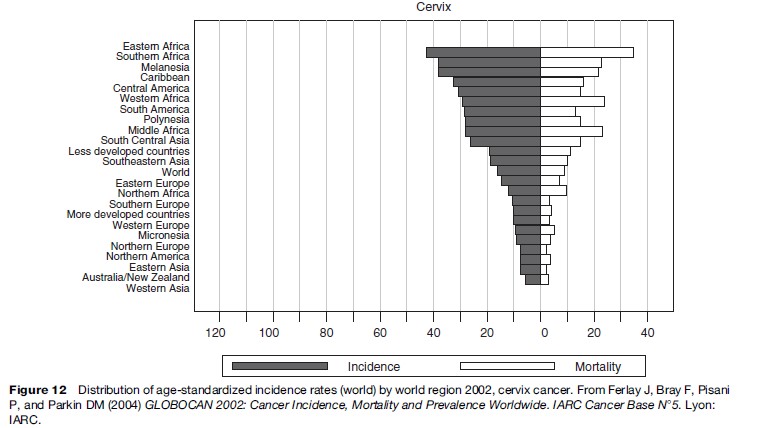
Cervix cancer is the second most common cancer among women worldwide in 2002, with almost 0.5 million new cases and about 0.25 million deaths (Table 3). Over 80% of the burden occurs in the less developed regions, where cervix cancer accounts for 15% of female cancers. The highest incidence rates are observed in Southern and Eastern Africa, Melanesia, and the Caribbean (Figure 12). Rates in most developed countries are low, and overall, cervix cancer accounts for less than 4% of the total cancer incidence burden.
Kaposi’s sarcoma is a very rare form of cancer in most world regions but is now one of the most common cancers in sub-Saharan Africa as a result of the AIDS epidemic. Approximately 57 000 new cases occurred in Africa in 2002 and, due to poor survival associated with AIDS, approximately 52 000 deaths.
Cancer Trends Worldwide
Investigations of cancer trends have important applications in epidemiological research and in planning and evaluating cancer control strategies. Analyses of how rates of different cancers are changing in different populations over time can provide clues to the underlying determinants and serve as an aid to formulating, implementing, or further developing population-based preventative strategies. Genetic factors have only a minor impact on time trends of cancer in the absence of large migrational influxes and exoduses within the population under study.
Issues concerning data quality and other detectable artifacts in interpreting time trends have been comprehensively addressed (Saxen, 1982; Muir et al., 1994). Truly valid studies would require, for instance, that the definition and content, criteria of malignancy, and likelihood of diagnosis of cancer have not changed with time, that case ascertainment has been equally efficient throughout the study period, that ICD indexing has not changed, and the accuracy and specificity of coding is consistent with time (Muir et al., 1994). Although few data series would meet each of these criteria, cancerspecific artifacts and their likely effects on time trends are reasonably well understood. The efforts of cancer registries in standardizing procedures and data definitions have been important in establishing consistently the high quality and comparability of cancer incidence data over time.
Temporal Variations in The Five Most Common Cancers
Global trends in the five most common cancers are presented as age-adjusted incidence rates by 5-year calendar period using data from 16 cancer registries representing countries within four regions complied in successive volumes of CI5. While these figures can only provide a broad overview of trends, references are made to trends in cancer mortality (where the trends diverge from incidence), in the age-specific rates by calendar period or birth cohort (where the age-adjusted trends are partially misleading), and according to subsite or histological groups (where they differ from the overall trend).
Lung Cancer
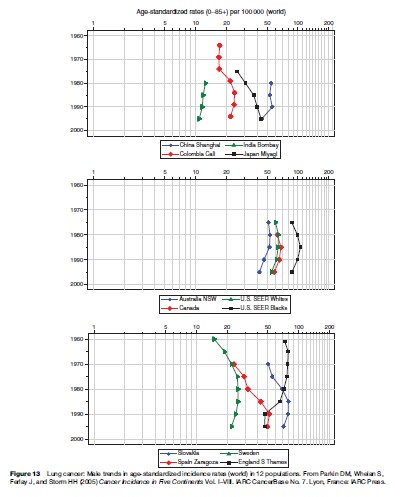
Temporal studies of lung cancer incidence and mortality have played an important role in validating smoking as the primary cause of the disease. The contrasting trends observed in different parts of the world largely reflect the changing profile of tobacco use – the number of cigarettes smoked, the duration of habit, and the composition of the tobacco – within different populations over time. Among males (Figure 13), overall rates in many developed countries – in Northern Europe, Northern America, and Australia – have tended to peak and subsequently decline, although there is a distinct variability in the magnitude of the rates and the year of peak incidence. There have been dramatic increases in rates in many Eastern European countries including Hungary, which presently has the highest rate worldwide. In contrast, there are the beginnings of a decline in some European countries, as observed in Spain and Slovakia (Figure 13). Uniform increases are observed in Japan, with rates of lung cancer doubling within 20 years. In the developing countries displayed in Figure 13, rates tend to be reasonably stable or decreasing; there is, however, a consistent and large variation in lung cancer risk: Rates in Cali are, for instance, five times those of Mumbai.
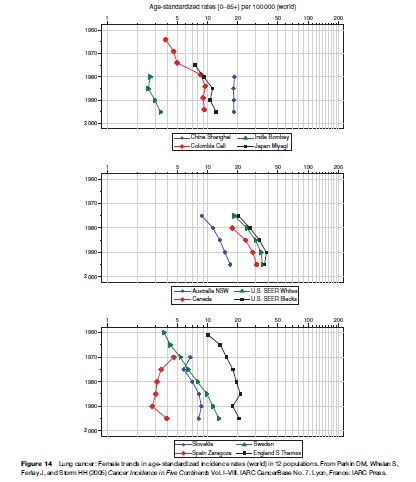
The global profile of female lung cancer trends is somewhat different. Rates tend to be steadily increasing with time in most countries, an observation that reflects the more recent acquisition of the smoking habit among women (Figure 14). In some Western populations – in the United States and United Kingdom, where the downturn in the prevalence of smoking among women has been established longest – plateaus and recent declines are emerging in the trends. In Spain, as in many (mostly developing) countries, lung cancer rates have been historically low. However, recent increases – as can be can now be detected in the Zaragoza population – illustrate the shift in smoking activity among women during the past two or three decades. A similar pattern can possibly be seen in Mumbai, India.
Recent estimates of the proportion of lung cancer cases due to smoking indicate about 85% of cases in men and 47% in women are due to smoking worldwide, although there is considerable regional variation, and these figures are more representative of countries/regions with a long history of smoking: The current fraction is much lower, for example in Africa and Southern Asia. With transnational tobacco companies using a global tactic to expand their sales, however, a smoking epidemic is emerging in many developing countries and the corresponding attributable fraction is likely to increase. The extent of the projected increases in lung cancer and other tobacco-related diseases have been quantified in China, the pattern of substantially increased burden will likely be repeated in many countries in Asia, Africa, and South America (Peto et al., 1999).
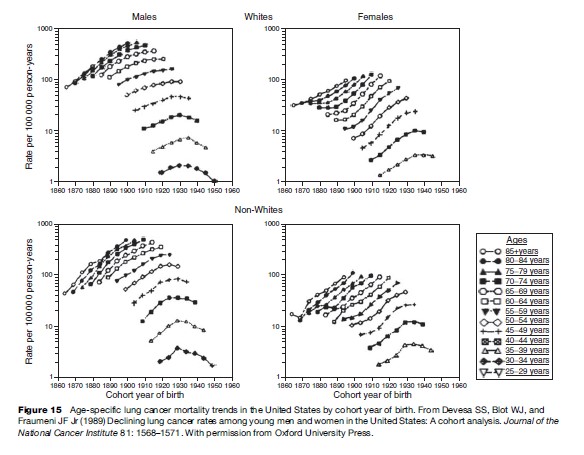
Since the 1950s, its has been established that lung cancer incidence or mortality trends by age are primarily a birth cohort phenomenon, that is, incidence rates in a given birth cohort can be related to the smoking habits of the same generation. The smoking epidemic therefore produces changes in rates first observed within younger age groups that lead to increasingly higher overall rates as these generations reach the older age groups, where lung cancer is most common. Figure 15 depicts lung cancer mortality rates plotted against birth cohort by age for U.S. men and women according to race (Devesa et al., 1989), and provides an illustrative example of the importance of these generational influences. Successive cohort-specific declines in mortality can be observed in men born in the 1930s and in women born 10–15 years later, as they begin to relinquish the smoking habit. The impact of the phenomenon in the overall age-adjusted rates can be seen in Figures 13 and 14.
There are intriguing differences in time trends by histological type of lung cancer. Squamous cell carcinoma incidence rates among men have declined in North America and in some European countries, whereas among women they have generally increased. In contrast, lung cancer adenocarcinoma rates have increased in both sexes in many world areas. Such observations are probably explained by shifts in cigarette composition, towards low-tar, low-nicotine, and filtered cigarettes (Wynder and Muscat, 1995).
Breast
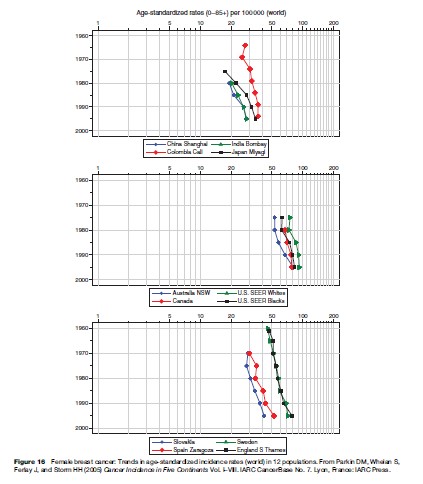
Female breast cancer incidence and mortality rates have been increasing in many populations in both developed and developing regions in the last few decades. The temporal patterns are complex, however, in view of the numerous and interactive risk factors involved, as well as the introduction of screening (affecting both incidence and mortality) and improving therapy (affecting mortality) in some Western countries. In several Nordic countries, England and Wales, and The Netherlands, incidence rates had been rising before the introduction of national screening programs in the mid to late 1980s (e.g., Sweden in Figure 16) (Botha et al., 2003). Mean annual incremental increases of 1–3% were observed in a number of European countries in the 1980s and 1990s, including those that had either not introduced programs, had implemented them recently, or had only regional or pilot programs under way (e.g., Slovakia in Figure 16).
The pattern observed in North America resembles that of Europe, with similar increases in incidence in both white and black women (Figure 16). Most of the increase in the United States occurred in the early to mid-1980s and is related to the escalation of screening during this time. The overall rate of increase slowed in the late 1980s. Early studies of Connecticut incidence trends prior to widespread mammography emerging documented the importance of birth cohort effects (Stevens et al., 1982).
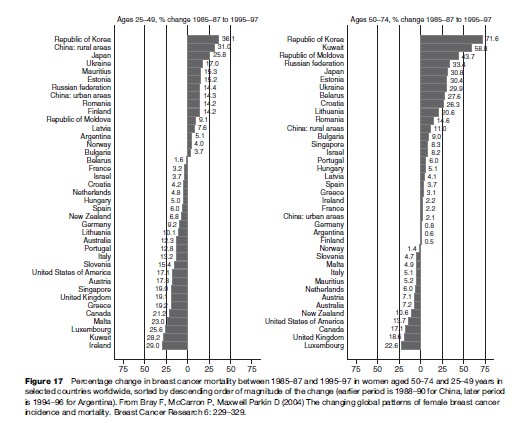
Increasing mortality rates were observed in many Western countries from the 1950s to 1980s, particularly in eastern and southern Europe. A plateau and subsequent decline in mortality in the 1980s in several northern European countries has also been noted in the United States and Canada. The decrease was seen in both younger and older women (Figure 17). Despite the international consensus that there is sufficient evidence for the efficacy of screening women aged 50–69 by mammography in reducing breast cancer mortality (International Agency for Research on Cancer, 2002), quantification of its contribution to the observed mortality declines has been problematic. While some of the overall reduction in breast cancer mortality has been attributed directly to screening via prediction models, the observed declines – a 25% reduction by 2000 – started in 1986, before screening was introduced. In addition to mammography, a number of improvements have probably contributed to the trend, and include the establishment of treatment protocols, improved chemotherapeutic options, and better therapeutic guidelines. Some recent decreases in mortality are also seen in several countries without national screening programs, although these tend to be confined mainly to younger age groups. Mortality is increasing in several eastern European countries, including the Russian Federation, Estonia, and Hungary.
Some of the largest increases in breast cancer mortality are observed in non-Western countries historically at relatively low risk (Figure 17). Breast cancer remains relatively rare in Japan for instance, although rates of both incidence and mortality have been increasing fairly rapidly (Figures 16 and 17), an observation consistent with the reported increasing risk among successive generations of women (Wakai et al., 1995). In less developed countries, increases in breast cancer incidence and mortality are evident and are often more marked in younger generations of women (Parkin, 1994). There have been reported increases in Bombay, Shanghai, Singapore, and Hong Kong in the last few decades, although in relatively highrisk South American countries such as Uruguay and Chile, the observed mortality rates are reasonably stable among younger women (Parkin, 1994). These increases are often attributed to the westernization of lifestyles, an ill-defined surrogate for changes in factors such as childbearing, dietary habits, and exposure to exogenous estrogen, toward a distribution closer in profile to that of women of the industrialized countries in the West. In Japan, for instance, decreasing age at menarche, increasing age at menopause, decreasing fertility, increasing age at first birth, and increases in both height and weight have been noted (Wakai et al., 1995).
Colorectal
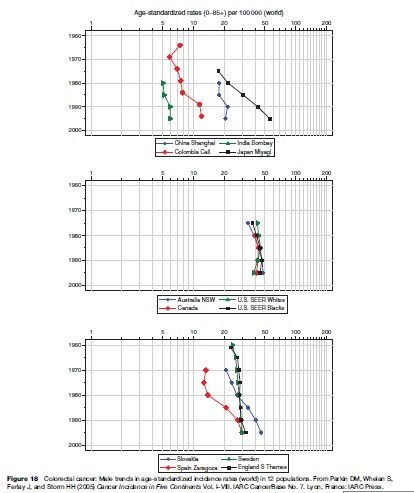
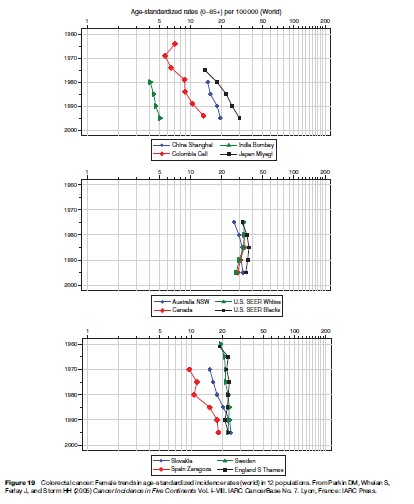
While there are some important differences in the epidemiological characteristics of colon and rectal cancer, Figures 18 and 19 depict the sex-specific trends for colon and rectum combined, thus avoiding the recognized problems of varying subsite allocation of cancers found at the rectosigmoid junction. The most notable features of global trends are the rather rapid increases in male and female rates in countries formerly at low risk. The greatest increases in incidence of colorectal cancer are in Hong Kong, Singapore, Israel, and particularly in the presently high-risk Japan, where there has been a threefold increase in incidence in men in just two decades (Figures 18 and 19). There have also been large rises in several Eastern European countries, including Slovakia, Hungary, and Poland as well as in parts of South America, including Colombia and Puerto Rico. In the high-risk countries, incidence trends are either gradually increasing (South Thames, Sweden), stabilizing (New South Wales), or declining with time (North America). Such moderation has been noted particularly in younger age groups (Coleman et al., 1993). In contrast to the recent attenuation of rates seen in some Western and Northern European countries, relatively large increases have been also observed in Spain (Figures 18 and 19).
Declines in mortality may be a consequence of changes in incidence, a result of progress in therapy or a result from the effects of improved early detection. The pattern in the United States is probably due to more widespread screening, resulting in stage-specific shifts in incidence and a subsequent increase in survival (Troisi et al., 1999).
In high-risk Western countries, there has been a notable shift in the subsite distribution within the colorectum, with increases in incidence of proximal (ascending colon) relative to distal cancer (descending and sigmoid colon) (Thorn et al., 1998; Troisi et al., 1999). In low-risk populations such as Singapore, however, the reverse effect has been reported (Huang et al., 1999), while the trend in proximal and distal rates was similar in Shanghai ( Ji et al., 1998). For rectal cancers, the countries with the most rapid increases tend to be in Eastern Europe and Japan. In the United States, there has been a decline in incidence and mortality for several decades in females of both races and in white men, although a recent increase in rectal cancer is apparent in black males (Troisi et al., 1999).
The risk factors that could explain the geographical and temporal variations in colorectal cancer are likely numerous and interactive. The observed declines in distal cancer incidence in some Western populations may be the result of increasing detection and treatment of premalignant polyps, although some improvements in the quality of the diet in younger generations may explain the observation, notably in the United States and some European populations, and the result of cohort-led declines in incidence rates among younger age groups (Coleman et al., 1993). Where rates are increasing, in Asia and in Eastern Europe, a westernization of lifestyle may in part be responsible, particularly with respect to a Western diet. The rapid increases in some populations in Asia imply the importance of genetic susceptibility.
Stomach
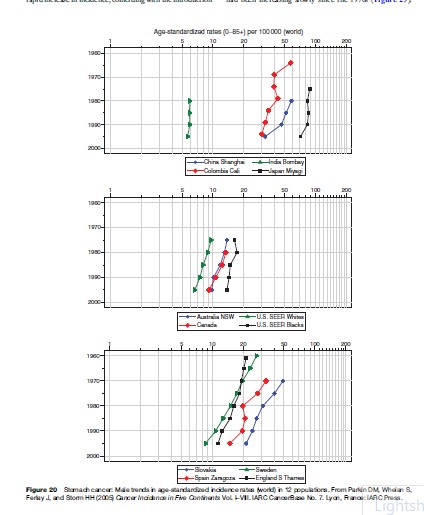
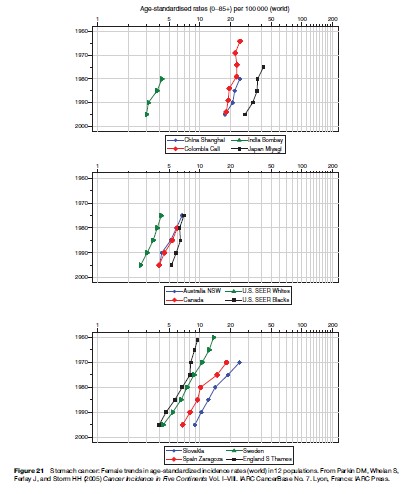
Uniform declines in rates during the last half century in most populations worldwide remain the central epidemiological feature of stomach cancer; the effect can be seen in both men (Figure 20) and women (Figure 21). While the decreases are more marked in more affluent countries, trends in those developing countries with suitable data also portray downward trends (Figures 20 and 21). The temporal profile is consistent with improved food preservation techniques and better nutrition, particularly the invention of refrigeration for the transport and storage of food, making obsolete salting, smoking, and pickling. There is also evidence that, at least in Western countries, there is a progressive decline in infection rates with Helicobacter pylori between successive birth cohorts, likely a result of continual changes within the childhood environment.
Some studies have reported that the declines in gastric cancer are restricted to intestinal-type adenocarcinoma, with rather stable incidence trends observed for the diffuse-type carcinomas. There has been particular interest in the distinct trends of cancers of the gastric cardia, where rising rates are observed in several populations (Powell et al., 2002). While explanations are not yet established, there have been concomitant increases in the prevalence of Barrett’s esophagus and adenocarcinoma of the lower third of the esophagus. It is possible, therefore, that much of the increase in cardia incidence represents misclassification of cancers at the gastroesophageal junction (Ekstrom et al., 1999).
Prostate
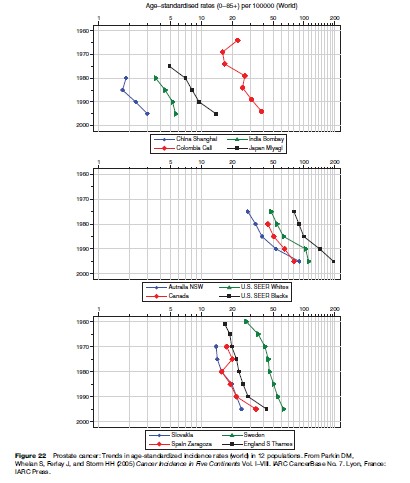
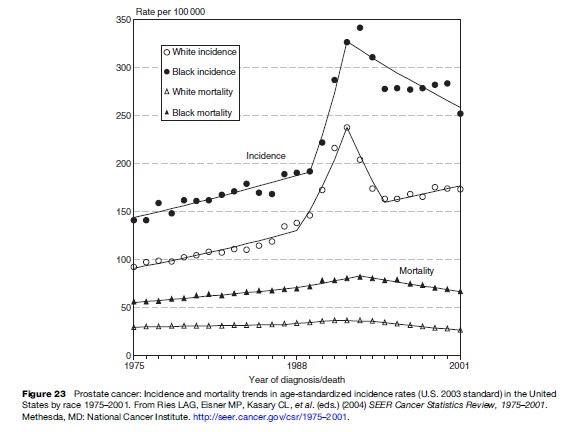
The large increases in prostate cancer incidence in highrisk countries shown in Figure 22 can be attributed mainly to increasing detection following transurethral resection of the prostate (TURP), and, more recently, due to the use of PSA. In the United States, incidence rates were increasing slowly up to the 1980s (Figure 23), probably due to a genuine increase in risk, coupled with an increasing diagnosis of latent, asymptomatic cancers in prostatectomy specimens, due to the increasing use of TURP (Potosky et al., 1990). Beginning in 1986, and accelerating after 1988, there was a rapid increase in incidence, coinciding with the introduction of testing with PSA, allowing the detection of preclinical (asymptomatic) disease (Potosky et al., 1995).
Prostate cancer mortality rates in the United States had been increasing slowly since the 1970s (Figure 23). With the introduction of PSA screening, and the dramatic surge of incidence induced by it, there was an increase in the rate of increase in mortality, but this was very much less marked than the change in incidence. More recently (since 1992 in white men, 1994 in black men), mortality rates have decreased. The contribution that PSA screening and/or improved treatment has made to the slow, steady decline continues to be the subject of much debate. The increased mortality is probably partly due to miscertification of cause of death among the large number of men who had been diagnosed with latent prostate cancer in the late 1980s and early 1990s. The later decline may be partly attributable to a reversal of this effect; it seems unlikely that screening was entirely responsible. The lead-time (between screen detection and usual clinical presentation) would have to be very short, if screening were to have such a rapid effect on mortality. Similar mortality trends have been reported in Australia, Canada, the UK, France, and the Netherlands, although, in general, they are less pronounced, or occurred later, than in the United States. In some of the countries concerned (Canada, Australia), there has been considerable screening activity, but this is not the case in others where the falls in mortality are just as marked (France, Germany, Italy, UK) (Oliver et al., 2001).
Predicting Cancer in 2020
Predictions of future cancer burden have become established tools in planning health policy and allocating future resources, as well as in measuring the success (or failure) of specific interventions. Commonly, predicted rates are obtained by extrapolating recent trends forward into the future via a simple statistical model, with the corresponding population projections applied to this to obtain the predicted number of cases. On a global scale, however, it is not easy, even for the major cancer sites, to predict burden in 2020 by such means. Historical patterns are not always a sound basis for future projections, and past trends of the common cancer forms are often different between and within world regions. Further, it is impossible to achieve in practical terms, given the insufficient availability of data for most of the world.
It is assumed, therefore, that current overall cancer incidence rates will be the same in 2020, with the predicted numbers presented by applying sex and age-specific population forecasts for the same year. Irrespective of changing risk, population growth and aging are extremely important in determining likely future burden, and demographic changes will continue to have major consequences over the next half century, particularly in the developing world. One illustrative scenario that allows for changing risk of several common cancers is also examined.
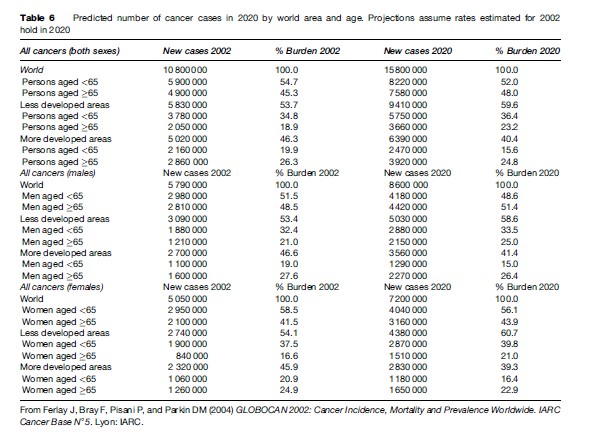
Table 6 displays the predicted number of new cases of all cancers based on the estimated incidence rates in 2002 applied to population projections in 2020. In the absence of changing risk or intervention, it is projected that by 2020, there will be about 15.8 million new cases of cancer worldwide, an approximately 45% increase from 2002. Three fifths of the total burden will reside in less developed regions as a result of a more rapid aging and population growth. The greatest relative increase in developing countries will occur among the elderly (defined here as aged 65 or over): An 80% increase is projected from the 2 million cases in 2002 to 3.7 million by 2020. Worldwide, roughly half of the predicted 5 million additional incident cases in 2020 will occur in this age group.
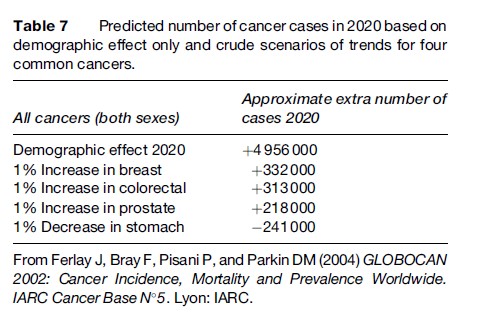
To give an indication of the impact of changing risk on future numbers, Table 7 shows the additional burden that would occur if the generally observed (increasing) breast, colorectal, and prostate cancer incidence trends and (decreasing) stomach cancer trends were to continue at a rate of growth/reduction of 1% per annum. While the increases are modest compared to the demographic component, a nearly 0.75 million additional new cases would be expected in 2020 given the combined 1% increases in breast, colorectal, and prostate cancer rates. This would be partially offset by a quarter million drop in incidence were stomach cancer rates to decline with the equivalent rate of change.
In practice, the net effect of time trends on future worldwide burden is difficult to guess. For several sites, trends are in different directions in different world regions and can change direction even on the short term, as has been observed for lung cancer in the last decade. The foreseeable demographic changes are projected to substantially increase the magnitude of global cancer incidence in the next decades. Other than making provisions for an older and disproportionately larger number of persons diagnosed with cancer within the developing regions, effective cancer control activities – including the capacity to reduce and nullify the tobacco epidemic – can limit its impact. This is particularly the case among the vast populations living in Asia, Africa, and South America, where the destructive effects of tobacco to health are beginning to be realized.
Bibliography:
Botha JL, Bray F, Sankila R, and Parkin DM (2003) Breast cancer incidence and mortality trends in 16 European countries. European Journal of Cancer 39: 1718–1729.
Bray F, McCarron P, and Maxwell Parkin D (2004) The changing global patterns of female breast cancer incidence and mortality. Breast Cancer Research 6: 229–329.
Coleman MP, Este` ve J, Damiecki P, Arslan A, and Renard H (1993) Trends in Cancer Incidence and Mortality (IARC Scientific Publications, No. 121). Lyon, France: IARC.
Devesa SS, Blot WJ, and Fraumeni JF Jr (1989) Declining lung cancer rates among young men and women in the United States: A cohort analysis. Journal of the National Cancer Institute 81: 1568–1571.
Ekstrom AM, Signorello LB, Hansson LE, Bergstrom R, Lindgren A, and Nyren O (1999) Evaluating gastric cancer misclassification: A potential explanation for the rise in cardia cancer incidence. Journal of the National Cancer Institute 91: 786–790.
Ferlay J, Bray F, Pisani P, and Parkin DM (2004) GLOBOCAN 2002: Cancer Incidence, Mortality and Prevalence Worldwide. IARC Cancer Base N 5. Lyon, France: IARC.
Huang J, Seow A, Shi CY, and Lee HP (1999) Colorectal carcinoma among ethnic Chinese in Singapore: Trends in incidence rate by anatomic subsite from 1968 to 1992. Cancer 85: 2519–2525.
International Agency for Research on Cancer (2002) Breast Cancer Screening. Lyon, France: IARC Press.
Ji BT, Devesa SS, Chow WH, Jin F, and Gao YT (1998) Colorectal cancer incidence trends by subsite in urban Shanghai, 1972–1994. Cancer Epidemiology, Biomarkers and Prevention 7: 661–666.
Muir CS, Fraumeni JFJ, and Doll R (1994) The interpretation of time trends. Cancer Surveys 19/20: 5–21.
Oliver SE, May MT, and Gunnell D (2001) International trends in prostate-cancer mortality in the‘‘PSA ERA’’ International Journal of Cancer 92: 893–898.
Parkin DM (1994) Cancer in developing countries. Cancer Surveys 19–20: 519–561.
Parkin DM, Stjernsward J, and Muir CS (1984) Estimates of the worldwide frequency of twelve major cancers. Bulletin of the World Health Organization 62: 163–182.
Parkin DM, Pisani P, and Ferlay J (1999) Estimates of the worldwide incidence of 25 major cancers in 1990. International Journal of Cancer 80: 827–841.
Parkin DM, Whelan SL, Ferlay J, Teppo L, and Thomas DB (2002) Cancer Incidence in Five Continents Vol. VIII. Lyon, France: IARC Press.
Parkin DM, Bray F, Ferlay J, and Pisani P (2005) Global Cancer Statistics, 2002. CA Cancer Journal for Clinicians 55: 74–108.
Parkin DM, Whelan S, Ferlay J, and Storm HH (2005) Cancer Incidence in Five Continents Vol. I–VIII. IARC CancerBase No. 7. Lyon, France: IARC Press.
Peto R, Chen ZM, and Boreham J (1999) Tobacco – The growing epidemic. Nature Medicine 5: 15–17.
Pisani P, Bray F, and Parkin DM (2002) Estimates of the world-wide prevalence of cancer for 25 sites in the adult population. International Journal of Cancer 97: 72–81.
Potosky AL, Kessler L, Gridley G, Brown CC, and Horm JW (1990) Rise in prostatic cancer incidence associated with increased use of transurethral resection. Journal of the National Cancer Institute 82: 1624–1628.
Potosky AL, Miller BA, Albertsen PC, and Kramer BS (1995) The role of increasing detection in the rising incidence of prostate cancer. Journal of the American Medical Association 273: 548–552.
Powell J, McConkey CC, Gillison EW, and Spychal RT (2002) Continuing rising trend in oesophageal adenocarcinoma. International Journal of Cancer 102: 422–427.
Saxen EA (1982) Trends: Facts or fallacy. In: Magnus K (ed.) Trends in Cancer Incidence: Causes and Practical Implications, pp. 5–16. Oslo, Norway: The International Union Against Cancer and The Norwegian Cancer Society, Oslo.
Stevens RG, Moolgavkar SH, and Lee JAH (1982) Temporal trends in breast cancer. American Journal of Epidemiology 115: 759–777.
Thorn M, Bergstrom R, Kressner U, Sparen P, Zack M, and Ekbom A (1998) Trends in colorectal cancer incidence in Sweden 1959–93 by gender, localization, time period, and birth cohort. Cancer Causes and Control 9: 145–152.
Troisi RJ, Freedman AN, and Devesa SS (1999) Incidence of colorectal carcinoma in the U.S.: An update of trends by gender, race, age, subsite, and stage, 1975–1994. Cancer 85: 1670–1676.
Wakai K, Suzuki S, Ohno Y, Kawamura T, Tamakoshi A, and Aoki R (1995) Epidemiology of breast cancer in Japan. International Journal of Epidemiologyl 24: 285–291.
Wynder EL and Muscat JE (1995) The changing epidemiology of smoking and lung cancer histology. Environmental Health Perspectives 103 (supplement) 8: 143–148.
Bray F and Moller B (2006) Predicting the future burden of cancer. Nature Reviews Cancer 6(1): 603–612.
Parkin DM, Bray FI, and Devesa SS (2001) Cancer burden in the year 2000. The global picture. European Journal of Cancer 37: 4–66.
Parkin DM (2006) The evolution of the population-based cancer registry. Nature Reviews Cancer 6(6): 63–74.