
Sample Discrete Mathematics Research Paper. Browse other research paper examples and check the list of research paper topics for more inspiration. iResearchNet offers academic assignment help for students all over the world: writing from scratch, editing, proofreading, problem solving, from essays to dissertations, from humanities to STEM. We offer full confidentiality, safe payment, originality, and money-back guarantee. Secure your academic success with our risk-free services.
Some of the most important problems of the social and behavioral sciences are concerned with arrangements, designs, patterns, sequences, schedules, and assignments. These are among the fundamental notions dealt with by discrete mathematics (dm). This research paper describes some of the tools of dm—digraphs, graphs, signed and marked graphs, partial orders, rankings, combinatorics—and their applications.
Academic Writing, Editing, Proofreading, And Problem Solving Services
Get 10% OFF with 24START discount code
1. What Is Discrete Mathematics?
John Kemeny made the following distinction. Many problems of science deal with quantities so large that it is natural to assume that they are dense, continuously distributed, and that all real numbers can be used to measure them. Centuries of development of ‘continuous mathematics’ have given us extremely powerful tools for handling these kinds of problems. Other problems are so small that we can deal with all the possible cases by hand. These are truly ‘finite’ problems. Some of the most important problems, however, fall in between: not big enough to assume density, continuity, etc., but not small enough to allow us to consider all cases. These are, for the most part, the problems with which discrete mathematics (DM) deals. Because increasingly powerful computers are allowing us to replace computations by hand, it is becoming increasingly feasible to deal with problems of DM. This explains, in part, why DM has become perhaps the fastest growing field of modern mathematics.
Many of the basic problems of the physical sciences, dealing with time, mass, velocity, etc., are of the first kind. So are many problems in the biological sciences. However, many problems of the social and behavioral sciences fall in the middle ground described by Kemeny. The tools of DM are especially relevant here. For an elementary introduction to DM, see Kolman et al. (1999) and Roberts (1984).
2. Digraphs
A digraph is a pair (V, A) where V is a set called the set of vertices and A is a set of ordered pairs from V called the set of arcs. Throughout, we shall assume that V is a finite set. Usually, arcs (x, x), known as loops, are not permitted or disregarded, and we shall disregard them. Typically, we represent a digraph geometrically by letting the vertices be points and including a directed line from x to y if (x, y) is in A. The arcs in a digraph are used in social and behavioral science models to represent relations among the vertices. Thus, (x, y)ϵA can mean that x is preferred to y, x is louder than y, x influences y, etc.
Suppose (V, A) is a digraph with arcs representing ‘preferred to.’ Then an ordinal utility function can be thought of as a function f that assigns a real number f (x) to each x in V so that for all x, yϵV,

Similarly, if arcs represent ‘louder than,’ then a function satisfying Eqn. (1) might measure loudness. If a function satisfying Eqn. (1) exists, then the digraph is asymmetric in the sense that if there is an arc from x to y, then there is no arc from y to x, and transitive in the sense that if there are arcs from x to y and y to z, then there is an arc from x to z. It is also negatively transitive in the sense that if there is no arc from x to y and no arc from y to z, then there is no arc from x to z. It turns out that asymmetry and negative transitivity of the digraph are together sufficient for the existence of a function satisfying Eqn. 1 (see Roberts 1976). An asymmetric, negatively transitive digraph is called a strict weak order.
Digraphs provide precise mathematical language for expressing concepts in the social and behavioral sciences. For instance, let us say that vertex y is reachable from vertex x if there is a sequence of vertices x1, x2,…, xt so that
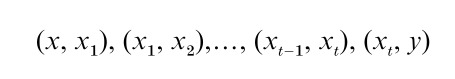
are arcs. The notion of reachability is important in sociology in the study of communication networks. If an arc in the digraph means that x can communicate directly with y (not necessarily a symmetric relationship in the sense that (x, y)ϵA→(y, x)ϵA), then reachability means that it is possible for x to initiate a message to y. There is then interest in minimum-size sets of vertices that can reach all others (so-called vertex bases). In large digraphs, it is often very important to represent them geometrically in such a way that their structural properties become clear. We might wish to find another digraph on the same vertex set with the same reachability properties and a minimum number of arcs. This idea arises in the area of data analysis called interpretive structural modeling (see Warfield 1976). The drawing of digraphs so as to visualize the information they contain in useful ways has become a major research field known as graph drawing.
Understanding the structure of communication networks is aided by considering strong components, maximal sets of vertices each two of which are reachable from each other. Many large social networks have some huge strong components. This is the case in telephone call digraphs where the vertices are telephone numbers and arcs correspond to calls between them, and in scientific collaboration digraphs where an arc means that x collaborates with y (a symmetric relationship). Similar results are being found for pages on the World Wide Web, with arcs corresponding to references from one page to another, and the results seem to suggest that totally new models are needed to explain how large social networks are formed. (For a basic introduction to such digraph concepts as reachability, vertex basis, strong component, etc., see Harary et al. 1965 and Roberts 1976. For more on social networks, see Degenne and Forse 1999.)
3. Partial Orders
If (V, A) is a digraph, its symmetric complement is the digraph (V, B) where
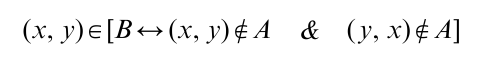
If there is an f satisfying Eqn. (1), then the digraph (V, B) is transitive. If A corresponds to preference, then B corresponds to indifference. Arguments against the transitivity of indifference were made by the economist Armstrong in the 1930s and even earlier by Karl Menger in the nineteenth century. Similarly, in psychophysics, if A corresponds to ‘louder than,’ then B corresponds to ‘equally loud’ and this might not be transitive. Arguments against transitivity of B often involve thresholds: x and y might be within threshold and so sound equally loud, y and z might be within threshold and so sound equally loud, but x and z might not be within threshold.
This kind of argument led Luce in 1956 to introduce a different model for utility of loudness judgments:
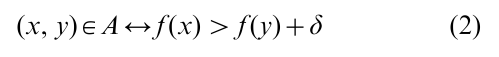
where δ is a fixed positive constant measuring threshold or just noticeable difference. Luce and also Scott (1958) and Suppes gave necessary and sufficient conditions for a digraph to have a function f satisfying Eqn. (2), conditions defining a semiorder. Semiorders are transitive digraphs. They are also very important examples of a second fundamental concept of DM, a partial order, an asymmetric, transitive digraph. (Sometimes this is called a strict partial order and the term partial order is reserved for the digraphs that are transitive, reflexive [(x, x) A for all x], and antisymmetric [(x, y)ϵA & (y, x)ϵA↔x= y].) Partial orders arise in numerous applications in the social and behavioral sciences.
If f satisfies Eqn. (2), then consider the real interval J(x) = [ f (x)-δ/2, f (x)+ δ/2]. Suppose that when J and J´ are two real intervals, J >J´ means that every point of J is to the right of every point of J´. Then Eqn. (2) can be rewritten as
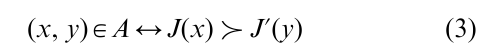
We can think of J(x) as a range of fuzziness about f (x). If these intervals have different lengths, then the digraphs defined by Eqn. (3) are called inter al orders, another important class of partial orders. The term interval order is due to Fishburn in 1970, but the concept was anticipated by Norbert Wiener in 1914. For more about semiorders, interval orders, and a variety of partial orders, see Fishburn 1985 and Trotter 1992.
4. Graphs
If a digraph (V, A) is symmetric, we call it a graph. Replacing each pair of arcs (x, y) and (y, x) by an unordered pair {x, y}, we can think of a graph as a pair (V, E ) where E is a set of unordered pairs from V. Elements of E are called edges. Geometrically, the vertices are represented as points and if {x, y}ϵ E, then we connect x and y by an undirected line. The symmetric complement of a digraph, of course, is a graph. The symmetric complement of a semiorder is called an indifference graph or a unit inter al graph. The name comes from the case where A corresponds to preference. The symmetric complement of an interval order is called an inter al graph. Interval graphs have a huge number of applications in archaeological seriation, developmental psychology, ecology, molecular biology, data retrieval, scheduling, etc. (see Roberts 1976).
Indifference graphs and interval graphs are special cases of intersection graphs, graphs whose vertices correspond to sets and which have an edge between two vertices if and only if the corresponding sets have a nonempty intersection. There are many important open research questions concerning intersection graphs. For example, characterizing intersection graphs where the sets are unit squares in the plane, a long-standing open problem, is relevant to judgments of indifference when there are two dimensions to the alternatives being compared.
Social networks are often graphs since the underlying relation defining the arcs is often symmetric. In this case, the strong components are simply called components. The components often consist of sets of vertices each two of which are joined by an edge. Such a set of vertices is called a clique; if an edge between x and y means that they are friends, then a clique is a set of individuals each two of which are friends. Surprisingly enough, it is computationally difficult to find the largest clique in a graph.
If (V, E ) is a graph, its complement is the graph (V, F ) where {x, y}ϵF↔{ x, y}ϵ E. We often seek to partition the vertices of a social network into cliques. In the complement, this problem corresponds to partitioning the vertices into sets with no edges joining vertices within the same set. Such sets are called independent sets. The problem of partitioning the vertices of a graph into independent sets is equivalent to one of the most important problems in graph theory, the graph coloring problem. A coloring of a graph is a function f that assigns a color f (x) to each vertex x so that {x, y}ϵ E↔ f (x) = f ( y). The sets of vertices of a given color form independent sets. Graph coloring has many important applications. In a typical application, individuals who dislike each other must be assigned to different tasks or time schedules or groups. Disliking defines the edges while the colors correspond to the tasks, schedules, or groups. The theory of role assignments in sociology, sometimes known as the theory of role colorings, is closely related. While the subject of graph coloring is an old one, going back to the famous ‘four color problem’ of the nineteenth century, it is a very lively area of research today with important modern variations on graph colorings motivated by practical applications. An example is the list coloring problem, where a list of acceptable colors (tasks, time schedules, groups) is given at each vertex and the color assigned to a vertex must be chosen from its list (see Roberts 1984 for an introduction to graph coloring and Kratochvıl et al. 1999 for the list coloring problem).
5. Signed And Marked Graphs
In some applications of graph theory, it is useful to classify edges as +or –. We then speak of a signed graph. One of the most fascinating applications of signed graphs is as a model of balance in small group sociology. A group of people is called balanced if it works well together, lacks tension, etc. Cartwright and Harary (1956) and Harary (1954) made this concept precise as follows. Let the vertices of a graph be individuals in the group, an edge mean they have a strong relationship, and the sign distinguish between a positive relationship (such as likes, associates with, agrees with, stimulates) and a negative relationship (such as dislikes, avoids, disagrees with, inhibits). If (V, E ) is a (signed) graph, a circuit or cycle is a sequence x1, x2,…, xl of distinct vertices so that t>3, {xt, x ) is in E and for i=1,…, t-1, {xi, x i+1} is in E. There is a lot of evidence to show that a small group is balanced if and only if in the corresponding signed graph, every circuit has an even number of – signs. If the latter holds, we call the signed graph balanced. The same notion was introduced into the economics literature by Morishima in 1952. Characterization of balanced signed graphs was first given by a ‘structure theorem’ by Harary (1954). Later, Maybee and Maybee, Harary and Kabell, and Hansen gave linear time algorithms for determining whether a signed graph is balanced. Notions of balance theory have found applications in a variety of areas, including the study of ‘social justice,’ social inequalities, international relations, and the analysis of multiparty political systems. Since not all systems are totally balanced or totally unbalanced, ways to measure the degree of balance are important and remain a subject of research today (for an introduction to balance theory, see Taylor 1970 or Roberts 1976).
In some applications, it is useful to put signs on the vertices of a graph rather than on the arcs. Such marked graphs arise in the study of social networks, where we think of vertices as individuals who either tell the truth ( sign) or lie (– sign), and where we trace messages through the network. Beineke and Harary called a marked graph consistent if every circuit has an even number of – signs, a concept analogous to balance in signed graphs. Surprisingly, it is mathematically very difficult to characterize consistent marked graphs. In spite of a lot of work on this subject, a complete understanding of what marked graphs are consistent remains elusive.
6. Rankings And Combinatorics
Strict weak orders, that is, asymmetric, negatively transitive digraphs, are sometimes called rankings. We can rank the vertices from top to bottom, with ties allowed. Rankings arise in the theory of voting, group consensus, and social welfare. There are situations where just knowing a voter’s first choice candidate does not give us enough information to find an appropriate winning candidate. It can be useful to have each voter provide a ranking of the candidates. Then we need a rule that provides a winning ranking. If such a rule is defined for every possible combination of rankings, we call it a group consensus function or social welfare function (SWF ).
The theory of SWFs goes back at least to the eighteenth century (in the work of Marie Jean Antoine Nicolas Caritat, Marquis de Condorcet, and of JeanCharles de Borda), but had its modern impetus in the economic modeling of Kenneth Arrow. Arrow listed some reasonable axioms we might require of an SWF and showed that there was no function satisfying these axioms. Arrow’s Impossibility Theorem has been modified, replicated, and applied in a myriad of ways since then. A few general references on group consensus are Campbell 1992, Kelly 1988, and Roberts 1976, 1989.
Modern applications of SWFs and notions of group consensus put a great deal of emphasis on computational tractability of rules for determining the winning consensus. Bartholdi, Tovey, and Trick, Wakabayashi, and others showed that there are voting rules that are computationally intractable, that is, where it is extremely difficult to compute the winner of an election (see Roberts 1989). They also pointed out that sometimes computational intractability is useful, as when we wish to make it difficult to manipulate the outcome of an election such as by adding voters, declaring candidates ineligible, etc. Computational tractability becomes an issue when there are large numbers of voters or candidates. This is the case in applications of theories of group consensus to meta- search on the Internet, that is, combining the results of different search engines, and to such e-commerce applications as collaborative filtering where the rankings of different individuals among alternative movies, books, or restaurants are combined to produce an automated ranking as a recommendation to a given user of a system. Important open questions about SWFs arise in such applications, including issues of learning and adapting through repetition.
If a ranking does not allow ties, we sometimes talk about a strict simple order or a permutation. Strict simple orders are also important in applications such as models of power in voting situations. Suppose different ‘players’ (such as states in the US Electoral College or owners of shares in a company) have different numbers of votes. Imagine adding players to a ‘coalition’ one at a time until enough votes are obtained to ‘win.’ The player whose votes throw a coalition over from losing to winning is called pivotal. One measure of the ‘power’ of a player in such a situation is the probability that the player is pivotal if a coalition is formed at random. This is known as the Shapley value. There are a variety of other interesting power measures that, like this one, have come out of the theory of cooperative games (see Fudenberg and Tirole 1991 and Roberts 1976). The Shapley value can be calculated by counting the number of permutations of the players in which a given player is pivotal and then dividing by the number of permutations of the players. In large games, this becomes a computationally intractable problem. To solve it in special cases, one has to solve counting problems.
The counting problem, involving finding the number of permutations, combinations, and other mathematical objects, is a fundamental problem of the branch of DM known as combinatorics. The Shapley value has been calculated for various governmental bodies such as different legislatures, the UN Security Council, and the US Electoral College. Yet, new computational procedures for calculating it are very much required. This is especially important in light of the many uses of the Shapley value in cost allocation problems such as fairly sharing the cost of telephone systems, airports, libraries, and multicast transmissions of movies.
In conclusion, discrete mathematics is finding many new and unexpected applications in the social and behavioral sciences. At the same time, the social and behavioral sciences are one of the important stimuli for the development of this rapidly growing field of mathematics.
Bibliography:
- Campbell D E 1992 Equity, Efficiency, and Social Choice. Clarendon Press, Oxford, UK
- Cartwright D, Harary F 1956 Structural balance: A generation of Heider’s theory. Psychology Review 63: 277–93
- Degenne A, Forse M 1999 Introducing Social Networks. Sage, London
- Fishburn P C 1985 Inter al Orders and Inter al Graphs. Wiley, New York
- Fudenberg D, Tirole J 1991 Game Theory. MIT Press, Cambridge, MA
- Harary F 1954 On the notion of balance of a signed graph. Michigan Mathematical Journal 2: 143–46
- Harary F, Norman R Z, Cartwright D 1965 Structural Models: An Introduction to the Theory of Directed Graphs. Wiley, New York
- Kelly J S 1988 Social Choice Theory. Springer-Verlag, Berlin
- Kolman B, Busby R C, Ross S C 1999 Discrete Mathematical Structures, 4th ed. Prentice-Hall, Englewood Cliffs, NJ
- Kratochvil J, Tuza Zs, Voigt M 1999 New trends in the theory of graph colorings: Choosability and list coloring. In: Graham R L, Kratochvil J, Nesetril J, Roberts F S (eds.) Contemporary Trends in Discrete Mathematics. DIMACS Series, Volume 49, American Mathematical Society, Providence, RI, pp. 183–97
- Luce R D 1956 Semiorders and a theory of utility description. Econometrica 24: 178–91
- Roberts F S 1976 Discrete Mathematical Models, with Applications to Social, Biological, and Environmental Problems. Prentice-Hall, Englewood Cliffs, NJ
- Roberts F S 1984 Applied Combinatorics. Prentice-Hall, Englewood Cliffs, NJ
- Roberts F S (ed.) 1989 Applications of Combinatorics and Graph Theory to the Biological and Social Sciences. IMA Volumes in Mathematics and its Applications, Vol. 17. Springer-Verlag, New York
- Scott D, Sappes P 1958 Foundational aspects of theories of measurement. Journal of Symbolic Logic 23: 113–28
- Taylor H F 1970 Balance in Small Groups. Van Nostrand Reinhold, New York
- Trotter W T 1992 Combinatorics and Partially Ordered Sets: Dimension Theory. Johns Hopkins University Press, Baltimore, MD
- Warfield J N 1976 Societal Systems: Planning, Policy, and Complexity. Wiley, New York
ORDER HIGH QUALITY CUSTOM PAPER

Always on-time

Plagiarism-Free

100% Confidentiality