
Sample Landsat Imagery In Geography Research Paper. Browse other research paper examples and check the list of research paper topics for more inspiration. iResearchNet offers academic assignment help for students all over the world: writing from scratch, editing, proofreading, problem solving, from essays to dissertations, from humanities to STEM. We offer full confidentiality, safe payment, originality, and money-back guarantee. Secure your academic success with our risk-free services.
The Landsat series of satellites have produced one of the most valuable remote sensing records of change in the earth’s land surface. The particular value of their data lies in the length of their record, which goes back almost continuously to 1972. Their value also arises from their relatively detailed scale or resolution compared with many space-borne sensors, since this means that the impacts of human activities such as deforestation or urbanization can be readily detected and monitored. Much useful information can be obtained from Landsat images through visual inspection of photographic hard copy. But the derivation of reliable quantitative information usually relies on careful processing of digital data from the satellites’ sensors. Landsat data have been used for numerous different applications, many relating to land cover. This term refers to the biophysical state of the earth’s surface cover and provides a valuable input for the mapping and monitoring of land use. Other uses of the data include water and air pollution monitoring, and mineral discovery (Jensen 2000, Lillesand and Kiefer 1999). Landsat data and the products derived from them are often best used when placed within the framework of a Geographic Information System (GIS).
Academic Writing, Editing, Proofreading, And Problem Solving Services
Get 10% OFF with 24START discount code
1. The Landsat Series
The first Landsat satellite was placed in orbit on September 23, 1972 (Table 1). Several subsequent satellites have been launched successfully, with the exception of Landsat 6, which failed to reach orbit. All the other satellites have exceeded their nominal lifetimes. The first three Landsat satellites (given the original name of ERTS or Earth Technology Resources Satellite) had a Multispectral Scanner System (MSS) as the prime sensor, yielding data with spatial resolution of 79 m. Subsequently Landsats 4 and 5 not only had the MSS sensor but also included the sensor called the Thematic Mapper (TM), which has a resolution of 30 m. On Landsat 7 the Enhanced Thematic Mapper (ETM) was the sole sensor on board; its properties are similar to those of the TM, but it has some capability for providing more detailed images (see Table 1). All instruments collect data by focusing radiation from the earth on detectors; the resultant recorded signals represent the amount of incoming radiation in digital form. Radiation from several different wavebands is measured simultaneously. These signals can then be used to create hard-copy pictures such as those illustrated here, or can be made available as digital files that can be subsequently processed by the user. The spatial resolution of the sensors indicates the smallest size of object detectable, but the latter is also dependent on the contrast between the object and its surroundings. Also, digital processing of the data can generate products with different pixel sizes. Hence, although the basic resolution of the MSS is 79 m and the TM is 30 m, many of the standard products purchased by users will have pixel sizes of 57 m and 28.5 m respectively. The frequency of images acquired from Landsat varies considerably. Landsats pass over every part of the earth’s surface approximately once every 16–18 days but in practice images are collected far less frequently, due to factors such as cloud cover and lack of recording capacity of satellites. In the early 1970s a systematic attempt was made to acquire global coverage. In contrast, during much of the 1980s and 1990s, when the system was operated by commercial entities, data were often only acquired when a firm customer had been identified for a particular scene. Only with the launch of Landsat 7 was an acquisition strategy implemented to ensure total global acquisition of cloud-free images on a seasonal basis.
All Landsats have a sun-synchronous orbit, which means they can take images of every location at the same time each day. This greatly assists in change detection. One of the important progressive improvements in the Landsat sensors during their history has been their better calibration, resulting in an increasingly accurate record of the earth’s surface.
2. Distinctive Role Of Landsat Data
The high resolution and long record of Landsat data make them especially useful for the detection and monitoring of human impacts on the earth’s surface. There are other satellite systems with similar sensing capabilities to those of Landsat. These include the French SPOT (Satellite Probatoire pour l’Observation de la Terre) series of satellites with a spatial resolution of 20 m (and 10 m for a panchromatic band) and the IRS (Indian Remote Sensing Satellite) series launched by the Indian Space Agency. Images from these are capable of being used in the same way as data from Landsat. However, neither has the longevity or comprehensiveness of the spatial coverage provided by Landsat’s sensors.
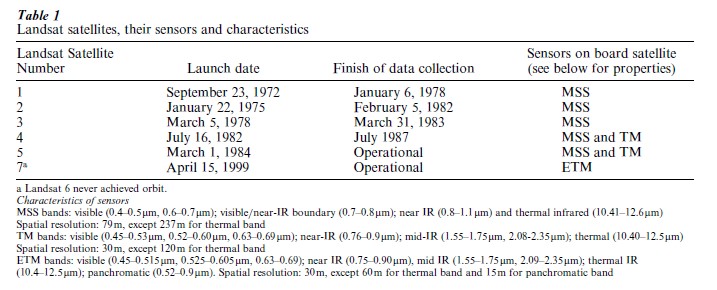
Complementing Landsat data are those at coarser resolutions, notably from the NOAA series of satellites. Advanced Very High Resolution Radiometer is of particular value in monitoring seasonal variations in crops and other types of vegetation (D’Souza et al. 1996), but only at the coarse resolution of around 1 km. Much finer resolution data from commercially launched satellites (or from intelligence data released to the general public) provide much more detailed images than Landsat in which human activities can more readily be interpreted (Fig. 1); their availability is much more restricted than Landsat data.
3. What Do Images From Landsat Show?
Successful use of Landsat data requires an understanding of the basics of how radiation interacts with the earth’s surface and its atmosphere (Lillesand and Kiefer 1999). The higher the amount of incoming radiation in a given waveband (Table 1) the higher the digital number recorded by the sensor. All the bands of the sensors except for the thermal infrared band sense the amount of reflected radiation, including the near and mid infrared. TM bands 1 through 3 sense radiation in the part of the spectrum sensed by the human eye, TM band 4 senses the near infrared which is sensitive to the reflectance by the physical structure of healthy vegetation, and TM bands 5 and 7 are sensitive to the amount of water in leaves as well as the physical and chemical composition of soil materials. For the thermal infrared bands, higher recorded values relate to the temperature of the surface.
Pictures derived from Landsat images are usually false-color images in that they represent the sensed radiation by use of colors readily recognizable by the human eye, but do not show the actual appearance of the surface to the unaided human eye (Parkinson 1997). Figure 2 shows TM data. The atmosphere can substantially distort the signal received by the Landsat sensors.

4. Extracting Information From Landsat Imagery
Extracting information from Landsat data basically involves finding out what amount of recorded radiation corresponds to samples of known ground conditions radiation and using these relationships to extrapolate throughout the whole image. In practice, if reliable results are to be obtained a quite complex set of technical procedures have to be performed (Lillesand and Kiefer 1999). First, even obtaining images of the right place and date may require interrogation of several different archives, because as yet there is no single comprehensive archive; the United States Geological Survey has the most comprehensive set of images. Ground reference data will often have to be collected, though higher resolution remotely sensed data can sometimes act as a useful surrogate for ground data (Fig. 1). Pre-processing of the Landsat data is commonly required. Correction of the data may be required to avoid problems such as variability in sensor performance over time and reduction of atmospheric distortions, when change detection is being carried out. Reprojection of the data will often be necessary to ensure the data are coregistered with conventional map bases and are coregistered with each other if more than one set of Landsat images are used. Because of the importance of a common spatial framework for Landsat data, and other spatial data sources as well as field data, GIS is commonly used.
A choice will need to be made between different information extraction procedures. Reliance solely on traditional photo-interpretation methods is relatively uncommon nowadays. Even where photo-interpretation methods are adopted, users will employ digital enhancement methods to aid the interpretation. Computer-based methods, normally using some type of statistical decision rule, are most commonly applied, since they allow the most internally consistent and detailed results. Once the information has been extracted using such methods, editing by skilled interpreters can enhance the quality of the result. Finally an assessment of the accuracy of the result should be carried out using field or other reference data not used in earlier stages, so that the reliability of the end products is understood.
5. Applications Of Landsat Imagery
Landsat images have been used for a wide range of applications, including many concerned with the transformation of the biophysical environment by humans and the impact of the physical environment on human society. One of the more important applications has been in the monitoring of forests, especially in tropical regions. Deforestation in the tropics and sub-tropics is a longstanding phenomenon, but one which has accelerated greatly in recent years. Its significance in the impact on the global carbon cycle and hence on global warming, on massive reductions of biodiversity (because of the species richness of these areas), and on its impact on the sustainability of these regions.
Until relatively recently there was considerable controversy about the actual rates of tropical deforestation. The analysis of Landsat data has done much to reduce uncertainties over both the rate and location of deforestation. Some of the higher estimates of deforestation for the Brazilian Amazon were shown to be incorrect (Skole and Tucker 1993). The need for spatially comprehensive Landsat (or similar resolution) data to obtain accurate estimates has been confirmed (Tucker and Townshend 2000). Different types of land management can be readily discerned from the resultant spatial patterns depicted on Landsat data (Fig. 2). The overall pattern of deforestation is clearly linked to the location of transportation corridors and settlement. Deforestation within countries is often a direct result of government-sponsored resettlement, as in Brazil and Indonesia, as well as international investment in agriculture, as in southern Bolivia, where World Bank loans have encouraged extensive industrial soybean production (Steininger et al. 2000).
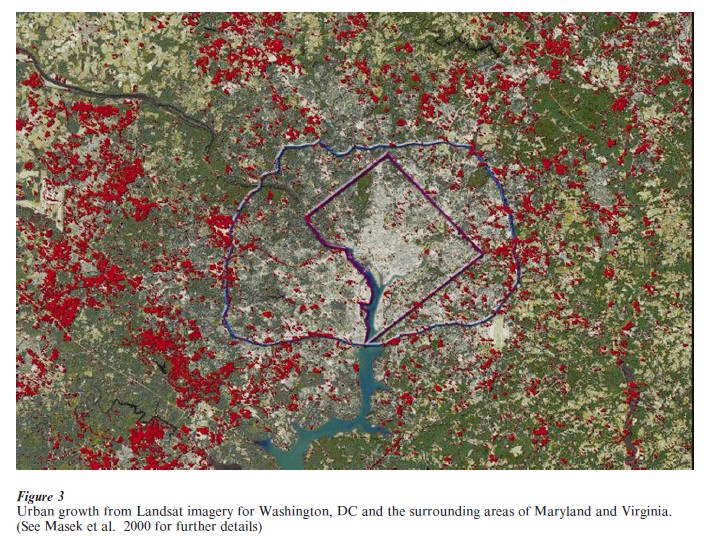
Urbanization is another process of land transformation that can be monitored using Landsat data (Masek et al. 2000). Figure 3 shows the expansion of built-up areas near Washington DC between the 1980s and 1990s. Although reliable aggregated data are available in many developing countries, the benefit of products derived from Landsat lie in the flexibility of aggregation and disaggregation of spatial units. In developing countries, in particular, products derived from Landsat data will often be much more up to date than locally derived official data.
The use of Landsat and other forms of remote sensing in the social sciences can be found in the collection of papers edited by Liverman (1998).
6. Conclusions
Data from the Landsat series of satellites provide an invaluable source of information on the earth’s environment, especially properties of the land surface, and how it has been affected by human activities. Not only do the resultant images provide timely information on current conditions, but as time passes they provide an increasingly useful historical record.
Bibliography:
- D’Souza G, Belward A S, Malingreau J-P 1996 Advances in the Use of NOAA AVHRR Data for Land Applications. Kluwer Academic Press, Dordrecht, The Netherlands
- Jensen J R 2000 Remote Sensing of the Environment: An Earth Resource Perspective. Prentice-Hall, New York
- Lillesand T M, Kiefer R W 1999 Remote Sensing and Image Interpretation, 4th edn. Wiley, New York
- Liverman D (ed.) 1998 People and Pixels: Linking Remote Sensing and Social Science. National Research Council, Washington, DC
- Masek G, Lindsay F, Goward S N 2000 Dynamics of urban growth in the Washington DC metropolitan area, 1973 –1996, from Landsat observations. International Journal of Remote Sensing 21: 3473–86
- Parkinson C L 1997 Earth from Above: Using Color-Coded Satellite Images to Examine the Global Environment. University Science Books, London
- Skole D L, Tucker C J 1993 Tropical deforestation and habitat fragmentation in the Amazon: Satellite data from 1978 to 1988. Science 260: 1905–9
- Steininger M K, Tucker C J, Townshend J R, Killeen T R, Bell V, Ernst P 2000 Tropical deforestation in the Bolivian Amazon Environmental Conservation(in press)
- Tucker C J, Townshend J R G 2000 Strategies for monitoring tropical deforestation using satellite data. International Journal of Remote Sensing 21: 1461–71
ORDER HIGH QUALITY CUSTOM PAPER

Always on-time

Plagiarism-Free

100% Confidentiality