
Sample Dynamic Mapping In Geography Research Paper. Browse other research paper examples and check the list of research paper topics for more inspiration. iResearchNet offers academic assignment help for students all over the world: writing from scratch, editing, proofreading, problem solving, from essays to dissertations, from humanities to STEM. We offer full confidentiality, safe payment, originality, and money-back guarantee. Secure your academic success with our risk-free services.
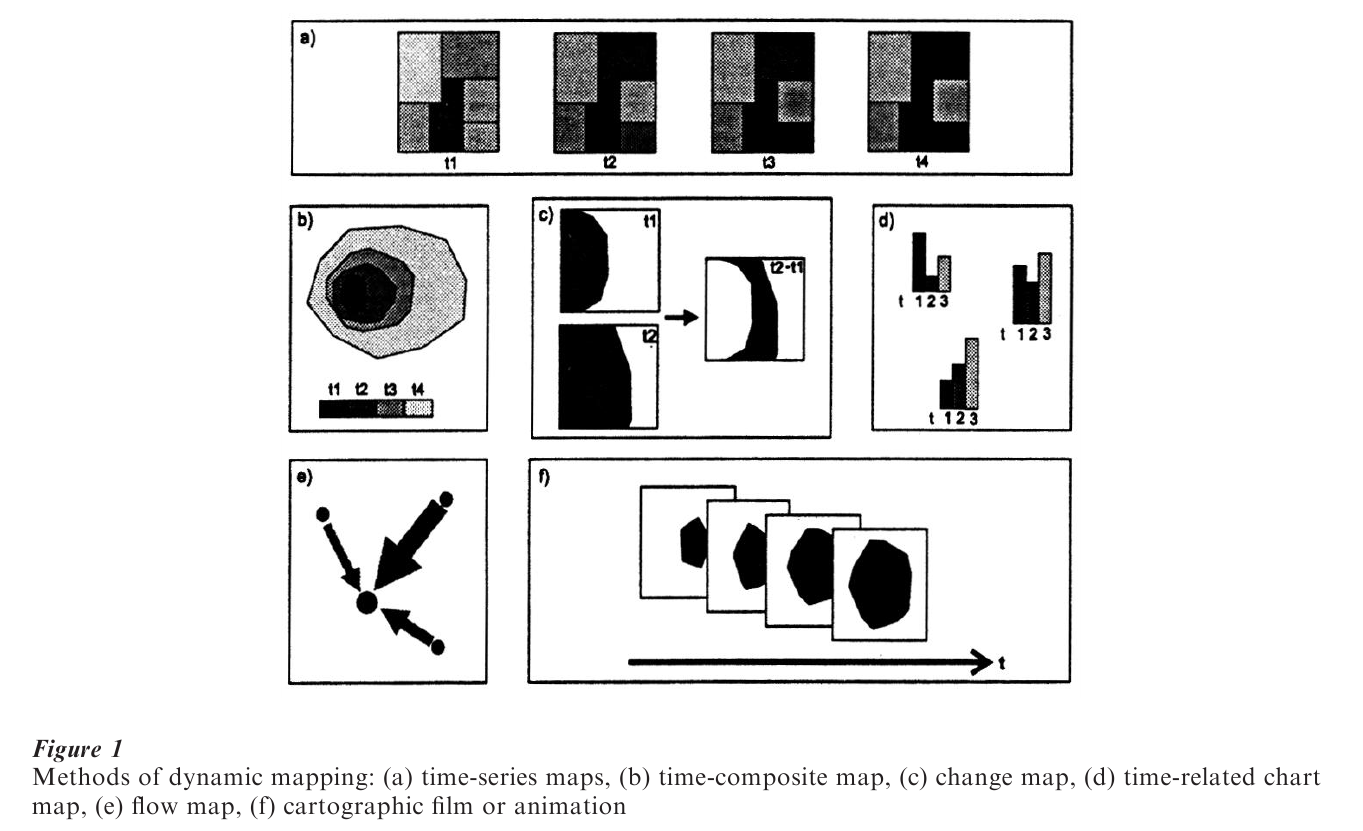
Dynamic mapping summarizes various cartographic presentation methods which incorporate the dimension of time into a map. These methods can be differentiated into those used either for static presentations or for dynamic presentations. All presentation methods have their own individual characteristics and are suitable for specific applications (Fig. 1).
Academic Writing, Editing, Proofreading, And Problem Solving Services
Get 10% OFF with 24START discount code
1. The Term And Concept Of Dynamic Mapping
Dynamic mapping is a cartographic concept used to depict dynamic spatial phenomena or to present spatial information in a dynamic way. It is involved with the depiction of spatial processes on maps. Our world is in permanent change. If the changes are of less interest because of their relative unimportance, it is sufficient to present a specific state of our world and of the corresponding date. Yet, if the occurring changes are of great importance, the dynamic aspect of reality—the dimension of time—has to be depicted in maps. Maps, however, are static: they can depict states but they can hardly show dynamic processes. To overcome the static nature of maps, different presentation methods were developed to give an impression of the changes and movements in space (Monmonier 1990, Muehrcke 1992). Recently the concept of dynamic mapping has been expanded by computer technology. Not only is the presentation of spatial changes now a matter of interest, but so too is dynamic presentation of spatial data, such as the successive display of map objects.
2. Methods Of Dynamic Mapping In Static Maps
One presentation method for depicting spatial processes are time-series maps. They show a particular area and subject at different points in time in a series of maps. The user has to compare the individual maps and has to understand the changes which have occurred. Time-series maps have to be arranged in a way that enables visual comparison. They have to be placed next to each other, and their content should not be too complex. Map series are applied to show the distribution of particular phenomena at certain given intervals, e.g., changes of population distribution, boundaries, or landforms, etc.
Another method is the time-composite map. Such a map depicts two or more stages of the development of a particular phenomenon in one single map. The distinct stages can be differentiated by color, pattern, isolines, or point symbols. Time-composite maps are suitable for showing the expansion or contraction of areas, linear networks, or other phenomena, e.g., the growth of a city, the development of transportation systems, or the spread of diseases. Time-composite maps succeed in presenting one-directional changes, but they fail if retrogressive developments have to be depicted as an intermediate stage.
Map series and time-composite maps show only selected stages of the entire development. The change itself has to be understood by interpretation. However, some geographical questions emphasize, above all, the change and its extent. These questions require a map which shows explicitly the change that has taken place within a certain time period. For that purpose the change map was developed. Qualitative change maps depict objects which have been added to or removed from a particular area during a relevant time period, e.g., the difference in forest cover in different years. Quantitative change maps present changes in magnitude, the change in a value such as population density or air pollution. They either show the direction of change as increase or decrease, or give the absolute values of magnitude change.
A further method of presenting changes directly is a map with time-related charts which depicts developing phenomena of areas or locations in line or bar graphs, e.g., maps with diagrams of the annual temperature curve for selected stations. This type of map is able to give a detailed impression of development in time but it has its limitations in depicting the spatial distribution of a changing phenomenon.
Geographical processes may take place at a particular location (similar to the mentioned changes of population or temperature) or they may be a sort of movement in space like the movement of people, goods, or winds. To show these spatial movements, vector or flow maps with special symbols such as arrows or lines are applied. The position and alignment of the arrows and lines can depict the moving objects’ routes and directions, and the size of the signatures can denote the objects’ values. Typical examples of vector or flow maps are maps of expedition routes, commuter movements, or ocean currents.
3. Cartographic Film And Animation As Dynamic Maps
All of the presentation methods referred to above are able to produce an idea regarding the changes that take place, but they have their limitations: they fail to depict the dynamics of the process. They are snapshots and the changes in the inter-snapshot periods can only be inferred.
For this reason, cartographic films were made. Films are dynamic presentation forms which are not restricted to single stages and can therefore give an impression of the complete process. Cartographic films are created like animated cartoons. They are sequences of slightly varying maps that give the illusion of continuous spatial movement or change in the case of fast presentation (24–30 pictures per second). Early cartographic films had to be made by hand; each map of the sequence was drawn by a cartographer. They were produced for military propaganda to depict frontier changes during World War II, or as instruction material for students. Despite their advantages, cartographic films did not become a widespread presentation form because of their time-consuming and expensive creation.
The cartographic film benefited from computer animation (Thrower 1961). Computer animations are film sequences completely generated by computer. Only some initial maps of the sequence are arranged by a cartographer, the intermediate maps are constructed automatically by the computer. Computer animations have two advantages compared to traditional films. First, computers take over the timewasting map-making process of traditional films and allow quicker and less expensive production of cartographic animations; second, computer animations can be controlled interactively by the user. At a basic level, interaction means the start, stop, and interruption of an animation. At a higher level, more sophisticated interactions are possible, such as the selection of particular time intervals or the definition of different viewpoints (Peterson 1994).
Because of the advantages of speedy production and interaction, computer animation brought great potential to cartographic visualization and expanded the concept of dynamic mapping. Computer animation is no longer used exclusively for the depiction of spatial dynamic phenomena, it is also employed for any dynamic presentation of spatial data (DiBiase et al. 1992, Dransch 1997). Examples include the successive display of map objects, the alteration of graphic presentation, or the variation of the user’s viewpoint. According to this differentiation two types of cartographic animation exist: temporal animation and nontemporal animation. These are able to improve the visualization of spatial data for demonstration purposes, as well as for exploration tasks; support the understanding of spatial processes and relations; increase the users’ attention; and assist graphic data exploration.
Computer animations are quite different presentation forms compared to static maps. They are dynamic and they provide plenty of information to the user in a short time. The existing cartographic rules of map-making, therefore, have to be extended and the question of suitable applications, efficient design, and also cognitive aspects has generated recent research topics in the field of dynamic mapping (MacEachren and DiBiase 1991, Monmonier 1992, Buziek 1999, Kraak 1999).
4. Future Of Dynamic Mapping
Developments in computer science and technology concerning virtual reality (VR) may further expand the concept of dynamic mapping. VR technology produces virtual environments by computer (Shneiderman 1998). The user will become part of this virtual world and may interact with it via multifarious interfaces. In cartography, spatial processes could be created with VR technology to give the user a vivid and lifelike impression. In addition, VR technology could also be used to build abstract worlds in which to present spatial concepts or data in a dynamic and highly interactive way. In this way, VR technology will add more vividness and interactivity to cartography and dynamic mapping, however, it also changes the traditional cartographic viewpoint. In contrast to the traditional method of looking at a map, using VR means being in the presentation. This entails the danger of getting lost because the spatial overview that is provided by maps is missing.
Bibliography:
- Buziek G 1999 Dynamic elements of multimedia cartography. In: Cartwright W, Peterson M P, Gartner G (eds.) Multimedia Cartography. Springer, Heidelberg, Germany, Chap. 22, pp. 231–4
- DiBiase D, MacEachren A M, Krygier J, Reeves C, Brenner A 1992 Animation and the role of map design in scientific visualization. Cartography and Geographic Information Systems 19: 201–14
- Dransch D 1997 Computer-Animation in der Kartographie. Theorie und Praxis. Computer Animation in Cartography: Theory and Practice. Springer, Heidelberg, Germany
- Kraak M J 1999 Cartography and the use of animation. In: Cartwright W, Peterson M P, Gartner G (eds.) Multimedia Cartography. Springer, Heidelberg, Germany, Chap. 17, pp. 173–80
- MacEachren A M, DiBiase D 1991 Animated maps of aggregate data: conceptual and practical problems. Cartography and Geographic Information Systems 18: 221–9
- Monmonier M 1990 Strategies for the visualization of geographic time-series data. Cartographica 27: 30–45
- Monmonier M 1992 Summary graphics for integrated visualization in dynamic cartography. Cartography and Geographic Information Systems 19: 23–36
- Muehrcke P C 1992 Map Use: Reading, Analysis and Interpretation. J. P. Publications, Madison, WI
- Peterson M P 1994 Interactive and Animated Cartography. Prentice-Hall, Englewood Cliffs, NJ
- Shneiderman B 1998 Designing the User Interface Addison Wesley, Reading, MA, Chap. 6.8
- Thrower N J W 1961 Animated cartography in the United States. International Yearbook of Cartography 1: 20–30
ORDER HIGH QUALITY CUSTOM PAPER

Always on-time

Plagiarism-Free

100% Confidentiality