
Sample Educational System of Australia Research Paper. Browse other research paper examples and check the list of research paper topics for more inspiration. If you need a research paper written according to all academic standards, you can always turn to our experienced writers for help. This is how your paper can get an A! Also, check out our custom research proposal writing service for professional assistance. We offer high-quality assignments at reasonable rates.
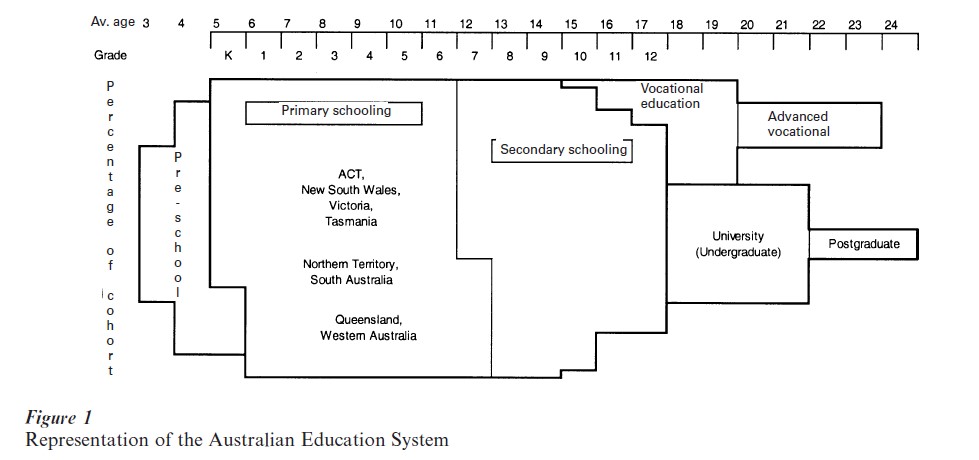
As the individual governments of the six Australian states and the two territories have the major responsibility for education there is no one national system. Despite this, the provisions in each jurisdiction are similar. Collaboration on matters of policy take place in a council of ministers of education and the roles of the federal government have increased in recent years. Education is provided as part of preschool education, school education, and tertiary education (consisting of vocational education and training as well as higher education). Major elements of the education systems in Australia are represented in Fig. 1.
Academic Writing, Editing, Proofreading, And Problem Solving Services
Get 10% OFF with 24START discount code
1. National Context
In 1997, Australia had a population of 18.5 million in an area of 7.7 million km . Although the overall population density is low, it is a highly urbanized society; the two largest cities contain 40 percent of the population. Outside the cities, the country is sparsely populated; 30 percent of primary schools have fewer than 100 students and 30 percent of secondary schools have fewer than 500 students. Commentators have noted that centralized administrative structures emerged to promote uniformity of educational provision for a dispersed population. Although the Australian population is mainly of European background, recent immigration has produced greater ethnic and cultural diversity. One-fifth of the population was born overseas. English remains the language of most activities in education. About 2.5 percent of Australian school students are of Aboriginal descent, some of whom still live in isolated communities.
The Government is a parliamentary democracy. After the federation of former colonies in 1901, states retained responsibility for education. Two territories have education powers similar to the states. Political responsibility, federally and in each state, resides with a minister who is accountable to the relevant parliament. State governments provide about 60 percent of all public expenditure on education (90 percent of the expenditure on school education). The federal government provides 40 percent (including most of the expenditure on universities). For the financial year 1996 to 1997, total public and private expenditure on education was A$29,300 million, which represented 5.7 percent of GDP. Government outlays amounted to A$24,500 million. Over half of these outlays (A$13,900 million) were directed to primary and secondary schooling (ABS 1998a).
The World Bank classifies Australia as a high-income country. In 1996 to 1997, per capita GDP was just over A$24,000. Literacy among adults is nearly universal and 43 percent hold a post-school qualification. Just over 12 percent have university degrees and 11 percent have a vocational qualification. Amid general affluence, unemployment among young people has remained high in recent years. In November 1996, some 11 percent of 15–19-year-olds were unemployed and a number of programs are concerned with transitions between education and work (OECD 2000, p. 128). Shifts in patterns of employment towards service industries have also resulted in changes to education and training programs.
Figure 1 Representation of the Australian Education System
2. Preschool Education
Although the states and territories provide preschool education there is no national policy on its provision. The age at which children attend preschool varies across jurisdictions and differences exist in the organization of preschools. A national survey reported in 1996, that 188,200 children younger than five years attend preschool. Children of three and four years old make up 92 percent of children at preschool. A majority of 4-year-olds attend preschool on a part-time basis (ABS 1996).
3. Primary And Secondary Schooling
Education is compulsory from six to 15 years (16 in Tasmania). Most children start primary school at five years of age and continue for either six or seven years (depending on the state), and students complete primary school at the age of 11 or 12 years. Students in Australian primary schools usually have one teacher for most subjects, and are promoted each year. During the 1990s, there emerged a national focus on the development of literacy especially in the early years. This focus is embodied in a National Literacy and Numeracy Plan agreed to by federal, state, and territory education ministers (DEETYA 1998).
Secondary education is provided for either five or six years depending upon the length of primary education in the state. The first one or two years of secondary school typically consist of a general program followed by all students. In subsequent years, a basic core of subjects is supplemented with optional subjects available to students. Students in secondary schools generally have a different teacher for each separate subject area. In the final two years of secondary schools students have more scope to specialize and a range of elective studies is provided from which students choose five or six. Almost all (95 percent) final-year students study English and 85 percent study a mathematics subject. Subjects from the sciences and studies of society and environment are taken by 70 percent of students. Just fewer than half the students include a technology subject, 30 percent take an arts subject, and 10 percent study a foreign language (Ainley et al. 1994).
One of the most marked changes during the 1980s was an increase in the percentage of students who remained to complete secondary school. The percentage of commencing secondary students remaining to the final year of school rose from 35 percent in 1980 to 77 percent in 1993. It has since declined a little to 72 percent in 1997. Since 1976, the school completion rate has been higher for girls than boys. In 1997, 78 percent of girls, compared to 66 percent of boys, remained to the final year of school (DETYA 1999).
For both primary and secondary schools the length of the school year is approximately 200 days; beginning at the end of January and ending in the third week of December and divided into four terms of nine to 11 weeks. The summer vacation is five or six weeks. Students attend school five days per week. In primary schools, there are five hours of tuition per day and in secondary schools there are 5.5 hours tuition per day.
3.1 Government Schools
State education departments recruit and appoint the teachers in government schools, supply buildings, equipment, and materials, and provide limited discretionary funding for use by schools. In most states some responsibility for administration, staffing, and curriculum has been devolved to regional education offices and schools (which has become more extensive in recent years).
In 1997, the average sizes of primary and secondary schools were approximately 230 and 780 respectively (MCEETYA 1997). During the 1990s there was a planned reduction in the number of government schools so as to increase the average school size. Most government secondary schools are comprehensive and coeducational. There are a small number of selective entry secondary schools in some states. In Tasmania and the Australian Capital Territory, the final two years of government schooling is in separate senior secondary colleges.
In 1997, the ratio of students to teachers was 17.9 in primary schools and 12.7 in secondary schools. In the 1996 to 1997 financial year, per capita expenditure was A$4,686 in government primary schools and A$6,447 in government secondary schools (MCEETYA 1997). In the largest system, in 1993 the average class size in primary schools was 27.4 and the average size of English classes in secondary schools was 22.9 (MCEETYA 1994).
Taxation revenues provide almost all the financial resources for the operation of government schools. Although parents are not officially required to pay fees for students to attend government schools, many schools seek voluntary contributions from parents and raise funds from other local sources.
3.2 Non-Government Schools
Non-government schools enrolled 30 percent of students (26 percent of primary and 34 percent of secondary school students) in 1997, a proportion that has gradually risen since 1970. Most private schools have some religious affiliation, most commonly with the Catholic Church (66 percent of private school students are in Catholic schools). Other private schools vary from long-established prestigious schools to relatively new lower-cost schools. A range of funding sources including government grants supports private schools. In 1997, 44 percent of private school income was derived from fees or donations, 18 percent from state government grants and 38 percent from federal government grants. Government grants comprised 72 percent of the income of Catholic schools and 34 percent of the income of independent schools. In 1997, per capita expenditure was estimated as A$3,996 and A$6,510 in non-government primary and secondary schools respectively (MCEETYA 1997).
3.3 Special Education
Special education programs are provided for students with physical, intellectual, and emotional disabilities. A national study in 1992 estimated that about 2 percent of students in Australian schools had some form of disability. At that time, about 30 percent of students with disabilities were enrolled in special schools, 25 percent were enrolled in special classes or units attached to other schools, and 45 percent were enrolled in regular school classes. Over the past 20 years, policies have been directed towards supporting education for a greater proportion of students with disabilities in regular school classes (deLemos 1994).
3.4 Curriculum
Although there is no national curriculum, governments collaborated in the early 1990s to develop curriculum statements and profiles in eight key learning areas: English, mathematics, science, technology, studies of society and the environment, the arts, health and physical education, and languages other than English. The statements provide an account of the aims and content of each area of learning as a framework for curriculum in primary and secondary schooling. The profiles provide an outline of a sequence of students’ development of knowledge, understanding and skills and a framework for assessing and reporting student progress and achievements. Although the national statements were not adopted, states and territories use statements and profiles in some form for curriculum development, incorporating variations that reflect local policies and priorities. In 1990, the state and federal education ministers established the Curriculum Corporation, a semi-autonomous body with a charter to develop curriculum materials on a commercial basis.
Within states, central authorities specify curriculum guidelines and schools have considerable autonomy in deciding curriculum detail, textbooks, and teaching methodology at primary and junior secondary level. At the senior secondary level, the curriculum is specified in detail by a state authority responsible for examining and certifying student achievement.
3.5 Assessment And Monitoring Of Student Achievement
All states operate statewide assessment and monitoring programs for primary schools. There is population testing of students in government schools in English and mathematics at Grade 3 and Grade 5. The purposes are to report information about student achievement, based on a common test to parents, teachers, and schools and to monitor the overall performance of the education system. Most of the assessment instruments used in these programs of testing incorporate a range of items including multiple choice and open-ended response items, and make use of modern measurement techniques that have enabled forms of criteria-referenced reporting to be implemented. Formal statewide assessment programs are currently less common in the lower secondary grades than in primary school. Evidence from the National School English Literacy Survey (Masters and Forster 1997) conducted in 1996, indicates the extent of differences in early literacy achievement; the top one-fifth of students in Year 3 performed at a level close to the average for Year 5.
3.6 Teachers
A little over 207,000 (full-time equivalent) teachers were employed in schools in 1997: approximately 104,000 in primary and 103,000 in secondary schools. Overall 65 percent of teachers are female (77 percent in primary and 53 percent in secondary schools) (ABS 1998b). Teaching is an occupation with relatively high prestige, being the third top of 16 categories on the occupational prestige scale. Salaries are determined at state level and there are differences between states. The annual starting salary is approximately A$30,000 and for a teacher with 10 years’ experience is about A$45,000. Teacher training occurs in universities, but states determine acceptable qualifications. A total of 4 years of higher education is the normal length of initial training for secondary teachers; typically, a 3-year degree in a major discipline and a 1-year diploma of education. Primary teachers normally complete a 3 year diploma of teaching, but many later improve their qualifications with specialist diplomas or a 4th year, resulting in a degree.
3.7 Information And Communication Technologies In Schools
From the mid-1990s, efforts have been made to incorporate information and communication technologies in school programs. The intention is for students to become proficient at using information technologies, graduate as skilled users of the technology, and use these tools to support learning across the curriculum. Schools vary in the extent to which students have access to these technologies and high costs are an impediment. A national survey in 1998, estimated that 64 percent of schools operated with a ratio of between 6 and 15 students per computer; the average figure being approximately 12 (Meredyth et al. 1999).
4. Vocational Education And Training
Vocational education and training (VET) is an important component of education in Australia. A variety of courses are provided through institutes of technical and further education (TAFE) and other organizations. Most (over 95 percent) vocational education and training is provided in colleges (or institutes) of technical and further education (TAFE). Courses include a range of vocational training from entry-level employment preparation to trades (e.g., through apprenticeships) through advanced vocational courses to para-professional and professional courses. In addition, many recreation and leisure programs are provided.
4.1 Students
In 1997, approximately 121,000 TAFE students graduated with a qualification from a vocational course of at least 200 hours, or one semester, duration (NCVER 1998). Some 20 percent of young people participate in a TAFE program by the age of 19 and a further 15 percent (mostly males) undertake apprenticeship training through TAFE (Long et al. 1999). Overall, there were 1.4 million enrolments in VET programs in 1997. Participation is characterized by part-time attendance and a wide age range (people aged 15–24 years comprise 38 percent of the clients). Entry to many courses is possible after Year 10, but in practice nearly half of the entrants to vocational courses have completed Year 12. In the early 1980s the corresponding figure was one-fifth. This change has arisen from a combination of labor market conditions and increased school retention rates.
4.2 Apprenticeship
Apprenticeship is an important component of VET. Over 4 years, an apprentice works for an employer (or group of employers) and attends a training institution (traditionally a TAFE institute) part-time (typically a total of 800 hours). Recent changes have been a response to perceived limitations (inflexibility, limited occupations, old technology, and lack of access for women) and declining numbers. In 1985, traineeships were introduced to provide a shorter and more flexible approach to entry-level training. Traineeships, typically involved a one-year program, with an employer incorporating on-the-job and off-the-job training, mostly in office-based and retail industries. More recently, apprenticeships and traineeships have been integrated as part of a more unified entry-level training system.
4.3 Organization
Responsibility for administration of VET lies with the state and territory governments. In 1997, recurrent and operating funding of the TAFE system was about $3,800 million, with the states and territories providing 56 percent and the federal government 25 percent, with the remaining 19 percent coming from fees and other sources. A national vocational education and training system was established in 1992. A ministerial council determines national policy and priorities, strategic directions, funding arrangements, and planning processes for vocational education and training, on the advice of the Australian National Training Authority. State training agencies manage the delivery of VET in a manner consistent with the national strategic plan.
5. Higher Education
Prior to 1990, higher education comprised universities and colleges of advanced education (which placed more emphasis on teaching and less on research). In 1990, formal distinctions between the two types of institution were removed and since then amalgamations stimulated by federal government policy have reduced the number of institutions from around 70 to 36. In addition to the 36 public institutions there are two private universities. Most universities operate under state legislation and are autonomous bodies responsible for their own governance, allocation of funds, staffing, and academic courses.
5.1 Students
Students commencing higher education courses are required to complete secondary school, or otherwise demonstrate a capacity to complete a course. There is keen demand for higher education places at most institutions. In 1997, there were nearly 660,000 students enrolled in universities with slightly fewer than 500,000 enrolled in undergraduate courses. The basic undergraduate course is a bachelor degree of three or four years’ duration, and these enroll 75 percent of all students. The fields of study with the largest numbers of students are: the arts, humanities, and social sciences (23 percent); business, administration, and economics (23 percent), and science (15 percent) (DEETYA 1997). Approximately half of the students who complete secondary school proceed to university by the age of 19, this being approximately 38 percent of each cohort. In 1997, a little more than half (54 percent) of university students were female, a figure that has risen steadily over the 1980s and 1990s. Despite the expansion of higher education during the 1980s, university students are still drawn disproportionately from those with managerial and professional home backgrounds (Long et al. 1999). In 1997, approximately 60 percent of students were enrolled in full-time study, 27 percent in part-time study and the remainder in external studies.
5.2 Organization And Funding
The federal government funds universities. In 1996, the operating revenue of universities amounted to just over A$8,000 million, 57 percent of which came from federal government grants. In addition to government funding, institutions receive payments from students who are required to contribute to the cost of their education through the Higher Education Contribution Scheme (a deferred, income-contingent repayment program that operates through the taxation system), and from full fee-paying students.
6. Education At The Turn Of The Millennium
At the beginning of the new millennium (2001), there are a number of issues that will challenge the education systems of Australia. The balance, and funding, of public and private schooling, establishing a new mix of central authority and local responsibility in public school systems, and developing new forms of quality assurance seem likely to continue as important issues in the next few years. So also will questions of securing greater levels of engagement among students in the middle years. Providing resources for an appropriate mix in programs of education and training beyond school has emerged as an issue as the demand for education continues to rise. In senior secondary school and in higher education there will most likely be new initiatives to facilitate the pathways between education and work. In addition the ongoing issues of providing programs for a dispersed, and an increasingly diverse, population will continue.
Bibliography:
- Ainley J, Robinson L, Harvey-Beavis A, Elsworth G, Fleming M 1994 Subject Choice in Years 11 and 12. Australian Council for Educational Research, Melbourne, Vic
- Australian Bureau of Statistics (ABS) 1996 Child Care, Australia (4402.0). ABS, Canberra, NSW
- Australian Bureau of Statistics (ABS) 1998a Expenditure on Education, Australia (5510.0). ABS, Canberra, NSW
- Australian Bureau of Statistics (ABS) 1998b Schools Australia 1997 (4221.0). ABS, Canberra, NSW
- DeLemos M 1994 Schooling for Students with Disabilities. Australian Government Publishing Service, Canberra, NSW
- Department of Employment, Education, Training and Youth Affairs (DEETYA) 1997 Selected Higher Education Student Statistics, 1997. DEETYA, Canberra, NSW
- Department of Employment, Education, Training and Youth Affairs (DEETYA) 1998 Literacy for All: The Challenge for Australian Schools. Australian Government Publishing Service, Canberra, NSW
- Department of Education, Training and Youth Affairs (DETYA) 1999 Education Participation Rates, Australia—1997. DETYA, Canberra, NSW
- Long M, Carpenter P, Hayden M 1999 Participation in Education. Australian Council for Educational Research, Melbourne, Vic
- Masters G, Forster M 1997 Mapping Literacy Achievement: Results of the 1996 National School English Literacy Survey. J S McMillan, Canberra, NSW
- Meredyth D, Russell N, Blackwood L, Thomas J, Wise P 1999 Real Time: Computers, Change and Schooling. J S McMillan, Canberra, NSW
- Ministerial Council on Education, Employment Training and Youth Affairs (MCEETYA) 1994 National Report on Schooling in Australia: 1993. Statistical Annex. Curriculum Corporation, Melbourne, Vic
- Ministerial Council on Education, Employment Training and Youth Affairs (MCEETYA) 1997 National Report on Schooling in Australia: 1997. Curriculum Corporation, Melbourne, Vic
- National Centre for Vocational Educational Research (NCVER) 1998 Australian VET: TAFE Graduate Destination Survey 1997—National Report. NCVER, Adelaide, SA
- Organisation for Economic Co-operation and Development (OECD) From Initial Education to Working Life: Making Transitions Work. OECD, Paris
ORDER HIGH QUALITY CUSTOM PAPER

Always on-time

Plagiarism-Free

100% Confidentiality