
View sample sociology research paper on quantitative methodology. Browse other research paper examples for more inspiration. If you need a thorough research paper written according to all the academic standards, you can always turn to our experienced writers for help. This is how your paper can get an A! Feel free to contact our custom writing service for professional assistance. We offer high-quality assignments for reasonable rates.
History of Sociological Quantification
Quantitative reasoning is widely applied in the discipline of sociology and quantification aids sociologists in at least seven main research areas: quantitative modeling, measurement, sampling, computerization, data analysis, hypothesis testing, and data storage and retrieval. But sociologists differ widely in their views of the role of quantification in sociology. This has apparently always been true to some degree. While Durkheim was a proponent of quantification, Weber was less enthusiastic. However, while Weber advocated the nonquantitative method Verstehen, both Weber and Durkheim saw the importance of method as well as theory, as both authored books on method (Weber 1949; Durkheim [1938] 1964). Today, the situation is much different, as a wide gulf exits between theory and method in twenty-first-century sociology, with only a few authors such as Abell (1971, 2004) and Fararo (1989) simultaneously developing theory and quantitative methodology designed to test theoretical propositions.
Academic Writing, Editing, Proofreading, And Problem Solving Services
Get 10% OFF with 24START discount code
The most vocal proponent of quantification in sociology may have been Lundberg (1939), who was known as the unabashed champion of strict operationalism. Operationalism, as originally defined in physics by Bridgman (1948), is the belief that “in general any concept is nothing more than a set of operations, the concept is synonymous with the corresponding set of operations” (Bridgman 1948:5–6). George Lundberg (1939, 1947) took the application of operationalism in sociology to an extreme. In Lundberg’s view, one did not approach an already existing concept and then attempt to measure it. The correct procedure in Lundberg’s view is to use measurement as a way of defining concepts. Thus, if one is asked what is meant by the concept of authoritarianism, the correct answer would be that authoritarianism is what an authoritarianism scale measures.
When he encountered objections to his advocacy of the use of quantification in sociology, Lundberg (1939, 1947) replied that quantitative concepts are ubiquitous in sociology, and need not even be symbolized by numerals, but can be conveyed verbally as well. For example, words such as “many,” “few,” or “several” connote quantitative concepts. In Lundberg’s view, quantification is embedded in verbal social research as well as in everyday thought and is not just an artificial construct that must be added to the research process by quantitative researchers.
After Lundberg (1939, 1947) and others such as Goode and Hatt (1952) and Lazarsfeld (1954) laid the foundation for quantitative sociology in the 1930s, 1940s, and 1950s, the field surged in the 1960s and 1970s. The 1960s saw increased visibility for quantitative sociology with the publication of books and articles such as Blalock’s (1960) Social Statistics, Kemeny and Snell’s (1962) Mathematical Models in the Social Sciences; White’s (1963) An Anatomy of Kinship; Coleman’s (1964) Introduction to Mathematical Sociology, Foundations of Social Theory; Duncan’s (1966) “Path Analysis: Sociological Examples”; Land’s (1968) “Principles of Path Analysis”; Blalock’s (1969) Theory Construction: From Verbal to Mathematical Formulations; and White’s (1970) Chains of Opportunity.
Quantitative methods became even more visible in the 1970s and 1980s with the publication of a host of mathematical and statistical works, including Abell’s (1971) Model Building in Sociology; Blalock’s (1971) Causal Models in the Social Sciences; Fararo’s (1973) Mathematical Sociology; Fararo’s (1989) Meaning of General Theoretical Sociology; Bailey’s (1974b) “Cluster Analysis”; and Blalock’s (1982) Conceptualization and Measurement in the Social Sciences.
Quantitative Data Collection
Specific quantitative techniques make rigorous assumptions about the kind of data that is suitable for analysis with that technique. This requires careful attention to data collection. For data to meet the assumptions of a quantitative technique, the research process generally entails four distinct steps: hypothesis formulation, questionnaire construction, probability sampling, and data collection.
Hypothesis Formulation
A hypothesis is defined as a proposition designed to be tested in the research project. To achieve testability, all variables in the hypothesis must be clearly stated and must be capable of empirical measurement. Research hypotheses may be univariate, bivariate, or multivariate, and some may contain auxiliary information, such as information about control variables. The vast majority of hypotheses used by quantitative sociologists are bivariate. The classical sequence is to formulate the hypotheses first, before instrument construction, sample design, or data collection. Hypotheses may be inductively derived during prior research (Kemeny and Snell 1962) or may be deductively derived (Bailey 1973). Increasingly, however, quantitative sociologists are turning to the secondary analysis of existing data sets. In such a case, hypothesis formulation can be a somewhat ad hoc process of examining the available data in the data bank or data set and formulating a hypothesis that includes the existing available variables.
For example, Lee (2005) used an existing data set and so was constrained to formulate hypotheses using the available variables. He presented three hypotheses, one of which stated that democracy is not directly related to income inequality (Lee 2005:162). While many quantitative studies in contemporary sociology present lists of formal hypotheses (usually five or less), some studies either leave hypotheses implicit or do not present them at all. For example, Torche (2005) discusses the relationship between mobility and inequality but does not present any formal hypotheses (p. 124).
Questionnaire Construction
In the classical research sequence, the researcher designed a questionnaire that would collect the data necessary for hypotheses testing. Questionnaire construction, as a middle component of the research sequence, is subject to a number of constraints that are not always well recognized. First and foremost is the necessity for the questionnaire to faithfully measure the concepts in the hypotheses. But other constraints are also imposed after questionnaire construction, chiefly sampling constraints, data-collection constraints, and quantitative data-analysis constraints. The questionnaire constrains the sampling design. If the questionnaire is very short and easily administered, this facilitates the use of a complicated sample design.
However, if the questionnaire is complex, then sample size may need to be reduced. The construction of a large and complex questionnaire means that it is difficult and time-consuming to conduct a large number of interviews. It also means that money that could otherwise be spent on the sample design must now be used for interviewer training, interviewing, and codebook construction. In addition to such sampling and data-collection constraints, the chief constraint on instrument design is the type of quantitative technique to be used for data analysis.
That is, the questionnaire must be designed to collect data that meet the statistical assumptions of the quantitative techniques to be used. Questionnaires can quickly become long and complicated. Furthermore, there is a tendency to construct closed-ended questions with not more than seven answer categories. While such nominal or ordinal data are often used in regression analyses, they are marginally inappropriate for ordinary least squares (OLS) regression and other quantitative techniques that assume interval or ratio data. Clearly, one of the great advantages of conducting a secondary analysis of data that has already been collected is that it avoids dealing with the many constraints imposed on the construction of an original datacollection instrument.
Probability Sampling
Many extant quantitative techniques (particularly inductive statistics) can only be used on data collected with a rigorous and sufficiently large probability sample, generally a random sample of some sort. One of the questions most frequently asked of research consultants is, “What is the minimum sample size acceptable for my research project?” Based on the law of large numbers and other considerations, some researchers permit the use of samples as small as 30 cases (Monette, Sullivan, and DeJong 2005:141). There is clearly a trend in the sociological literature toward larger sample sizes, often achieved through the use of the secondary analysis of existing samples and the pooling of multiple samples.
Sociology had few if any research methods books of its own prior to the publication of the volume by Goode and Hatt (1952). Before 1952, sociological researchers relied primarily on psychology research books, such as Jahoda, Deutsch, and Cook (1951), which de-emphasized sampling by relegating it to the appendix. Psychology emphasized the experimental method, with a small number of research subjects (often 15 or less), and de-emphasized surveys. Furthermore, in the mid-twentieth century, it was common for both psychology and sociology to use a “captive audience” sample of students from the researcher’s classes.
The chief research models for sociology before 1952 were psychology and (to a lesser degree) medicine. While psychology routinely used a small sample of subjects in experiments, samples in medical research were often quite small as well. If a researcher is conducting medical research, such as a study of pediatric obsessive compulsive disorder, it may be difficult to obtain more than 8 or 10 cases, as the onset of this syndrome is usually later in life. With psychology and medicine as its chief models before 1952, sample sizes in sociology tended to be small.
Over time, sample sizes in sociology have grown dramatically. The present emphasis is on national samples and multinational comparisons, as sociology moves away from the psychological model and toward the economic model. For example, Hollister (2004:669, table 1) did not collect her own data, but used secondary data with an N of 443, 399 to study hourly wages.
Data Collection
During the period 1950 to 1980 when social psychology was dominant in sociology, data collection was often a matter of using Likert scales of 5–7 categories (see Bailey 1994b) to collect data on concepts such as authoritarianism or alienation from a relatively small sample of persons.
Now that economics is becoming the dominant model (see Davis 2001), there are at least two salient ramifications of this trend. One is that an individual researcher is unlikely to possess the resources (even with a large grant) to collect data on 3,000 or more cases and so must often rely on secondary data, as did Joyner and Kao (2005). Another ramification is that researchers wishing to use these large economic data sets that are relatively prevalent must obviously use a different kind of data, and different quantitative techniques, than researchers did in an earlier era when psychology predominated. The psychological orientation resulted in data collection more conducive to analysis of variance, analysis of covariance, and factor analysis, in addition to multiple regression (OLS). Today things have changed, and the technique of choice for the large economic data sets is logistic regression.
Mathematical Sociology
It is useful to divide the extant quantitative techniques in twenty-first-century sociology into inferential statistics (probability-based techniques with tests of significance) and mathematical models (techniques that lack significance tests and are often nonprobabilistic). Rudner (1966) makes a distinction between method and methodology. Although the two terms are often used interchangeably in sociology and elsewhere, there is an important difference between them. According to Rudner, methods are techniques for gathering data, such as survey research, observation, experimentation, and so on. In contrast, methodologies are criteria for acceptance or rejection of hypotheses. This is a crucial distinction. Some mathematical models lack quantitative techniques for testing hypotheses, as these are not built into the model.
In contrast, inductive statistics, in conjunction with statistical sampling theory, provides a valuable means for sociologists not only to test hypotheses for a given sample but also to judge the efficacy of their inferences to larger populations. Tests of significance used in sociology take many forms, from gamma to chi-square to t-tests, and so on. Whatever the form or level of measurement, significance tests yielding probability, or “p,” values provide not only a way to test hypotheses but also a common element for community with researchers in other disciplines that also use significance tests.
Mathematical sociology has traditionally used methods such as differential and integral calculus (Blalock 1969: 88–109). Differential equations are frequently used to construct dynamic models (e.g., Kemeny and Snell 1962; Blalock 1969). However, one of the problems with mathematical models in sociology (and a problem that is easily glossed over) is that they are sometimes very difficult to apply and test empirically. Kemeny and Snell (1962) state that mathematical models are used to deduce “consequences” from theory, and that these consequences “must be put to the test of experimental verification” (p. 3). Since experimental verification in the strictest sense is relatively rare in sociology, this seems to be an Achilles heel of mathematical sociology.
To verify the predictions by comparing them with the experimental data, Kemeny and Snell (1962) use the statistical test chi-square. That is, the mathematical model proves inadequate for hypothesis testing and must be augmented by a statistical test (p. 62). Kemeny and Snell (1962) then “improve” the model by stating that there may be some subjects to which the model does not apply and “adding the assumption that some 20 per cent of subjects are of this type” (p. 62). Unfortunately, such “model simplification,” achieved by simply excluding a proportion of the population from the analysis, is rather common in quantitative sociology. Yamaguchi (1983) explains his failure to include women in the analysis by writing, “In this paper, I limit my analysis to non-black men to simplify the model” (p. 218).
The dilemma is real. If the sociological phenomenon is too complex, then the mathematical sociologist will not be able to solve all the inherent computational problems, even with a large computer. Fortunately, the future technological advances in computer hardware and software, along with the continued development of new mathematical techniques such as blockmodeling (Doreian, Batagelj, and Ferligoj 2005), ensure a bright future for mathematical sociology. While the challenges of social complexity are real, the rewards for those who can successfully model this complexity with mathematics are great. For additional commentary and references on mathematical sociology in the twenty-first century, see Edling (2002), Iverson (2004), Lewis-Beck, Bryman, and Liao (2004), Meeker and Leik (2000), and Raftery (2005).
Statistical Sociology
While statistical methods extant in sociology can all be classified as probability based, they can be divided into tests of significance (such as gamma) and methods used for explanation (often in terms of the amount of variance explained), prediction, or the establishment of causality. Among these techniques, the most commonly used are multiple correlation, multiple regression, logistic regression, as well as analysis of variance (the dominant method in psychology) or analysis of covariance. Other methods used less frequently by sociologists include cluster analysis, factor analysis, multiple discriminant analysis, canonical correlation, and smallest space analysis (Bailey 1973, 1974a), and latent class analysis (Uggen and Blackstone 2004).
Which statistical technique is appropriate for a given analysis can depend on a number of factors, one of which is the so-called level of measurement of the quantitative data involved. S. S. Stevens (1951) divided data into four distinct levels—nominal, ordinal, interval, and ratio. It is important to stress consistent measurement at all four levels, as lack of attention to consistent measurement across studies in sociology is problematic for the field.
Nominal
The reality is that nominal variables can be very important in both sociological theory and statistics, but unfortunately they have been badly neglected by sociologists and often are created and treated in a haphazard fashion. This is unfortunate because discussions of classification techniques are readily available to sociologists in the form of work on cluster analysis and various classification techniques for forming typologies and taxonomies (McKinney 1966; Bailey 1973, 1994a). Carefully constructed classification schemas can form the foundation for all “higher” levels of measurement. A sociological model lacking adequate nominal categories can be the proverbial house of cards, ready to collapse at any moment.
The nominal level of measurement deals with nonhierarchical categories. Many of the most theoretically important and frequently used sociological variables lie at this level of measurement, including religion, sex, political affiliation, region, and so on. Much of the statistical analyses at the nominal level consist of simple frequency, percentage, and rate analysis (Blalock 1979). However, the chi-square significance test can be used at the nominal level, as can a number of measures of association, such as Tschuprow’s T, V, C, Tau, and Lambda (Blalock 1979:299–325). Sociologists often dislike nominal categorical variables because it is felt that they are merely descriptive variables that do not possess the explanatory and predictive power of continuous variables, such as interval and ratio variables. But more important, nominal (and also ordinal) categorical variables are disliked because they generally do not fit into the classical multiple regression (OLS) models that (until the recent dominance of logistic regression) have been widely used in sociology.
In univariate cases with a large number of categories, or especially in multivariate cases with a large number of variables, and with each containing a large number of categories, the analysis can quickly become very complex, so that one is dealing with dozens if not hundreds of categories. As Blalock (1979) notes, there is often a tendency for researchers to simplify the analysis by dichotomizing variables (p. 327). Unfortunately, such attenuation results in both loss of information and bias.
Another problem with categorical data is that the printed page is limited to two dimensions. Thus, if one has as few as five categorical variables, and wishes to construct a contingency table showing their interrelations, this requires a five-dimensional table, but only two dimensions are available. The customary way to deal with this, even in computer printouts, is to print 10 bivariate tables, often leading to an unmanageable level of complexity.
Ordinal
Nominal and ordinal variables share some similarities and problems. Measures of association such as Spearman’s rs and tests of significance such as the Wilcoxon test are also available for ordinal variables (Blalock 1979). As with nominal variables, ordinal variables cannot be added, subtracted, multiplied, or divided (one cannot add rank 1 to rank 2 to obtain rank 3).
The ordinal level shares with the nominal level the problem of the desire to simplify. Sociologists often wish to reduce the number of ordered categories to simplify the research project, but unfortunately they often conduct this simplification in an ad hoc manner, without any statistical or theoretical guidelines for reducing the number of categories. Again, this leads to problems of attenuation and bias, as noted for the nominal level.
Interval and Ratio
A sea change has occurred in sociology in the last 40 years, as shown later in the review of American Sociological Review (ASR). During the 1950s and 1960s, American sociologists relied primarily on percentage analysis, often using nominal and ordinal measurement. Later in the twentieth century, quantitative researchers stressed the use of interval and ratio variables to meet the assumptions of OLS multiple regression analysis. Now, as seen below, there has been a major shift back to the use of nominal and ordinal variables in logistic regression.
Interval variables are continuous, with “arbitrary” zero points, while ratio variables have absolute or “nonarbitrary” zero points. Theoretically, only ratio variables, and only those found in nonattenuated fashion with a wide range of continuous values, should be used in multiple regression models, either as independent or dependent variables. Although textbooks such as Blalock (1979) say that only interval measurement is needed, in my opinion ratio is preferred and should be used whenever possible (p. 382). In reality, continuous variables are routinely used in regression without testing to see whether they can be considered ratio or only interval.
Furthermore, while such continuous variables may theoretically or potentially have a wide range of values, they often are empirically attenuated, with extremely high and low values (or perhaps even midrange values) occurring infrequently or rarely. Also, attenuated variables that are essentially ordinal, and contain only five values or so, are often used in surveys (e.g., Likert scales). While these Likert variables do not meet the technical requirements of multiple regression, either as dependent or independent variables, they are often used in regression, not only as independent variables but also as dependent variables.
As noted earlier, sociologists have traditionally struggled to meet the requirements of OLS regression, especially when encountering so many nominal and ordinal variables in everyday theory and research. For example, Knoke and Hout (1974) described their dependent variable (party identification) by saying, “The set of final responses may be coded several ways, but we have selected a fivepoint scale with properties close to the interval scaling our analysis requires” (p. 702). While this dependent variable may indeed be “close” to interval, it remains severely attenuated, possessing only five “points” or values compared with the hundreds or even thousands of potential values in some interval variables. In addition to using attenuated ordinal scales in regression (even though they clearly do not meet the assumptions of regression), sociologists often use nominal variables in regression. These are often used as predictors (independent variables) through the technique of “dummy variable analysis” involving binary coding.
As shown later by my review of ASR, the most common statistical technique in contemporary sociology is multiple regression in some form, including OLS and logistic regression. However, many of the variables used in sociology are nominal or ordinal. Those that are interval or ratio are often recoded as ordinal variables during data collection. The result is that between the existence of “naturally occurring” nominal and ordinal variables and the (often unnecessary) attenuation of nominal, ordinal, interval, and ratio variables, the range of empirical variation is greatly attenuated.
A common example is when an income variable with potentially dozens or even hundreds of values is reduced to five or so income categories to make it more manageable during the survey research process (see Bailey 1994b).
While it is true that respondents are often reluctant to provide their exact income, other alternatives to severe category attenuation are available. These include the use of additional categories (up to 24) or even the application of techniques for dealing with missing data. In addition, some common dependent variables, when studied empirically, are found to have small empirical ranges, but the adequacy of correlation and regression is formally assessed in terms of the degree of variance explained. Considering the cumulative effect of variables that are empirically attenuated, added to those variables that are attenuated by sociologists during the course of research, it is not surprising that explained variance levels are often disappointing in sociology.
A generic multiple regression equation for two independent variables is shown in Equation 10.1.
Y = a + b1X1 + b2X2 [10.1]
The model in Equation 10.1 is quite robust and adaptable but should not be abused by using it with severely attenuated data. Although one cannot add additional dependent variables, additional independent variables are easily added. Also, the model can easily be made nonlinear by using multiplicative predictors such as X1X2 or Xn.
Assume that the dependent variable (Y) is annual income, and the predictors are, respectively, age and educational level. One could conduct an OLS regression analysis for a large data set and experience a fairly small degree of attenuation if the data were collected properly and the variables were not attenuated through unnecessary categorization. But now assume that a second regression analysis is computed on Equation 10.1, but this time the dependent variable is whether the person attends college or not, coded 1 or 0, and the independent variables are sex (coded 1 for female and 0 for male) and age (coded 1 for 20 or younger and 0 for 21 or older). Running OLS regression on this will yield very little in terms of explained variance. The analysis can be converted to logistic regression by computing the odds ratio and taking the natural log (logit) to make it linear. The limitations of this model are that little variance exists to be explained and the predictors are inadequate.
Implications
While many of the logistic regressions one sees in the sociological literature have many more predictors, many of these are often dummy variables (ordinal or ratio), and the wisdom of running regression on such data remains debatable. What accounts for the tremendous popularity of logistic regression, when many times the degree of variance explained remains decidedly unimpressive (see the discussion below)? Perhaps logistic regression is now a fad, or perhaps users do not see an adequate alternative. Why do they not just present correlation matrices? Why is regression needed? Perhaps because typologies using nominal variables are said to provide description, correlation is said to provide explanation, and regression is said to provide prediction, with prediction considered to be the highest form of analysis (Blalock 1979).
The implications of the analysis to this point are clear: Sociologists have long struggled to deal with the analytical problems posed by the different levels of measurement, and they continue to do so. While the recent widespread adoption of logistic regression has surely changed the way that sociologists deal with nominal (and to a lesser extent ordinal) variables, for example, it is not clear that the fit between theory and method, or between empirical data and method, has been drastically improved. Changes are still needed, and some recommendations are presented below.
Method and Theory
As previously noted, method and theory have become sharply bifurcated within sociology over the past 40 years. While the ASR once published methods articles, now these articles are routinely segregated into journals, such as Sociological Methodology, Sociological Methods and Research, or the Journal of Mathematical Sociology. Thus, quantitative methods are not only separated from qualitative sociology (which has its own journals such as Qualitative Sociology) but also are separated from sociological theory (with its own American Sociological Association journal, Sociological Theory).
Kemeny and Snell (1962) state that one first inductively derives a theory through observation and empirical research and then uses quantitative models to deduce testable hypotheses from the theory. The procedure suggested by Kemeny and Snell (1962) is a sound one. The obvious problem with successfully using such an integrated theory/method research process in contemporary sociology is that the theory and quantitative methods knowledge segments are so segregated and widely divided that it is increasingly difficult for the individual researcher to have access to all of this separated literature. By segregating sociology into largely verbal theory (Sociological Theory) and quantitative sociology (the Journal of Mathematical Sociology), the process of developing theories and testing them is made more difficult than it should be.
In spite of the wide degree of artificial separation of theory and method in sociology, the quantitative area has changed in a manner that makes it more consistent with the needs of theory. To meet the goal of operationalizing sociological theory, the quantitative method area should minimally provide three main services:
- Quantitative sociology must provide both diachronic (dynamic) models dealing with process and synchronic (cross-sectional) models dealing with structure. Until the last decade or so, statistical sociology provided mainly synchronic or cross-sectional models via OLS. Now many logistic regression models are longitudinal as in event history analysis (Allison 1984).
- The second service that quantitative method (including both statistical sociology and mathematical sociology) must provide is to talk increasingly in terms of actors rather than primarily in terms of equations or variables. While theory talks in terms of action by individuals or groups (agency), quantitative method talks in terms of change in variables (mathematics) or relationships among sets of variables (regression). A good example of the use of actor-oriented dependent variables in logistic regression is provided by Harknett and McLanahan (2004) who predict whether the baby’s mother will take a certain action or not (marry the baby’s father within 30 days).
- Quantitative sociology must do a better job of raising R2s as variance explained in many regression analyses in sociology (whether OLS or logistic regression) remains unacceptably low. A lot of this may be due to attenuation of variables, both dependent and independent. As seen above, some of the attenuation is avoidable, and some unavoidable. Until recently, the dominant regression model was OLS regression, which did a poor job of incorporating nominal and ordinal variables. Logistic regression includes nominal variables aggressively, thus making it more compatible with theory that is replete with such nominal variables and providing a welcome means of bridging the theory-method gap. However, it is unclear that the incorporation of nominal variables (both dependent and independent) in logistic regression has raised the variance explained by any meaningful degree. It is important that we pay more attention to this problem and that we focus on R2 values, not just on p That is, it is likely that there is actually more variance that can be explained empirically, but the techniques in use are not picking it all up. Perhaps sociology has lost sight of whether sociological models fit the data well, which is the primary point of prediction. To say it another way, if logistic regression is used in virtually every analysis in the ASR, it seems obvious that this method will fit the data better in some cases than in others. In the cases where it can be determined that the fit is not good, perhaps an alternative method of analysis should be considered.
Historical Comparisons
Perhaps most sociologists are at least vaguely aware of changes in quantitative techniques that have appeared in the sociological literature in the last 40 years, particularly the shift toward logistic regression. I decided that it would be helpful to illustrate these changes by conducting a review of the ASR over the last 40 years. While a full review of all issues was impossible due to time constraints, it seemed that a partial review would be illuminating. I compared the last full volume of the ASR that was available (2004) with the volumes 40 years before (1964), and 30 years before (1974), as shown in Table 1.
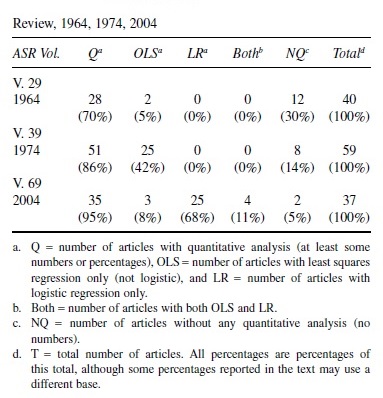
Table 1 shows the presence or absence of quantitative analysis in every article of ASR in 1964 (Volume 29), 1974 (Volume 39), and 2004 (Volume 69). These volumes were not selected by scientific probability sampling but were arbitrarily chosen to reflect changes in quantitative methods. The first year (1964) shows the initial use of regression, 1974 shows the growth of OLS regression, and 2004 (the last full volume available) shows the dominance of regression, both the continuing presence of OLS and the predominance of logistic regression. Presidential addresses were omitted as they tended to be nonquantitative essays. I also omitted research notes, replies, and comments and included only the articles from the main research section of the journal.
The first row of Table 1 analyzes Volume 29 (1964) of ASR. It reveals that 70 percent of all articles (28 out of 40) were quantitative. The remaining 12 were verbal essays without any numbers. An article was counted as quantitative if it had raw scores or means. The predominant numerical method in 1964 was percentage analysis; however, there were two cases of regression analysis. These were OLS analyses with continuous dependent variables, although they were identified only as “regression analysis.” There were no instances of logistic regression. Although regression was soon to dominate sociological statistics, this trend was not yet evident in 1964.
However, by 1974, the trend toward the use of regression was clearly visible. The proportion of the articles that were quantitative in 1974 was 86 percent, up from 70 percent a decade earlier. Although there were still no logistic regression analyses in ASR in 1974 (regression with categorical dependent variables), fully 49 percent of all quantitative articles (and 42 percent of all articles in the entire volume) were OLS regressions showing clear evidence of its upcoming dominance in sociological analysis.
It should be noted that in 1974, many of the OLS regression analyses were presented in the form of “path analysis,” with the “path coefficients” presented in path diagrams. While 70 percent of all ASR articles were quantitative in 1964 and 86 percent in 1974, by 2004 the proportion of quantitative ASR articles had climbed to a startling 95 percent, with logistic regression in some form accounting for the majority of these. Out of a total of 37 articles in Volume 69, only two were entirely verbal, lacking any numerical analysis at all.
Even more startling was the fact that in 2004, out of the 35 quantitative articles in ASR, 32, or 86 percent of all articles in the volume, and 91 percent of all quantitative articles were regressions. Still more surprising, of the 32 articles with regressions, only three had OLS regression only. The remaining 29 had logistic regression, with 25 of these containing logistic regression only, and with four more articles presenting both OLS and logistic regression in the same article. Four additional articles (not shown in Table 1) contained “hybrid” models, which used various combinations of OLS and logged dependent variables, or presented models said to be “equivalent to OLS,” and so on. Of the three quantitative articles that contained no regression, one contained both analysis of variances and analysis of covariance, while the other two contained only percentage analysis.
When logistic regression occurs in 29 out of 35 (83 percent) of quantitative articles and 29 out of 37 total articles (78 percent), it obviously has an amazing degree of dominance for a single technique. In fact, in the last four issues of Volume 29 (Issues 3, 4, 5, and 6), 19 of the total of 20 articles contained logistic regression of some sort (the other article was entirely verbal, with no quantitative analysis of any kind). This means that fully 100 percent of the quantitative articles (and 95 percent of all articles) in the June through December issues of the 2004 ASR (Volume 69) contained at least one logistic regression analysis. This dominance prompts the rhetorical question of whether one can realistically hope to publish in ASR without conducting logistic regression. It appears possible, but the odds are against it. If one wishes to publish in ASR without logistic regression analysis, the article should include OLS regression.
What accounts for the fact that in 2004, 95 percent of all published ASR articles were quantitative, and of these, 83 percent contained at least one logistic regression analysis? Could it be that quantitative sociologists in general are taking over the field of sociology, and sociologists should expect a wave of mathematical sociology articles to be published in ASR? I did not see any publications in Volume 69 containing articles that I would classify as mathematical sociology. I did see two models in 1974 that I would classify as work in mathematical statistics (one stochastic model and one Poisson model), but none in 2004.
Comparing 1974 ASR articles with 2004 ASR articles, we see a sea change toward logistic regression. From the standpoint of quantitative methodology, I can certainly appreciate the heavy reliance that ASR currently has on logistic regression. While casual observers might say that “regression is regression” and that not much has changed in 30 years, in reality nothing could be farther from the truth. The 29 logistic regression analyses presented in Volume 69 of ASR differ from the 25 OLS regression analyses of Volume 39 in a number of important ways. The traditional OLS regression that was dominant in 1974 has the following features:
- It uses a continuous (internal or ratio) dependent variable.
- It uses predominantly continuous independent variables, perhaps with a few dummy variables.
- It uses R2 to evaluate explanatory adequacy in terms of the amount of variance explained.
- It uses about 5 to 10 independent variables.
- It usually reports values of R2 (explained variance) in the range of .20 to .80, with most values being in the intermediate lower part of this range.
In contrast, the logistic regression that dominates twenty-first-century sociology has these features:
- It uses categorical rather than continuous dependent variables (see Tubergen, Maas, and Flap 2004).
- It often uses rather ad hoc procedures for categorizing dependent and independent variables, apparently without knowledge of proper typological procedures (Bailey 1994a) and without regard to the loss of information that such categorization entails, as pointed out by Blalock (1979). Some of these decisions about how categories should be constructed may be theory driven, but many appear to be arbitrary and ad hoc categorizations designed to meet the specifications of a computerized model.
- It logs the dependent variable to “remove undesirable properties,” generally to achieve linearity, and to convert an unlogged skewed distribution to a logged normal distribution, more in keeping with the requirements of regression analysis (see Messner, Baumer, and Rosenfeld 2004).
- It uses more categorical or dummy variables as independent variables, on average, than does OLS regression.
- It uses larger samples.
- It uses more “pooled” data derived through combining different samples or past studies. This has the advantage of getting value from secondary data. While it is good to make use of data stored in data banks, in some cases this practice may raise the question of whether the data set is really the best one or is just used because it is available.
- It uses more models (often three or more) that can be compared in a single article.
- It uses more multilevel analysis.
- It uses more “corrections” of various sorts to correct for inadequacies in the data.
- It often does not report R2 because it is generally recognized to have “undesirable properties” (see Bailey 2004), thereby providing no good way for evaluating the efficiency of the explication in terms of the amount of variance explained.
- It generally reports statistically significant relationships with p values less than .05, and often less than .01, or even .001.
- It presents more longitudinal analysis.
While the trends toward multilevel analysis, longitudinal analysis, and actor orientation are welcome, the plethora of categorical variables and the complexity of the presentations (often spilling over into online appendixes) are of concern. Also, while all computerized statistical programs are vulnerable to abuse, the probability that some of the “canned” logistic regression programs will be used incorrectly seems high due to their complexity. But the chief concern regarding the dominance of logistic regression is that while the recent logistic regressions appear more sophisticated than their traditional OLS counterparts, it is not clear that they have provided enhanced explanatory power in terms of variance explained. In fact, logistic regression in some cases may have lowered the explanatory efficacy of regression, at least when interpreted in terms of explained variance.
The binary coding of dependent and independent variables can obviously lead to extreme attenuation and loss of explanatory power, as noted by Blalock (1979). One of the most undesirable properties of R2 for any dichotomous analysis is that the dichotomous dependent variable is so attenuated that little variance exists to be explained and so R2 is necessarily low. If nothing else, the large number of cases when no R2 of any sort is reported is certainly a matter of concern, as it makes it very difficult to compare the adequacy of OLS regressions with the adequacy of logistic regressions.
In lieu of R2, users of logistic regression generally follow one of three strategies: (1) They do not report any sort of R2 (Hollister 2004:670), relying solely on p values. The p values of logistic regression often are significant due (at least in part) to large sample size, such as Hollister’s (2004:669, sample N of 443,399 in table 1). While large sample sizes may not guarantee significant p values, they make them easier to obtain than with the smaller sample sizes previously used in many traditional sociological studies; (2) they report a “pseudo R2” (see Hagle 2004), such as those reported by McLeod and Kaiser (2004:646) for their table 3, ranging in value from .017 to .112 (the highest reported in the article is .245 in table 5, p. 648); or (3) they report some other R2 term, such as the Nagelkerke R2, as reported by Griffin (2004:551), in his table 4, with values of .065 and .079.
Summary
In the middle of the twentieth century, sociology relied on careful percentage analysis as the backbone of its quantitative methodology, augmented by relatively rudimentary statistics, such as measures of central tendency, correlation coefficients, and tests of significance such as chi-square. Although sociologists were aware of multivariate statistics such as factor analysis and multiple discriminant analysis, the onerous computation that these methods required before computerization limited their use.
With the advent of mainframe computers in the 1960s and 1970s, sociologists could go to their universitycomputing center and run a variety of multivariate statistical analyses. Thus, by 1974, OLS regression became the dominant method. A major problem with OLS regression was that it could accommodate only a single intervaldependent variable, and the independent variables had to be intervally measured as well, except for “dummy” variables. Thus, many important theoretical variables, such as religion, race, gender, and so on, could not be properly accommodated in the dominant regression model.
But by 2004, all had changed. The sea change to logistic regression facilitated the use of multiple regression, as one no longer needed to limit the analysis to interval or ratio dependent variables. Also, the dependent variable could be logged. The advantages of logistic regression are great. These advantages include the facilitation of multilevel analysis (such as use of the individual and country levels) and the ease with which data can be pooled so that many surveys are used and sample sizes are large. Logistic regression makes good use of existing data sets and does a much better job of longitudinal analysis than OLS. Furthermore, the published logistic regressions are replete with categorical variables that were previously missing from OLS regression.
While the advantages of logistic regression are obvious, it may be debatable whether the dominance of this technique indicates that theory and method have merged in an ideal fashion in contemporary sociology. There are several reasons why. First, much sociological theory is not stated in terms of the binary-coded dichotomies favored in logistic regression. While the prediction of dichotomies is certainly theoretically significant in some cases, it would not seem to match the general significance of predicting the full range of values in an interval or ratio variable. That is, why limit the analysis to predicting 1 or 0, when it is possible to predict age from birth to death. Second, since sociological theory is generally not written in terms of logged variables, it is difficult to interpret statistical analysis where the dependent variables are logged to normalize them.
In summary, the logistic regression analyses now dominating provide a number of benefits. These include, among others, advances in longitudinal analysis, in multilevel analysis, in the use of pooled data, in the presentation of more comparative models in each analysis, and in the presentation of more interaction analyses. But logistic regression sometimes appears to relinquish these gains by losing theoretical power when it is unable to provide impressive R2 values. This is due in part to the excessive attenuation resulting from the widespread use of binarycoded dependent variables (often dichotomies).
Prospects for the 21st Century
The future for quantitative sociology will include the continued use of logistic regression. There also will be further developments in blockmodeling and also in longitudinal methods, including event history analysis. There will also be continued interest in multilevel techniques (Guo and Zhao 2000) as well as in agent-based or actor modeling (Macy and Willer 2002). There will also be increased interest in nonlinear analysis (Meeker and Leik 2000; Macy and Willer 2002). In addition, there will be continued advances in regression analysis in such areas as fixed effects regression, including Cox regression (Allison 2005) and spline regression (Marsh and Cormier 2001).
Davis (2001) writes, “In sum, I believe the seeming technical progress of logistic regression (and its cousins) is actually regressive” (p. 111). In another analysis of the logistic regression model, Davis writes,
In short, despite the trappings of modeling, the analysts are not modeling or estimating anything; they are merely making glorified significance tests. Furthermore, these are usually merely wrong or deceptive significance tests because . . . they usually work with such large Ns that virtually anything is significant anyway. (P. 109)
Davis recommends a return to path analysis, in part because it is easier to measure the success or failure of path analysis (p. 110).
Sociologists rely on logistic regression because the variables used are conducive to this technique. Davis (2001) also notes the shift within sociology from using psychology as a model to the present reliance on economics. He writes that in the 1950s psychology was the “alpha animal,” but now economics is a “Colossus” (p. 105). Quantitative researchers have long favored economic variables because they are easier to quantify. Furthermore, inequality research has benefited from the wide availability of economic coefficients such as the Gini (Lee 2005). Nevertheless, sociologists are now more likely to be citing Econometrica or The World Bank Economic Review, and the future influence of economics on sociology seems clear.
While the advantages of logistic regression are clear, there are other methods that deserve consideration as well. It is clear that sociologists will increasingly employ the methods of epidemiology, such as hazard and survival models and Cox regression (Allison 2005), and the methods and data sets of economics. But in addition, sociologists will undoubtedly continue to collect their own data sets while employing the OLS regression and path analysis models. They will also use relatively neglected techniques such as factor analysis, analysis of variance, analysis of covariance, multiple discriminate analysis, canonical correlation, and smallest space analysis.
Bibliography:
- Abell, Peter. 1971. Model Building in Sociology. New York: Schocken Books.
- Abell, Peter. 2004. “Narrative Explanation: An Alternative to Variable Centered Explanation.” Annual Review of Sociology 30:287–310.
- Allison, Paul D. 1984. Event History Analysis: Regression for Longitudinal Event Data. Beverly Hills, CA: Sage.
- Allison, Paul D. 2005. Fixed Effects Regression Methods for Longitudinal Data Using SAS. Cary, NC: SAS.
- Bailey, Kenneth D. 1973. “Monothetic and Polythetic Typologies and Their Relationship to Conceptualization, Measurement, and Scaling.” American Sociological Review 38:18–33.
- Bailey, Kenneth D. 1974a. “Interpreting Smallest Space Analysis.” Sociological Methods and Research 3:3–29.
- Bailey, Kenneth D. 1974b. “Cluster Analysis.” Pp. 59–128 in Sociological Methodology 1975, edited by D. R. Heise. San Francisco, CA: Jossey-Bass.
- Bailey, Kenneth D. 1994a. Typologies and Taxonomies: An Introduction to Classification Techniques. Thousand Oaks, CA: Sage.
- Bailey, Kenneth D. 1994b. Methods of Social Research. 4th ed. New York: Free Press.
- Bailey, Stanley R. 2004. “Group Dominance and the Myth of Racial Democracy: Antiracism Attitudes in Brazil.” American Sociological Review 69:728–47.
- Blalock, Hubert M., Jr. 1960. Social Statistics. New York: McGraw-Hill.
- Blalock, Hubert M., Jr. 1969. Theory Construction: From Verbal to Mathematical Formulations. Englewood Cliffs, NJ: Prentice Hall.
- Blalock, Hubert M., Jr. 1971. Causal Models in the Social Sciences. Chicago, IL: Aldine.
- Blalock, Hubert M., Jr. 1979. Social Statistics. 2d ed. New York: McGraw-Hill.
- Blalock, Hubert M., Jr. 1982. Conceptualization and Measurement in the Social Sciences. Beverly Hills, CA: Sage.
- Bridgman, Percy W. 1948. The Logic of Modern Physics. New York: Macmillan.
- Cole, Stephen, ed. 2001. What’s Wrong with Sociology? New Brunswick, NJ: Transaction.
- Coleman, James S. 1964. Introduction to Mathematical Sociology. New York: Free Press.
- Davis, James A. 2001. “What’s Wrong with Sociology.” Pp. 99–119 in What’s Wrong with Sociology, edited by S. Cole. New Brunswick, NJ: Transaction.
- Doreian, Patrick, Vladimir Batagelj, and Anuska Ferligoj. Generalized Blockmodeling. Cambridge, England: Cambridge University Press.
- Duncan, Otis D. 1966. “Path Analysis: Sociological Examples.” American Journal of Sociology 72:1–16.
- Durkheim, Émile. [1938] 1964. Rules of the Sociological Method. New York: Free Press.
- Edling, Christofer R. 2002. “Mathematics in Sociology.” Annual Review of Sociology 28:197–220.
- Fararo, Thomas J. 1973. Mathematical Sociology: An Introduction to Fundamentals. New York: Wiley.
- Fararo, Thomas J. 1989. The Meaning of General Theoretical Sociology: Tradition and Formalization. Cambridge, England: Cambridge University Press.
- Goode, William J. and Paul K. Hatt. 1952. Methods in Social Research. New York: McGraw-Hill.
- Griffin, Larry J. 2004. “‘Generations and Collective Memory’ Revisited: Race, Region, and Memory of Civil Rights.” American Sociological Review 69:544–57.
- Guo, Guang and Hongxin Zhao. 2000. “Multilevel Modeling for Binary Data.” Annual Review of Sociology 26:441–62.
- Hagle, Timothy M. 2004. “Pseudo R-squared.” Pp. 878–79 in The Sage Encyclopedia of Social Science Research Methods, 3, edited by M. Lewis-Beck, A. E. Bryman, and T. F. Liao. Thousand Oaks, CA: Sage.
- Harknett, Kristen and Sara S. McLanahan. 2004. “Racial and Ethnic Differences in Marriage after the Birth of a Child.” American Sociological Review 69:790–811.
- Hollister, Matissa N. 2004. “Does Firm Size Matter Anymore? The New Economy and Firm Size Wage Effects.” American Sociological Review 69:659–76.
- Iverson, Gudmund R. 2004. “Quantitative Research.” Pp. 896–97 in The Sage Encyclopedia of Social Science Research Methods, 3, edited by M. Lewis-Beck, A. E. Bryman, and T. F Liao. Thousand Oaks, CA: Sage.
- Jahoda, Marie, Morton Deutsch, and Stuart W. Cook. 1951. Research Methods in Social Relations. New York: Holt, Rinehart & Winston.
- Joyner, Kara and Grace Kao. 2005. “Interracial Relationships and the Transition to Adulthood.” American Sociological Review 70:563–81.
- Kemeny, John G. and J. Laurie Snell. 1962. Mathematical Models in the Social Sciences. New York: Blaisdell.
- Knoke, David and Michael Hout. 1974. “Social and Demographic Factors in American Political Party Affiliation, 1952–72.” American Sociological Review 39:700–13.
- Land, Kenneth C. 1968. “Principles of Path Analysis.” Pp. 1–37 in Sociological Methodology 1969, edited by E. F. Borgatta. San Francisco, CA: Jossey-Bass.
- Lazarsfeld, Paul F., ed. 1954. Mathematical Thinking in the Social Sciences. Glencoe, IL: Free Press.
- Lee, Cheol-Sung. 2005. “Income Inequality, Democracy, and Public Sector Size.” American Sociological Review 70:158–81.
- Lewis-Beck, Michael, Alan E. Bryman, and Tim F. Liao. 2004. The Sage Encyclopedia of Social Science Research Methods. Thousand Oaks, CA: Sage.
- Lundberg, George A. 1939. Foundations of Sociology. New York: Macmillan.
- Lundberg, George A. 1947. Can Science Save Us? New York: Longmans, Green.
- Macy, Michael W. and Robert Willer. 2002. “From Factors to Actors: Computational Sociology and Agent-Based Modeling.” Annual Review of Sociology 28:143–66.
- McKinney, John C. 1966. Constructive Typology and Social Theory. New York: Appleton-Century-Crofts.
- McLeod, Jane D. and Karen Kaiser. 2004. “Childhood Emotional and Behavioral Problems and Educational Attainment.” American Sociological Review 69:636–58.
- Marsh, Lawrence C. and David R. Cormier. 2001. Spline Regression Models. Thousand Oaks, CA: Sage.
- Meeker, Barbara F. and Robert K. Leik. 2000. “Mathematical Sociology.” Pp. 1786–92 in Encyclopedia of Sociology, edited by E. F. Borgatta and R. J. V. Montgomery. 2d ed. New York: Macmillan.
- Messner, Steven F., Eric P. Baumer, and Richard Rosenfeld. 2004. “Dimensions of Social Capital and Rates of Criminal Homicide.” American Sociological Review 69:882–903.
- Monette, Duane R., Thomas J. Sullivan, and Cornell R. DeJong. 2005. Applied Social Research. 6th ed. Belmont, CA: Brooks/Cole.
- Raftery, Adrian E. 2005. “Quantitative Research Methods.” Pp. 15–39 in The Sage Handbook of Sociology, edited by C. Calhoun, C. Rojek, and B. Turner. Thousand Oaks, CA: Sage. Rudner, Richard. 1966. The Philosophy of the Social Sciences. Englewood Cliffs, NJ: Prentice Hall.
- Stevens, S. S. 1951. “Mathematics, Measurement, and Psychophysics.” Pp. 1–49 in Handbook of Experimental Psychology, edited by S. S. Stevens. New York: Wiley.
- Torche, Florencia. 2005. “Social Mobility in Chile.” American Sociological Review 70:422–49.
- Tubergen, Frank van, Ineke Maas, and Henk Flap. 2004. “The Economic Incorporation of Immigrants in 18 Western Societies: Origin, Destination, and Community Effects.” American Sociological Review 69:704–27.
- Uggen, Christopher and Amy Blackstone. 2004. “Sexual Harassment as a Gendered Expression of Power.” American Sociological Review 69:64–92.
- Weber, Max. 1949. The Methodology of the Social Sciences. Translated by E. A. Shils and H. A. Finch. Glencoe, IL: Free Press.
- White, Harrison C. 1963. An Anatomy of Kinship: Mathematical Models for Structures of Cumulated Roles. Englewood Cliffs, NJ: Prentice Hall.
- White, Harrison C. 1970. Chains of Opportunity: System Models of Mobility in Organizations. Cambridge, MA: Harvard University Press.
- Yamaguchi, Kazuo. 1983. “Structure of Intergenerational Occupational Mobility; Generality and Specificity in Resources, Channels, and Barriers.” American Journal of Sociology 88:718–45.
ORDER HIGH QUALITY CUSTOM PAPER

Always on-time

Plagiarism-Free

100% Confidentiality