
Sample Population Composition By Race And Ethnicity Research Paper. Browse other research paper examples and check the list of research paper topics for more inspiration. iResearchNet offers academic assignment help for students all over the world: writing from scratch, editing, proofreading, problem solving, from essays to dissertations, from humanities to STEM. We offer full confidentiality, safe payment, originality, and money-back guarantee. Secure your academic success with our risk-free services.
In the three nations of North America—Canada, the United States, and Mexico—ethnicity has different connotations and is officially recorded using a variety of measures. Weber’s (1978) definition of ethnic groups as those that share ‘a subjective belief in their common descent because of similarities of physical type or of customs’ permits various attributes to be used to characterize ethnic boundaries. Not only do these traits vary from place to place, but they change over time as well. In contemporary Mexico, the primary ethnic distinction is between the indigenous and non-indigenous populations. Statistics Canada records national origin, minority and aboriginal status, and religion. Finally, the US Census Bureau solicits race and Hispanic origin, and for a subset of the population, inquires about ethnic ancestry.
Academic Writing, Editing, Proofreading, And Problem Solving Services
Get 10% OFF with 24START discount code
1. Historical Perspective Of North America’s Ethnic Composition
The peopling of North America has been shaped by the presence of indigenous Americans, European colonization, African slavery, voluntary immigration, and for Mexico, considerable emigration. Along with differential fertility and mortality rates, these factors have dramatically transformed the continent’s ethnic landscape over time.
The size of the indigenous population of North America at the time of European colonization is unknown. Estimates for the pre-Contact population of Canada and the US range from 900,000 to 18 million (Snipp 1989), while similar estimates for Mexico range from 4.5 million to 25 million (Alba 1977). Despite the lack of consensus about fifteenth-century population levels, there is widespread agreement that in the wake of European colonization, indigenous depopulation was severe. Although 200,000 Native people were estimated to inhabit Canada when the French began settlement in the early seventeenth century, less than 100,000 remained by 1867 (Anderson and Frideres 1981). In 1548, 6 million indigenous people were estimated to inhabit Mexico, but by 1605, only 1 million remained (Alba 1977). Depopulation estimates for North America as a whole have been put at 1.75 million to 4.75 million between 1500 and 1890 (Snipp 1989).
As Native American population levels dropped, the arrival of Europeans, and to a lesser extent Africans, began a repopulation process that transformed the demography of North America. Until the twentieth century, Canadian immigration would be dominated by the arrival of English and French settlers, while in the US, English colonization followed by German, French, Dutch, Irish, and Scotch–Irish immigration was accompanied by the coercive importation of African slaves. Although Africans were a feature of colonial Mexican society, their shares were extremely small and highly concentrated geographically.
Despite some similarities in their peopling processes, the three nations of North America have experienced distinct immigration trends following the European colonization. In 1870—soon after Confederation and almost 400 years after Christopher Columbus arrived in the Americas—Canada’s population was overwhelmingly European-origin; 61 percent of approximately 3 million claimed roots in the British Isles and 31 percent reported French ancestry (Anderson and Frideres 1981). In contrast, the US population of over 38 million was more ethnically diverse: nearly 13 percent were ‘colored’ (i.e., black) (US Census Office 1883).
Three waves of immigrants diversified Canada’s population during the twentieth century. Around the turn of the century, the European origins of Canadian immigrants changed, but remained overwhelmingly white. From 1896 to 1914, 3 million new immigrants responded to government incentives to settle the western prairie provinces, and the majority were German, Slavic, or Scandinavian. In a second wave from approximately 1946 to 1961, Canada absorbed 2 million newcomers, mainly Europeans who were fleeing the aftermath of World War II. Finally, in the wake of immigration reforms after 1970, the share of European immigrants dropped sharply from 76 per- cent in 1966 to 39 percent in 1973, while arrivals from Asia jumped from 6 percent to 23 percent (Anderson and Frideres 1981).
Like Canada, the volume and national origin composition of US immigration flows has varied over time. In the early years of the republic, the population was largely of English, German, Irish, and African origin. When the legal importation of slaves was halted in 1808, the black population stood at over 16 percent of the total (US Census Bureau 1976). Concurrent and continued immigration for Italians, Russians, Poles, and Scandinavians boosted the white population during the nineteenth and twentieth century. Following the 1965 Amendments to the Immigration and Nationalization Act, immigrants from Asia and Latin America have dominated flows. As a result, the US has become both less white and black than it was at its founding.
Mexico’s demographic evolution has differed in several ways from its neighbors to the north. After the decline of the indigenous population that characterized the early colonization, and the subsequent period of Spanish settlement and African slavery, the Mexican population grew slowly by natural increase, as it was untouched by the large-scale immigration to the US and Canada. From the sixteenth through the seventeenth centuries, admixture between Europeans, Indians, and Africans produced the mestizo population that characterizes Mexico today. Both fertility and mortality rates were high throughout this period, and remained so well into the twentieth century. At the beginning of the nineteenth century, when the colonial period came to a close, Mexico’s total population stood at 6 million—roughly equivalent to the indigenous population prior to colonization (Alba 1977). Mexico’s indigenous population rebounded following a decline between 1900 and 1920 (as did the national population in the wake of the Mexican Revolution, emigration, and an influenza epidemic).
2. Contemporary Population Composition In North America
Recent changes in the ethnic composition of North America derive from three processes, namely immigration, intermarriage across race and ethnic lines, and differential fertility rates of natural increase. Inconsistent reporting categories over time preclude precise estimates of the magnitude and components of change, but general inferences about the relative importance of each are possible. Accordingly, we discuss the contemporary ethnic landscape of Canada, the US, and Mexico and conclude with a broad comparison of the primary axes of ethnoracial differentiation among the three countries.
2.1 Canada
Table 1, which displays Canada’s population composition in 1961 and 1996, reveals both increasing ethnoracial diversification over the 35-year period and also persisting dominance of European ancestries. Despite comparability problems over time, the two most salient differences are the absence of ‘Canadian’ as an ethnic category in 1960, and the allowance for multiple ancestries. In 1996 nearly 18 percent of all residents identified as ‘Canadian’; this figure approaches one in five if the aboriginal population is added. Between 1961 and 1996 the aboriginal population increased its share slightly, but remains a tiny share of the total population. In 1961, virtually all Canadians (97 percent) traced their origins to a European ancestry, and of these, nearly three in four identified as either British or French origin. As recently as 1996, the majority of ethnic Canadians identify with European ancestries; nearly half (48 percent) of all single origin ancestries reported in 1996 were from Europe.
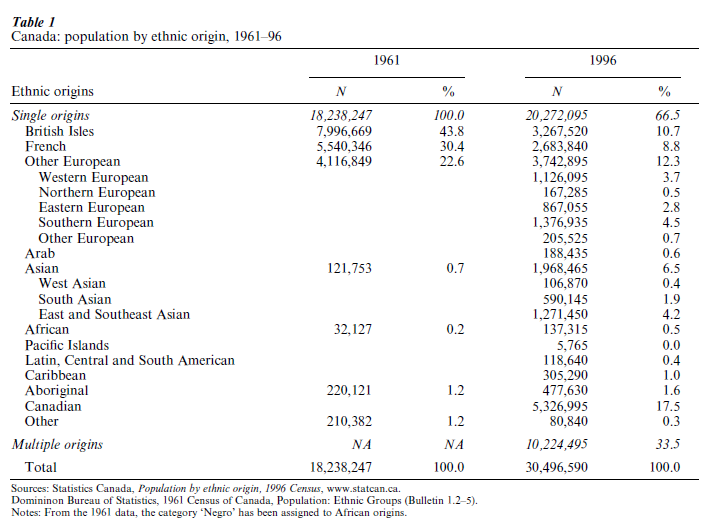
Among Canadians who report a single ancestry, the major change in ethnic composition derives from shifts in the source countries of immigrants. Prior to 1961, fewer than 1 percent of Canadian residents derived from the Middle East, Latin America, or Asia, compared to 19 percent by 1996. Canadian immigration from these regions is relatively recent, which explains their small population shares at the turn of the twenty-first century. Among the million foreign-born Canadian residents admitted before 1961, less than 5 percent were from Asia, Africa, or Latin America. But, as the volume of immigration to Canada increased, so too has the representation of these groups among new arrivals. Should current immigration trends continue, Canada’s ethnic mosaic will be very different in the middle of the twenty-first century. However, the homogenization of Canadians through assimilation and intermarriage may also swell the numbers who identify in nonethnic terms as ‘Canadian.’
2.2 United States
Table 2 presents the ethnoracial composition of the US in 1960 and 1990 based on the last two censuses, and for 1999 based on Current Population Survey estimates. The broad groups are the official categories approved by the Office of Management and Budget. Like Canada, the US racial classification scheme evolved to reflect the rapid growth of the Hispanic population and increasing diversification of Asian populations. Although Hispanics can be of any race, the vast majority is considered white because mestizo has not been an acceptable racial category for administrative reporting purposes. In 1960, the Asian and Pacific Islander category included only Japanese, Chinese, and Filipinos, but when the racial classification was revised and expanded in 1980, Vietnamese, Asian Indians, Samoans, Guamanians, and Hawaiians were added as separate racial groups. In 1990, the US Census identified nearly 1,000 unique racial and ethnic codes, which included nearly 400 American-Indian tribes, hundreds of detailed Asian and Pacific Islander groups, and many more self-identified nationalities.
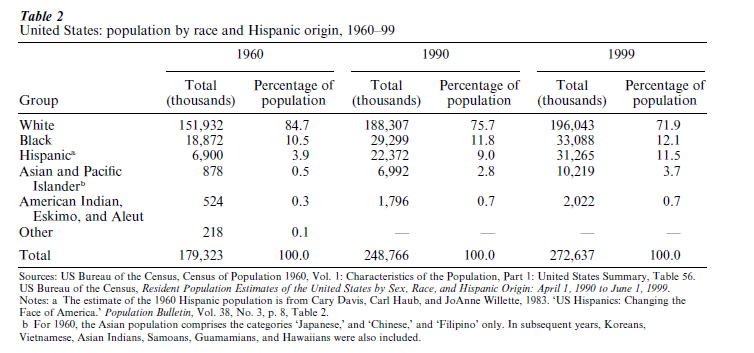
Changes in the US racial classification system notwithstanding, trends in ethnic composition are clear. The white share of the total population has been falling steadily, from 85 percent in 1960 to 76 percent in 1990 and 72 percent in 1999; the black share grew slowly from 10.5 percent in 1960 and remained stable around 12 percent during the 1990s, while Hispanics and Asians increased their population shares. Census projections indicate that the Hispanic population will surpass blacks by 2003 or sooner. Less than 1 percent of the 1960 US population was Asian, but by 1999 Asians comprised almost 4 percent of all US residents—a seven-fold increase since 1960. Although Asians are the fastest growing minority population in the US, their population share remains low for historical reasons, primarily due to laws restricting their admission as immigrants until 1968. Compared to blacks, Hispanics and Asians, the indigenous population of the US remains tiny. In 1960 less than 0.3 percent of the total population consisted of indigenous groups, and by 1990 this share had increased to 0.7 percent. Part of this increase is an artifact of changed reporting criteria that increased incentives and opportunities for individuals of mixed racial origin to self-identify as Native American (Snipp 1989).
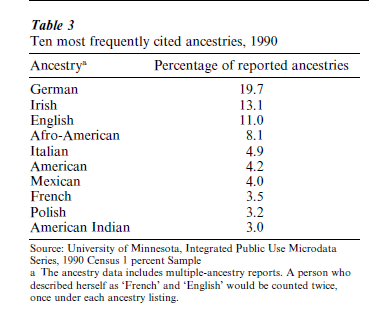
Because the US reports race and ethnic origin separately, ancestry data are instructive about the impact of historical and recent immigration trends on the ethnic landscape. Table 3 reports the 10 most frequently reported ancestries in 1990. Multiple responses are double counted; therefore the white population is more heavily weighted because they tend to report more ancestries (resulting from intermarriage) and because inter-racial marriages are typically rare. Germans, Irish, and English are the top three most frequently reported ancestries, followed by African–Americans and Italians. Only 4.2 percent of the US population identified as ‘American,’ but this figure would be higher if multiple ancestries were not double counted. The prominence of Mexicans among the top 10 ancestries reflects the dramatic growth of this population through immigration since 1960. Between 1970 and 1995, for example, the Mexico-born population of the US increased eight-fold, rising from 750 thousand to 6.2 million. Currently, Mexico is the largest single source of US immigrants.
Census Bureau projections using moderate assumptions about mortality, fertility and intermarriage patterns and current immigration levels indicate that by the year 2020, 65 percent of the US population will be white and 13 percent black. However, the two groups most affected by immigration, Hispanics and Asians, are projected to comprise 16 and 7 percent, respectively, of the total population. This is a marked change from 1960, when Hispanics and Asians combined made up less than 5 percent of the total. In recognition that intermarriage will continue to blur ethnic and racial boundaries, plans for the US Census 2000 will allow Americans to identify themselves using multiple races.
2.3 Mexico
Mexican ethnoracial categories are less differentiated than either Canada or the US mainly because it is a country of emigration rather than immigration. In Mexico the key racial division is between the indigenous and mestizo populations, and use of an indigenous language is the only measure the government now uses to draw this racial distinction. This is because designating members of indigenous groups hinges much more on sociocultural characteristics (like language) than phenotype or precise blood lineages, as practiced in the US.
Table 4 provides a glimpse of Mexico’s indigenous population and its evolution since the turn of the twentieth century. The series reported in Table 4 is not totally consistent because the criteria used to enumerate the indigenous populations at times were restricted by age (5 years and over) and at times combined speakers of indigenous languages who did and did not speak Spanish. In 1990, the majority of the indigenous population spoke over 11 different languages, but Nahutl, Maya, and Zapoteco were the three most commonly spoken. Mexico’s indigenous population is concentrated in the southern and least developed states, with Quintana Roo, Yucatan, Campeche, Chiapas, Oaxaca, Guerrero, Puebla, Hidalgo, and Tlaxcala housing the vast majority of indigenous peoples.
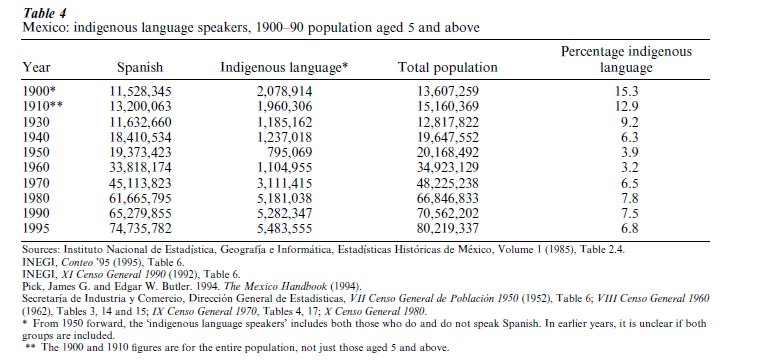
Despite changes in enumeration criteria, the historical record shows a clear decline in the share of indigenous people in Mexico’s population. The indigenous population has grown strongly in absolute terms, but this is due partly to improvements in enumeration and coverage over the period. At the turn of the century, 15 percent of Mexicans were indigenous language speakers but by 1995 this share had been halved. In relative terms, the indigenous population of Mexico is shrinking. Mexico’s declining linguistic diversity is due to social and economic integration of indigenous minorities through internal migration, urbanization, and modernization processes. Further shrinkage of Mexico’s indigenous population is likely in the future, but linguistic diversity is likely to persist much longer than in Canada and the US owing to the larger population base and the persisting rural isolation of many groups.
2.4 Comparative North American Perspective
Canada, the US, and Mexico have some similarities and many differences in the composition and evolution of their ethnoracial landscapes. First, despite rising immigration to Canada and the US from Asia, Africa, and Latin America, both countries have witnessed an increase in the population shares that do not self-identify in ethnic terms, but report themselves as Canadian or American. Second, by comparison to Mexico, Canada and the US have much smaller indigenous populations. Third, unlike the US, Canada and Mexico have negligible shares of residents who trace their ancestries to Africa; owing largely to the legacy of slavery, blacks comprise over 12 percent of US residents. Finally, immigration has diversified the ethnoracial landscape of Canada and the US since the 1960s, but Mexico has witnessed a negligible impact of foreign admissions. As an emigrant country, Mexico’s population composition will be driven by the assimilation of indigenous populations into the national population, a process that is shaped largely by social and economic change, along with internal migration and intermarriage patterns.
Bibliography:
- Alba F 1977 La Poblacion de Mexico: Evolucion y Dilemas. El Colegio de Mexico, Mexico City
- Anderson A B, Frideres J S 1981 Ethnicity in Canada: Theoretical Perspectives. Butterworth & Co, Toronto
- Bean F D, Tienda M 1987 The Hispanic Population of the United States. Russell Sage Foundation, New York
- Davis C, Haub C, Willette J 1983 US Hispanics: Changing the face of the nation. Population Bulletin, Vol. 38, No. 3. Washington, DC: Population Reference Bureau
- Instituto Nacional de Estadıstica, G. e. I. 1996 Conteo de Poblacion y Vivienda 1995: Resultados Definiti os, Tabulados Basicos. Aguascalientes
- Smith J P, Edmonston B (eds.) 1997 New Americans: Economic, Demographic and Fiscal Effects of Immigration. National Academy Press, Washington, DC
- Snipp M C 1989 American Indians: The First of This Land. Russell Sage Foundation, New York
- US Census Office 1883 Compendium of the Tenth Census (June 1, 1880). Washington, DC
- US Census Bureau 1976 The Statistical History of the United States From Colonial Times to the Present. Basic Books, New York, Tables A 1–5 and A 91–104
- Weber M 1978 Economy and Society. University of California Press, Berkeley, CA
ORDER HIGH QUALITY CUSTOM PAPER

Always on-time

Plagiarism-Free

100% Confidentiality