
Sample Momentum Of Population Growth Research Paper. Browse other research paper examples and check the list of research paper topics for more inspiration. iResearchNet offers academic assignment help for students all over the world: writing from scratch, editing, proofreading, problem solving, from essays to dissertations, from humanities to STEM. We offer full confidentiality, safe payment, originality, and money-back guarantee. Secure your academic success with our risk-free services.
The momentum of population growth refers to the tendency of continued growth of a population with a history of high fertility after its fertility has fallen to replacement level. A population with sustained high fertility is growing in size and has a ‘young’ age distribution, that is it has a high proportion of young people. If such a population adopts replacement-level fertility, the population continues to grow before its size stabilizes. The eventual population is a stationary population, i.e., one whose size and age distribution remain constant over time. This ultimate stationary population has an older age distribution than the initial population, and its size is larger. The ratio of the eventual population to the pretransition population size is defined as the momentum of population growth.
Academic Writing, Editing, Proofreading, And Problem Solving Services
Get 10% OFF with 24START discount code
1. Momentum Under Specific Assumptions
In a seminal paper, Keyfitz (1971) presented a simple mathematical expression for the population momentum under specific assumptions. Keyfitz assumed that the initial population has a stable age distribution, and that its fertility falls instantaneously to replacement-level fertility. The drop in fertility level is assumed to occur proportionately at all ages so that the age pattern of fertility remains unchanged. Mortality is assumed to be constant at all times. Under these assumptions, the population momentum M can be expressed as
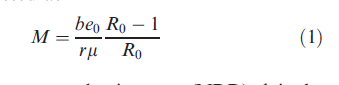
where R0 is the net reproduction rate (NRR), b is the birth rate, and r is the growth rate, all of the initial stable population, e0 is the expectation of life at birth and m is the mean age at childbearing in the stationary population, i.e., the mean of the net maternity function. Equation (1) provides a simple, closed-form expression that permits calculation of an exact population momentum from a few known summary measures of the initial stable population. This avoids the need to project the initial population for a long time until it stabilizes at zero growth as was done by Frejka (1973).
In observed populations, each of the four assumptions is rarely satisfied, and the resultant momentum will be larger, due mainly to delayed fertility transition and to decline in mortality. The Keyfitz momentum M in Eqn. (1) can then be considered as a lower bound of the extent of future population growth. The formula has been used widely, and it has been shown that initial populations with high growth rates produce a substantial population momentum, frequently around 1.6. That is, the initial population grows by 60 percent before its size stabilizes at a constant value even when the most optimistic fertility reduction scenario is assumed.
2. The Anatomy Of Population Momentum
The continuation of population growth after an instantaneous drop in fertility to replacement level is due to the large number of women at childbearing ages in the initial population. To understand what ‘causes’ the growth of a population after a fertility drop, the population momentum can be written as a product of two ratios: (a) the ratio of the numbers of births in the ultimate to the initial population, and (b) the ratio of ultimate to initial population size when both have the same number of births. The first factor is the stable-equivalent number of births, and its value is approximately equal to 1/√R0, a value less than one for an initially growing population. The second factor is given by be0, and is approximately equal to R0. Since the product of the two ratios yields the population momentum, the population grows approximately by a factor of 1/√R0 if the pretransition population had an NRR of R0 (Frauenthal 1975, Kim et al. 1991). Thus the growth of the population is due entirely to the eventual old age distribution relative to the initial young age distribution, but is not due to the larger number of births after the fertility drop. The number of births drops when fertility rates drop in spite of the large number of young people in the initial population.
Preston (1986) showed that when fertility drops to replacement level, the population segment below some age near the mean age at childbearing remains virtually constant, so that all of the growth is confined to the population segment above that age, typically around 28. Inspired by this insight, Kim et al. (1991) examined the anatomy of the population momentum in detail. It was shown that the momentum of any observed population is given as the ratio of the proportion of the observed population under the mean age at childbearing to the proportion of its life table population under that age. Thus, the younger the initial population, the larger is the momentum.
The age-specific momentum for broad segments of a population was also presented. Approximately, (a) the momentum for the segment of a population below age 30 is 1, that is the under-30 population size remains constant, confirming Preston’s (1986) result; (b) the momentum for age group 30 to 60 is R0; and (c) the momentum for the group above age 60 is R2. The exact age below which the population size remains constant can be determined exactly (Kim et al. 1991, Kim and Schoen 1993), but age 30 works well for all practical purposes. To illustrate the age- specific momentum graphically, the trajectory of population segments in five-year age groups after the immediate fertility drop is shown in Fig. 1a (initial R0=2.9 in this example). The number of births (here represented by the population size of ages under five) initially drops when fertility falls, then recovers somewhat before it stabilizes at a new level, which is lower than the original level. In this process, the population segment under age 30 (below the lower solid line) remains virtually constant except for a small fluctuation around time 30, which is when the smaller birth cohorts born right after the fertility drop reach that age. The total population growth of some 60 percent after the fertility drop is due entirely to the increase in the population segment above age 30.
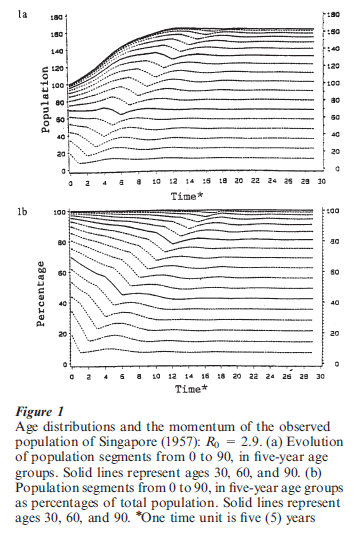
Because the total population growth was contributed solely by the population above age 30 while the population under age 30 remains fixed in size, the population momentum and population aging occur simultaneously. The aging process of the population is shown clearly in the percent age distribution of Fig. 1b. The proportion under age 30 makes up 70 percent of the initial population but it decreases to a little over 40 percent in the eventual population, while the population above age 60 increases from a mere 4 percent to almost 20 percent, showing a substantial degree of aging of the population. The results described here hold for any initial population that is not stable, as well as for initially stable populations.
3. Population Momentum And Population Aging
Population momentum and population aging during the transition to stationarity are two aspects of the same phenomenon. The population momentum expresses population aging, and vice versa. The two quantities are separate aspects of the long-term change in size and age structure that results from a reduction in fertility to replacement level.
To make the relationship between the dual consequences of fertility decline—population momentum and population aging—more specific, three measures of aging were considered (Kim and Schoen 1997). They are: (a) the increase in the mean age of population (DA), (b) the relative size of the proportion under age 30 (F30), and (c) the relative size of the proportion above age 65 (F65+). The first measure, DA, is defined as the increase in mean age of the eventual stationary population from that of the initial population. The second measure, F30, is defined as the ratio of the population under age 30 in the initial population to that in the ultimate stationary population, and the third measure, F65+, is defined as the ratio of the proportion over age 65 in the initial population to that in the ultimate stationary population.
The three measures of aging are highly correlated with each other and with the population momentum, for these four quantities are linear functions of the intrinsic growth rate, r, of the initial population. The theoretical linear relationships as well as some empirical results are presented in Kim and Schoen (1997). For empirical relationships, two data sets are used. The first is a set of Coale-Demeny West model stable populations that includes 39 stable populations with the intrinsic growth rate r ranging from -0.01 to 0.05 in increments of 0.005 at three mortality levels (e0 values of 60, 70, and 80). The second data set is comprised of 41 observed populations in 1985 (Keyfitz and Flieger 1990).
Figure 2 presents the empirical two-way scatterplots for the momentum, M, and each of the three aging measures generated by the first data set. The first plot (from left to right) shows the relationship between M and DA, the second M’s relationship with F30, and the third with F65+. The momentum–mean age linear fit is quite good, and the estimated slope (as well as the theoretical value) suggests that the mean age of the population increases by a little more than two years for every 10 percent increase in population momentum. The middle plot shows that the relative size of the proportions under age 30 is not only linear, but is identical to the momentum. This is a direct consequence of the fact that the population size under age 30 remains constant before and after the transition, as discussed in Sect. 2. The third plot presents the relationship between the momentum and the relative size of the proportion above age 65. The fit is not as good as with the other two measures. The theoretical exposition reveals that, for this measure, the contribution from the quadratic term is not negligible, and that the coefficient of the linear term is affected by mortality levels, especially at the high end of the initial growth rate.
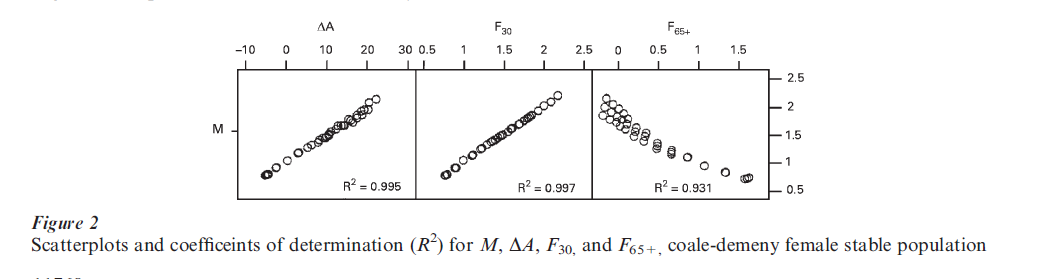
Thus, although the proportion over age 65 has great appeal as a conventional index of aging, it performs the poorest among the three measures of aging considered. The increase in the mean age of the population is simple and performs well, both theoretically and empirically. However, the ratio of the proportion under age 30 in the initial population to that in the ultimate population gives the population momentum directly.
As Fig. 2 illustrates, these linear relationships hold for negative momentum of population decline as well as for positive momentum of population growth. An initial stationary population with r=0 bridges the negative and positive momentum seamlessly.
4. Momentum Under Gradual Decline Of Fertility
A population’s growth potential is significantly underestimated when fertility is assumed to drop instantaneously to replacement level because no population can achieve such an abrupt fertility reduction. If fertility declines gradually over time, the resultant momentum is larger.
If an immediate fertility reduction is adopted by cohorts, the period NRR declines gradually (Frauenthal 1975). Suppose that cohorts born before time 0 maintain the old fertility level at a NRR of R0, while all cohorts born after time 0 reproduce at replacement-level fertility. Then the time trajectory of the period NRR resembles a declining logistic curve that begins to decline at time 15 (the beginning age of childbearing), and decreases to 1 at time 45 (the maximum age at childbearing). The extra momentum generated by this delayed fertility transition is R0. Thus the eventual population momentum under the assumption of a sudden drop in cohort fertility is given by Mc=M • R0.
Gradual fertility declines in period fertility have also been examined. Schoen and Kim (1998) consider a linear decline in the growth rate of births to 0 in a given period, during which the number of births grows to a higher level. In this case, NRR reaches replacement level a generation after the number births stabilizes, and the time path of NRR decline is a smooth curve also resembling a declining logistic function. Li and Tuljapurkar (1999) consider a linear path of NRR decline, and derive the exact momen- tum when the duration of fertility transition is short (e.g., less than 15 years), then show numerically that it is a good approximation for as long as 40 years.
The two formulations give consistent results. The extra momentum increases exponentially as the duration of the fertility transition increases. More specifically, if the period NRR declines monotonically to replacement level over a duration, D, the extra momentum is larger by a factor eDr/2 ≈ (√R0) D/m (Schoen and Kim 1998). This is consistent with intuition: it can be interpreted as the growth at half the original growth rate during the given period, or as the growth at the original growth rate for half the duration. Therefore the eventual population
Thus the momentum generated by a gradual period fertility transition over 30 years is approximately equal to R , equally contributed (multiplicatively) by the age distribution and the delayed fertility transition. The momentum under the sudden cohort fertility transition can also be explained in this vein. The extra population momentum, shown to be R0, is contributed equally by the growth during the first 15 years at the original growth rate, and during the next 30 years with declining period fertility. The growth generated by a sudden cohort fertility transition that takes 45 years is equivalent to that of a gradual period fertility transition over 60 years.
The extra momentum generated by delayed transition is not sensitive to variations in the time path of fertility decline. A comparison of the momentum generated by a linear decline in the period NRR and that generated by the logistically declining paths (produced by the scenarios of Frauenthal 1975 and of Schoen and Kim 1998) shows that the difference is small (Li and Tuljapurkar 1999). The extra momentum is determined mainly by the number of years a population needs to complete a smooth fertility transition.
5. Future Population Growth
In practice, future population growth is determined by improvements in mortality and the pattern and extent of migration, as well as by the future trends in fertility decline and by the current age distribution. The population growth that results from urbanization of a highly rural population in which the rural sector has higher fertility than in the urban sector is called spatial momentum (Rogers and Willekens 1978, Schoen and Kim 1993). Modern projection prediction studies show that as the world’s populations complete demographic transitions, the momentum inherent in the current young age distribution is the major component of future population growth in most developing countries (Bongaarts and Bulatao 1999). The other components of population growth—the spatial momentum, and the growth due to changes in fertility and mortality—under realistic assumptions is shown to be less than the age momentum (Bongaarts and Bulatao 1999, Brockerhoff 1999). Thus the growth associated with the young current age distribution in developing countries will be the major contributor to the future growth of the world population.
Bibliography:
- Bongaarts J, Bulatao R A 1999 Completing the demographic transition. Population and Development Review 25: 515–29
- Brockerhoff M 1999 Urban growth in developing countries: A review of projections and predictions. Population and Development Review 25: 757–78
- Frauenthal J 1975 Birth trajectory under changing fertility conditions. Demography 12: 447–54
- Frejka T 1973 The Future of Population Growth: Alternative Paths to Equilibrium. Population Council, New York
- Keyfitz N 1971 On the momentum of population growth. Demography 8: 71–80
- Keyfitz N, Flieger W 1990 World Population Growth and Aging. University of Chicago Press, Chicago
- Kim Y J, Schoen R 1993 Crossovers that link populations with the same vital rates. Mathematical Population Studies 4: 1–19
- Kim Y J, Schoen R 1997 Population momentum expresses population aging. Demography 34: 421–7
- Kim Y J, Schoen R, Sarma P 1991 Momentum and the grow-thfree segment of a population. Demography 28: 159
- Li N, Tuljapurkar S 1999 Population momentum for gradual demographic transitions. Population Studies 53: 255–62
- Preston S 1986 The relation between actual and intrinsic growth rates. Population Studies 40: 343–51
- Rogers A, Willekens F 1978 The spatial reproductive value and the spatial momentum of zero population growth. Environment and Planning, Series A 10: 503–18
- Schoen R, Kim Y J 1993 Two-state spatial dynamics in the absence of age. Theoretical Population Biology 44: 67–79
- Schoen R, Kim Y J 1998 Momentum under a gradual approach to zero growth. Population Studies 52: 295–9
ORDER HIGH QUALITY CUSTOM PAPER

Always on-time

Plagiarism-Free

100% Confidentiality