
Sample Psychometrics Research Paper. Browse other research paper examples and check the list of research paper topics for more inspiration. If you need a religion research paper written according to all the academic standards, you can always turn to our experienced writers for help. This is how your paper can get an A! Feel free to contact our research paper writing service for professional assistance. We offer high-quality assignments for reasonable rates.
Modern test theory makes free use of the idea of a latent variable to explain answer choices in each test item. A latent trait can be transformed by any smooth order-preserving function, and thus does not have the measurement structure that is often mistakenly attributed to it. The notion of a manifold is used to explain this one-dimensional structure. This manifold is not a latent variable, however, and arc length or distance along this manifold from a fixed point is a measure of ability or trait level that is manifest. This arc length measure is suggested as an alternative to latent trait values in order to avoid the confusion that the idea of a latent trait often causes.
Academic Writing, Editing, Proofreading, And Problem Solving Services
Get 10% OFF with 24START discount code
1. Introduction
Terms like ‘psychometrics’ are constantly-moving targets for one seeking a definition, but some frequently encountered features of psychometric data are indicated in the next section. But many readers will think of test scores as prototypical data. What characteristics of the people taking tests do test scores and the data that are used to compute them reflect? Test scores are numbers, but not all the structure of numbers are meaningful representations of something about examinees. Section 3 considers how test scores define nearness or proximity of examinees, and the status of the algebraic operations of summing and differencing. Section 4 relates the psychological concept of a trait to the mathematical notion of a curve in high-dimensional space or a manifold, and considers arc length along this curve as a type of measurement.
2. Definitions And Common Themes
According to one popular dictionary, psychometrics means ‘mental measurement.’ But we need a better definition, since the status of both mind and measurement as concepts are no longer as unequivocal as they were are the beginning of the twentieth century. This research paper considers as psychometric most quantitative models for the behavior of humans and other animals that is controlled by the central nervous system.
Defined as broadly as this, it may seem surprising that there are any themes that seem to be common to psychometric research. Nonetheless, there are a few, and they may be motivated by the following questions:
What variables should be observed? In the natural sciences, where seven constants are said to define the universe, which variables to observe is seldom an issue. But in behavioral research, variables are made to measure by researchers, often in the form of tests or scales developed to reflect vaguely defined concepts such as ‘depression’ or ‘ability.’ For any popular concept, there are likely to be dozens and even hundreds of such measures available.
What does a variable value mean as a measure? That is, what information can be considered useful in a set of test scores, response times, or other observations, and what can be considered irrelevant? Stevens (1946) proposed a classification into nominal, ordinal, interval, and ratio scales according to the amount of algebraic structure usable in the data. Viewing test scores as nominal scales only treats numbers as labels for examinees. Ordinal scales represent their order structure or ranking. Interval scales also reflect a stable property of the examinees in the ratio of differences, and ratios of scores are meaningful for ratio scales. But so many writers have criticized this system as inadequate that this issue needs revisiting here, at least briefly.
How many variables should be observed? Judging by research reported in widely read journals, a great number. Because it is difficult to decide which measure of, say, intelligence to use, researchers tend to use several, hoping to cover the ground and perhaps to head off complaints from supporters of particular measures. Moreover, access to replicates, usually people, is often expensive and may involve ideological and political sensitivities. Consequently, psychometric data are often high dimensional, especially relative to sample sizes typically used. Researchers may hope that they can compensate for limited sample sizes by observing more variables; but this belief is both naive and dangerous.
Is there some simple low-dimensional structure in the high-dimensional data? Often a one-dimensional structure is assumed, as when choices on tens or even hundreds of test items are reduced to a single test score, but in other cases special psychometric technology is applied to data to reveal both the low dimensionality implicit in the data, and how the data are approximated within this low-dimensional structure. Principal components or factor analysis is, therefore, a standard tool in behavioral research.
3. What Does A Psychometric Measurement Mean?
It is fair to say that most researchers don’t concern themselves with this question, but it is a hard issue to avoid, since sooner or later numbers are interpreted, and usually by people whose limited exposure to these issues makes them vulnerable to misinterpretation of the results. Is a change in score from 10 to 5 on a depression scale as important as one from 30 to 25? Probably not, but is there at least some useful information in score changes such as these?
A psychometric measurement system is a mapping from a set of people into some system of numbers. It has a purpose, namely to use some of the structural characteristics of numbers to reflect or represent analogous characteristics of people. For example, assigning a social security number just distinguishes one person from another, but assigning a test score tends to mean much more, and at least is intended to reflect an order relation presumed to hold among people. But numbers, and especially real numbers, are structured in many different ways, and the question is; which of these ways should be considered as reflective of characteristics of people, and which should be ignored?
Mathematics, at least as an applied science, is the study of structured sets. By sets, of course, we mean collections of people, drawn from some population X, including the set of nobody, which we indicate by Ø. Sets A and B can be combined in two ways: unions A ∩ B, meaning the people who belong to either A, B, or both; and intersections A U B, meaning only the people who belong to both.
There are three main types of structure that preoccupy mathematicians:
(a) topological: structure that defines nearness or neighborhoods,
(b) measure or probability: structure that defines size, and
(c) algebraic: rules for connecting two or more elements, that is, identifying certain pairs, triples, etc.
These structures are increasing in level of organization, with topological being in a sense minimal, and algebraic being the most sophisticated.
We shall have a look at topological structure because it seems important in explaining why test scores are so widely accepted as psychometric variables, and is an aspect of measurement that Stevens and other writes have neglected. But measure and algebraic structure are left for others to others to deal with. Test scores are by and large accepted by both ordinary citizens and researchers as useful summaries of human behavior. Why this is so, in spite of their murky status among philosophers, mathematicians, and statisticians, probably derives from their topological structure and its relation to analogous properties of behavior that seem to us reasonable.
Topology has a bad reputation for being abstruse, but it deals with a type of structure corresponding to intuitions rooted in experience. Topology is about nearness or neighborhoods defined within a population X of people. One may also think of the topology of X as its texture, and in these remarks we will consider whether test scores have gained their accepted
place in most cultures because they reflect assumptions of a textural nature about how people vary.
A topology is a family T of subsets drawn from a set X such that:
(a) both nobody Ø and everybody X belong to T;
(b) the union of no matter how many sets in T is also in T; and
(c) the intersection of a finite number of sets in T is also in T.
Sets in T are called open, and any open set containing a specified person is called a neighborhood for that person. For example, a person’s neighborhood can be defined as those other persons sharing the same postal code, or having gone to the same university, or inhabiting the same dwelling, or of the same age, or any combination of these characteristics. Or, in this context, as those who have been assigned the same score on a test. The second part of the definition of a topology ensures that neighborhoods can be expanded as far as needed, even to include everybody, and the third says that neighborhoods can be shrunk, but only a finite number of times. What happens when we expand and shrink neighborhoods is the essential practical issue that the topological structure seeks to address.
Since the topology of test scores may reflect something of the topology of the people assigned the scores, let’s switch to considering the topology of test scores, and ask whether this reasonably captures something about the population to which they are assigned. Because test scores are real numbers, an open set is defined as the set of test scores between two limits, and this topology is of a specialized variety called metric. Of course, test scores also define a topology of the examinees that have taken them, since we can define an open set of examinees as one containing all examinees whose test scores are within specified limits.
Figure 1 illustrates examinee neighborhoods for a score of 2 on a 50-item test, with the neighborhoods being defined by three different test-scoring strategies. The test is simulated, but this does not matter. Nor does it matter that we have chosen the relatively extreme score of 2; neighborhoods for more average scores will show the same features as shown in these three plots, but with less compelling graphics.
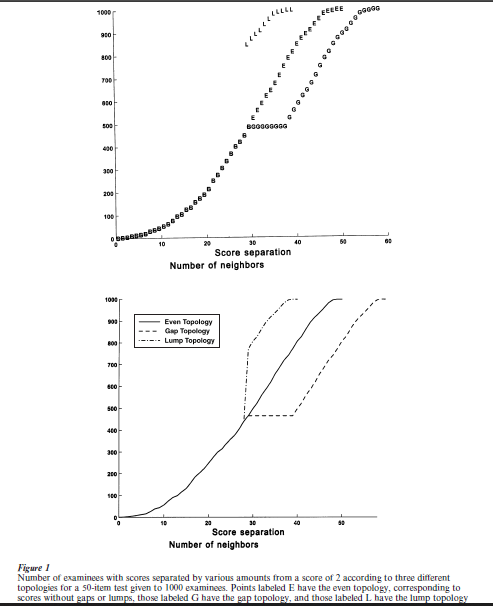
The points labeled E display what can be called an even topology on examinees. They indicate the number of examinees among 1000 whose scores differ from 2 by varying amounts. Each score separation value therefore defines a neighborhood. Everybody is, for example, no more than 48 points from 2, and the size of these neighborhoods shrinks smoothly as we reduce the score separation, until we see that only a few people are less than 5 points away from 2. We call this an even topology because neighborhoods shrink smoothly.
Suppose, now, we arbitrarily add 10 to all scores of 30 or above. This doesn’t change the order of the scores, but it certainly changes the neighborhoods. The points labeled G show that neighborhood size fails to shrink for score separations between 28 and 38 because of the gap in the scores. This is a gap topology. If the population being scored had such a gap, it would mean that there would be nobody capable of producing a set of choices on items corresponding to a test score between 30 and 40.
Or, alternatively, let us combine all scores between 30 and 40 into 30, and subtract 10 from all scores above 40. The neighborhood plot is shown as points labeled L, and we see that neighborhood size shrinks abruptly for score separations above 28 with respect to a score of 2. This is a lump topology because, put in people terms, there is a large group of examinees who will necessarily produce identical scores. Do people lump up in this way with respect to their behavior? Perhaps sometimes, but mostly not.
Both the gap and lump topologies that are shown in Fig. 1 are defined by test-scoring methods that preserve the order of test scores, but most of us would not be happy attributing either of these textures to subsets of people. We like to imagine that people are evenly distributed in the sense that (a) if we observe enough behavior, only a very small number of people will display identical behavior, and (b) nevertheless all behavior patterns are potentially exhibited by some- one. This is the sense in which the even topology determined by most test scoring methods defines a texture for the population that has neither gaps nor lumps, and tends to correspond to intuitions that we have about how performance on a test is related to the ability that it is supposed to reflect.
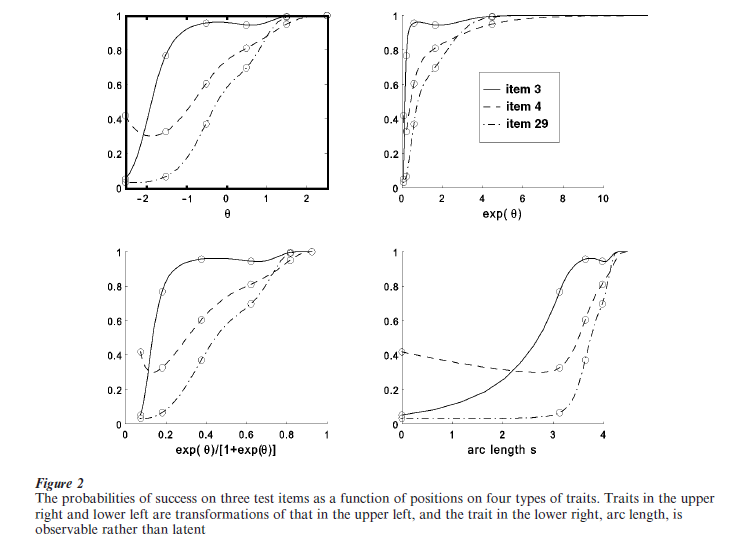
A transformation that leaves topology unchanged is called continuous, a term that we may roughly trans- late into smooth. If there are no gaps or lumps, then, for example, substituting y = exp(x) or z= exp(x)/[1 + exp(x)] for score x will not introduce lumps or gaps, whereas the two transformations indicated above will, and are clearly not smooth.
Stevens’ ordinal scale is, then, too simple. It says too little about the texture of either the data or the population generating the data, and something like the concept of an even topology is needed to explain why those who work with test scores are clearly so comfortable with them as descriptions of the behavior of people.
4. Latent Traits And Manifolds
Few who have worked with colleagues in departments of psychology or faculties of education, or taught statistics to students in these places, will quarrel with the statement that finding low-dimensional structure in high-dimensional data is perhaps the central statistical challenge in these fields. Consequently, statistical procedures such as stepwise regression, principal components analysis, and structural equation modeling are essential in most contemporary research, and new methods for this problem appear regularly in our methodology journals.
The latent trait is one way to motivate the concept of a low dimensional structure. Test and scale designers often appeal to constructs such as ‘proficiency,’ ‘intelligence,’ and ‘creativity’ in describing what scores on their instruments mean, and freely appeal to a conceptual link between usually unidimensional test scores and these constructs. Of course, it is only test scores, and the choices that generate them, that we can actually observe, and so these constructs are said to be latent or unobservable variables whose structure is reflected in these test scores. Similarly, early factor analysts liked to refer to collections of such latent traits that generate the observed tendency for rather large number of test scores to exhibit low dimensional correlational structure. The five variables in the NEO Personality Inventory, introversion, agreeableness, conscientiousness, neuroticism, and openness, (Costa and McCrae 1985) used in personality research are one of the more successful outcomes of this type of thinking.
Figure 2 displays three item characteristic curves for an actual test, these being defined as the relation between the probability Pi(θ) of getting test item I correct to one’s position along a one-dimensional continuum θ. Continuum θ is not observed, but rather inferred from the data. These three curves were estimated by a nonparametric technique described in Ramsay (1991). Probabilities of success on these three items are displayed as functions of four different types of continuum: the first extending over the whole real line; the second containing only nonnegative numbers; the third within the unit interval [0,1]; and the fourth to be explained below. Now, since we are not actually observing θ, there is no deep reason for preferring one of these continua over the others, so that the transformations taking us from one to any other are all legitimate modifications of this model. What are not arbitrary, however, are the probability values Pi(θ) themselves. These are anchored in the data, and must conform to actual proportions of success for groups of people who have neighboring values of θ or, since smooth transformations preserve topology, neighboring values of either a transformation of θ, or of test scores themselves.
Consequently, the upper panel of Fig. 3 shows what is invariant with respect to transformations of θ. By plotting probabilities against each other, we see that probabilities of success migrate smoothly within the unit cube. The sinuous curve that this figure displays also has the even topology in the sense that it has no gaps or lumps. In this plot, the role of θ or any of its transformations has disappeared, except of course, for its topology, since the curve has inherited the even topology of real numbers.
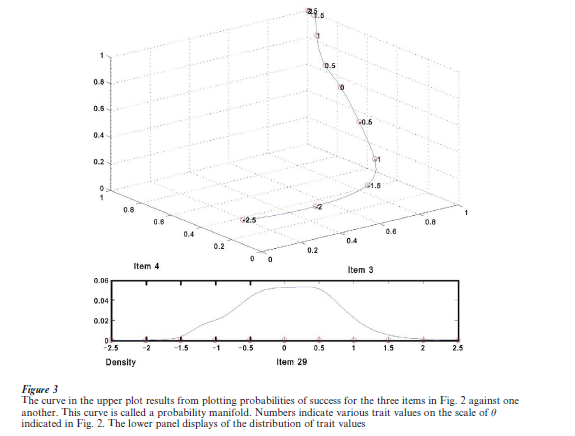
The curve in Fig. 3 is a manifold in mathematical jargon. Indeed, a smooth manifold, and, if we can compute derivatives of item characteristic curves, a differentiable manifold. The subdiscipline dealing with such structures is differential geometry. The variable, or any smooth transformation of it, is called a chart for the manifold. And with good historical reason, too, since a familiar example of a two-dimensional manifold is the surface of the earth, and latitude and longitude are used to chart this structure, but this is only one example among a large number of alternative charting systems used by cartographers.
What is essential here is that the notion of a manifold captures both the even topological texture discussed in Section B, and something else that is much stronger. Any latent variable charting the manifold can be freely transformed by a smooth and order-preserving function. But there is one charting system that is intrinsic to the manifold, and therefore not at all latent. This is arc length s, the distance along the manifold from its beginning, or from any designated point within the manifold. It measures how far someone at the lowest level of performance has to go within probability space to get to a specified performance criterion. Sums and differences of arc lengths can be calculated, and this makes s a ratio scale variable in Stevens’ sense. Indeed, it is more, since s cannot be multiplied by an arbitrary positive constant, and it therefore is an absolute scale. Each examinee has an s-value, and, since values of s also possess a measure structure, we can approximate the distribution of these values. The probability density function for s is shown at the bottom of Figure 3. It may be argued that arc length s is the natural or intrinsic measure of test performance. For further discussion of the manifold perspective on modern test theory, see Ramsay (1996).
Of course, this is a rather elementary, albeit enormously important, example of a manifold. What comes out of a principal components analysis of p variables is a flat k-dimensional manifold, although there are certainly researchers who have considered how to construct curved manifolds. Multidimensional scaling uses distance information, which is essentially topological, to identify similar flat structures, but within which interesting curved substructures are often easily visible.
The advantages of manifolds, as opposed to latent variables, are:
(a) Manifolds are manifest. One can understand how they relate to the data.
(b) Manifolds have topological, measure-theoretic, metric, and algebraic structures that justify using operations such as computing derivatives, for example, to measure the amount of information conveyed by an item about an examinee.
(c) Manifolds do not confuse people. Nobody is misled in using sums, differences, and other operations within these manifolds, whereas the same operations applied to latent variables do not survive the legitimate (i.e., continuous, differentiable, etc.) transformations that may be applied to them.
(d) There is an established, and even rather old, body of mathematical theory, namely differential geometry, that can be used to develop new methods for data analysis.
It may be that we need to replace models expressed in terms of latent traits by explicit references to the manifolds that they implicitly define.
Bibliography:
- Costa P T Jr., McCrae R R 1985 The NEO Personality Inventory Manual. Psychological Assessment Resources, Odessa, FL
- Hambleton R K, Swaminathan H 1991 Fundamentals of Item Response Theory. Sage, Newbury Park CA
- Lord F M 1980 Applications of Item Response Theory to Practical Testing Problems. Erlbaum, Hillsdale, NJ
- Ramsay J O 1991 Kernel smoothing approaches to nonparametric item characteristic curve estimation. Psychometrika 56: 611–30
- Ramsay J O 1996 A geometrical approach to item response theory. Behaviormetrika 23: 3–17
- Stevens S S 1946 On the theory of scales of measurement. Science 103: 677–80
- van der Linden W J 1997 Handbook of Modern Item Response Theory. Springer, New York
ORDER HIGH QUALITY CUSTOM PAPER

Always on-time

Plagiarism-Free

100% Confidentiality