
View sample comparative psychology of audition research paper. Browse research paper examples for more inspiration. If you need a psychology research paper written according to all the academic standards, you can always turn to our experienced writers for help. This is how your paper can get an A! Feel free to contact our writing service for professional assistance. We offer high-quality assignments for reasonable rates.
The world is filled with acoustic vibrations, sounds used by animals for communication, predator evasion, and, in the case of humans, also for artistic expression through poetry, theater, and music. Hearing can complement vision and other senses by enabling the transfer of acoustic information from one animal to the next. In some instances, acoustic signals offer distinct advantages over visual, tactile, and chemical signals. Sound can be effectively transmitted in complete darkness, quickly and over long distances. These advantages may explain why hearing is ubiquitous in the animal world, in air and underwater.
Academic Writing, Editing, Proofreading, And Problem Solving Services
Get 10% OFF with 24START discount code
The ability to detect and process acoustic signals evolved many times throughout the animal kingdom, from insects and fish to birds and mammals. Even within some animal groups, there is evidence that hearing evolved independently several times. Ears appear not only on opposite sides of the head, but also on a variety of body parts. Out of this diversity, one finds fascinating specializations but also a surprising number of general principles of organization and function. Comparative studies of hearing attempt to bring order to these findings and to deepen our understanding of sound processing and perception.
Research on comparative hearing includes a vast number of behavioral measures of auditory function, as well as elaborate neuroanatomical and neurophysiological studies of the auditory structures and signal processing. To review all common measures of auditory function, anatomy, and physiology in all species studied to date is far beyond the scope of this research paper. Instead, we review selected data from representative species, which allow us to highlight general principles and noteworthy specializations. We begin with a brief introduction to acoustic stimuli, followed by a review of ears and auditory systems in a large sample of species, and we conclude with a comparative presentation of auditory function in behavioral tasks. Due to the breadth of this topic, we have omitted most biophysical observations. For the reader who wishes to follow up on any or all topics covered here in more detail, we recommend Fay, Popper, and colleagues.
Overview of Acoustic Stimuli
Many features of hearing organs are simple consequences of the nature of sound waves. These are fluctuations in pressure propagating away from the source with a certain velocity. Therefore, devices sensitive to pressure, either pressure receivers or pressure gradient receivers, may detect sound. Because movement of particles in a medium is directional, receivers sensitive to this component of sound are inherently directional. Both types of detectors have evolved in the animal kingdom.
Sound behaves in a complicated manner close to a sound source (the near field) because sources are rarely the ideal small pulsating sphere. Further away in the far field (about 1 wavelength) sound behaves more simply, especially if there are no reflections. Sound waves can be characterized by their intensity or sound pressure level, frequency, and wavelength, all of which impact the detection, discrimination, and localization of acoustic signals.
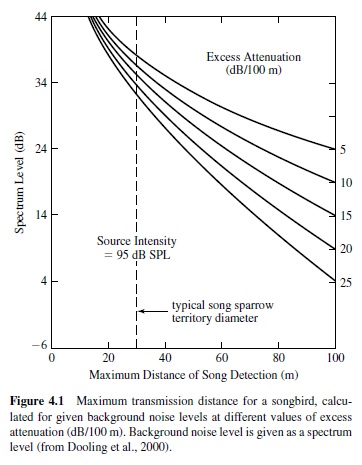
Sound transmission distance is influenced by the characteristics of the acoustic signal and the environment (e.g., Wiley & Richards, 1978). These data, together with psychophysical measures of auditory function, can be used to estimate the communication range of a given species (see Figure 4.1). For a detailed discussion of acoustics and their constraints on hearing in different environments, we refer the reader to comprehensive books by Beranek (1988) and Pierce (1989).
Auditory Periphery
Auditory hair cell bundles must be displaced for sensory transduction to occur. Although the basics of mechanoelectrical transduction are very similar among vertebrates, there are many ways to achieve movement of hair cell cilia because there are different physical constraints on the animals that detect sound in air or water. In water, soft tissues are acoustically transparent. Therefore, sound waves traveling through the body in water cause little direct displacement of hair cell bundles. Fish and amphibians solve this problem through relative motion between the hair cells and a denser overlying structure called an otolith (Lewis & Narins, 1999; Popper & Fay, 1999). In air, tympanic membranes and middle ear bones of terrestrial vertebrates compensate for the impedance mismatch between air and the water-filled inner ear cavities (Fritzsch, Barald, & Lomax, 1998).
Hearing is an evolutionarily ancient sense because vertebrate fossils possess an inner ear. Furthermore, such “primitive” vertebrates as lampreys and the coelacanth have inner ears (Popper & Fay, 1999). Modern vertebrates are thought to have evolved from a primitive group of jawless fishes. These early fishes gave rise to two separate evolutionary lines, the cartilaginous fishes (Chondrichthyes) and the bony fishes (Osteichthyes), as well as to the modern jawless fish. Early in bony fish evolution, the crossopterygian fishes are thought to have split off, to give rise eventually to the tetrapods. This lineage gave rise to the amphibians and then the stem reptiles. These early reptiles then diverged, leading to the evolution of two groups, the birds and crocodilians and the mammals. There have been significant modifications to the ear in all lineages.
Insects
Insect ears appear often in evolution and generally have three major features: (a) thinning of cuticle over the organ to form tympanum that is moved by air pressure, (b) formation of an air cavity of tracheal origin sometimes expanded into a chamber, and (c) innervation of this complex by sensory cells. Sound vibrates the tympanum and transmits motion to the sensory cell. Thus unlike vertebrate ears, where airborne vibrations are converted into vibrations in fluid by middle ear bones, no such conversion is required in insects. Most insect ears do not have many receptor cells, but tonotopic organization has developed where there are many receptors. For example, crickets have relatively large ears, with 60 to 70 auditory receptor neurons divided into two groups. The proximal group is sensitive to lower frequencies, whereas the larger distal population is tuned over a frequency range from the best frequency of cricket song (5 kHz) to ultrasound. Another strategy has been to develop different ears with different sensitivities: Mantis ears exhibit sensitivity to low frequencies in their mesothoracic ear and sensitivity to high (ultrasonic) frequencies in the metathoracic ear (Yager, 1999).
Fishes
The auditory organs of fishes are the saccule, lagena, and utricle. Each has sensory tissue containing hair cells and support cells overlain by an otolith. The otolith organ most used in hearingvariesamongspecies.Intheherringstheutricleisspecially adapted for receiving acoustic input, but in most fishes the saccule is the primary auditory organ. Most bony fishes have a swim bladder or other gas-filled “bubble” in the abdominal cavity or head.As sound pressure fluctuations occur, the bubble expands and contracts according to the amplitude of motion characteristic of the enclosed gas.The swim bladder thus becomes a monopole sound source. The motions of the swim bladder walls may reach the ears of some species and cause relative motion between the otoliths and underlying hair cells. In this case, the sound pressure amplitude determines hair cell stimulation. In most fishes response of the ear to sound is determined simultaneously by the ear detecting particle motion in its “accelerometer” mode and by the ear detecting sound pressure via the swim bladder response. In some species the swim bladder is specifically linked to the ear via specialized mechanical pathways. The best known such pathwayistheWeberianossiclesystem,aseriesoffourbonesconnecting the anterior swim bladder wall to the ears. Fishes with such ossicles are considered to be “hearing specialists” in that their sensitivity and bandwidth of hearing is generally greater than for animals lacking such a system. The herrings and the mormyrids have gas bubbles near the ears in the head and are thus also considered to be hearing specialists (Popper & Fay, 1999).
Frogs
With the movement to land, all the major features of the amniote ear appeared, including the tympanum, middle ear, impedance-matching ossicles inserted in the oval window, a tectorial body overlying the hair cells, and specialized auditory end organs (Lewis & Narins, 1999). The ossicles act as an impedance transformer because they transmit motion of the tympanic membrane to the fluid-filled inner ear. Differential shearing between the membranes and hair cell cilia stimulates the hair cells. The sensory hair cells of the frog (Rana) have been used to identify the cellular basis of transduction, mechanosensitive channels located at the tips of the stereocilia (Hudspeth, Choe, Mehta & Martin, 2000). Hair cells are depolarized by movement of the stereocilia and release neurotransmitter onto their primary afferents.
Frogs have very specialized peripheral auditory systems, with two end organs, the amphibian and basilar papillae. This duplication may increase the frequency range because the basilar papilla is sensitive to lower frequencies than is the amphibian papilla (Lewis & Narins, 1999). The discovery of a papilla structure in the coelacanth similar to the amniotic basilar papilla suggests that this organ arose before the evolution of tetrapods (Fritzsch, 1998). There is debate about the homology of the amphibian papilla with the basilar papilla or cochlea of amniotic vertebrates (see Lewis & Narins, 1999). The amphibian papilla is functionally similar to the amniote papilla, but a lack of structural similarity suggests that these organs arose in parallel, with the common function reflecting a basic auditory role. Paleotological evidence suggests that the amniote tympanic ear may have evolved independently at least 5 times, in synapsids, lepidosauromorph diapsids, archosauromorph diapsids, probably turtles and amphibians (Clack, 1997).
In frogs the air spaces of the middle ear open widely to the mouth cavity via large eustachian tubes. This wide pathway of communication between the two ears and the mouth and lungs (and possibly the endolymphatic sac, which is located dorsally on the animal’s neck and upper back) makes possible several potential pathways of sound both to the outer and inner surface of the tympanic membrane. Evidence exists that the ears of some anurans operate both as pressure receivers and as pressure gradient receivers in certain frequency ranges. Because pressure gradients are vector quantities, the ear operating in this mode is inherently directional (Lewis & Narins, 1999).
Reptiles
The reptilian ear has a new feature: a basilar membrane, a thin partition in the fluid partition along which alternating pressures are transmitted (Wever, 1978). Despite the uncertainty surrounding the amphibian ear, and the parallel evolution of the middle ear in amniotes, the evolution of the stereotypical basilar papilla of modern amniotes begins with the stem reptiles (Manley, 2000; M. R. Miller, 1980). The key features of this auditory organ are seen in turtles. The turtle basilar papilla is a flat strip of membrane populated by approximately 1,000 hair cells (Köppl & Manley, 1992). Salient features in papilla evolution include lengthening and curvature of the sensory epithelia, features thought to both enhance sensitivity and extend the audible frequency range (Gleich & Manley, 2000). The avian-crocodilian and mammalian lineages are thought to have diverged from the stem reptiles quite early, and the papillae of these groups are believed to have evolved in parallel. Elongation relative to the turtle papilla is seen in all groups. In addition, lizards display a unique population of freestanding hair cells that are sensitive to higher frequencies. How is frequency tuning achieved? Recordings from turtle hair cells show that a major part of the peripheral tuning mechanism resides in the individual hair cells; that is, they display electric tuning (Fettiplace, Ricci, & Hackney, 2001). Other mechanisms may also apply (Manley, 2000).
Birds
The outer ear of birds includes an external canal and a middle ear similar to those of the amphibians and reptiles in having a single major ossicle, the columella. The efficiency and frequency response of this system is not unlike that of mammals in the frequency range below about 2000 Hz. The columellar middle ear probably should not be considered the major factor limiting the frequency range of hearing because at least one species (the barn owl) has extended its range considerably without abandoning the columella design (Gleich & Manley, 2000). The inner ear of birds includes a cochlea in addition to an associated lagena. A cross section of the bird basilar membrane and papilla shows many rows of hair cells that vary in height across the membrane. There are not two types of hair cells, like there are in mammals, but the tall hair cells closest to the neural edge of the papilla provide the most afferent input to the auditory nerve dendrites, whereas short hair cells furthest from the neural edge receive purely efferent innervation. In general, the height of the hair cell stereocilia varies smoothly from one end of the papilla to the other. Long stereocilia have been associated with low frequency sensitivity, and short with high frequency sensitivity. It is likely that a frequency analysis occurs along the basilar membrane of the bird ear in much the same way that it occurs among mammals (Fuchs, 1992).
Mammals
Mammals have three middle ear bones that work together as a lever system to amplify the force of sound vibrations. The inner end of the lever moves through a shorter distance but exerts a greater force than the outer end. In combination the bones double or triple the force of the vibrations at the eardrum. The muscles of the middle ear also modify the amplification of this lever system and can act to protect the ear from large vibrations. The stapes passes the vibrations to the oval window or opening in the bony case of the cochlea. The oval window is 15 to 20 times smaller than the eardrum, which produces some of the amplification needed to match impedances between sound waves in the air and in the cochlear fluid and set up the traveling wave in the inner ear.
In mammals, sensory cells are organized on the basilar membrane into one row of inner hair cells (inner because they are closer to the central core of the cochlear) and three to five rows of outer hair cells (Dallos, 1996). Inner hair cells innervate Type 1 primary afferents and are innervated by a very few efferents. Outer hair cells are sparsely innervated by Type 2 primary afferents and receive more efferent terminals. Type 1 afferents comprise 95% of total afferents, and they convey the frequency, intensity, and phase of signal to the auditory nerve. Sound frequency is encoded by place on the cochlea; intensity is encoded by the DC component of receptor potential; and timing is encoded by the AC component. Such a system must act as a low pass filter, which places limits on phase locking. There are two main theories about the function of outer hair cells. One is that the traveling wave is boosted by a local electromechanical amplification process; that is, the outer hair cells act as a cochlear amplifier. The other theory is that the outer hair cells mechanically affect the movement of the tectorial membrane. If outer hair cells are destroyed, frequency tuning is greatly diminished.
Central Auditory Pathways
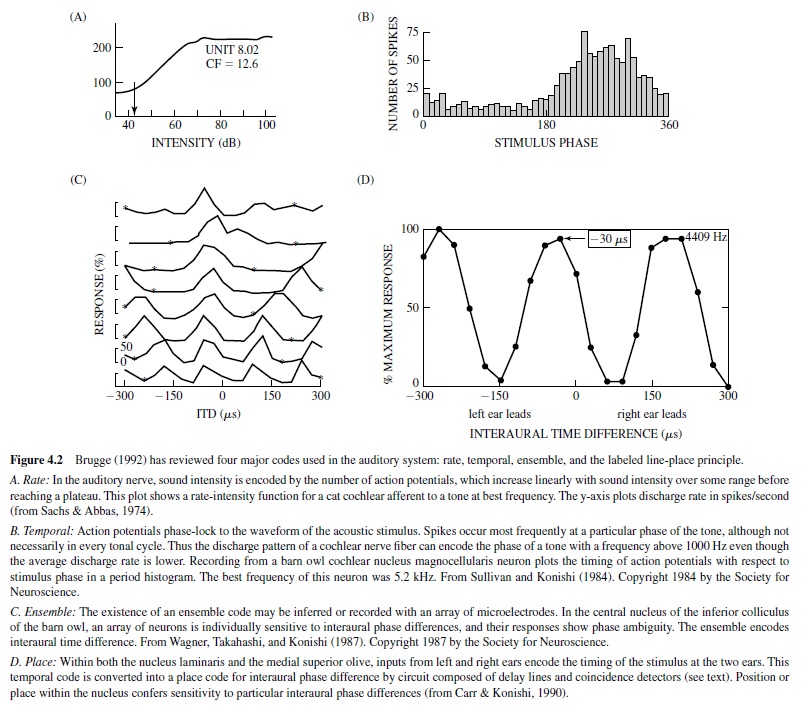
Auditory information is encoded in the activity of both single neurons and arrays of neurons. This activity can be divided into four major codes: rate, temporal, ensemble, and the labeled line-place principle (Brugge, 1992; Figure 4.2). These codes assume the existence of a sensitive receiver or set of neurons whose activity changes in response to the code. None of the codes appear capable of transmitting the entire array of spectral and temporal information (Brugge, 1992). Instead, they appear to operate in various combinations depending on the acoustic environment. Coding strategies also appear to change at different levels of the central auditory pathway, for example, when the phase-locked spikes of the temporal code are converted to the place code output of neurons sensitive to interaural time differences (ITDs). There is no evidence that coding strategies differ among animals.
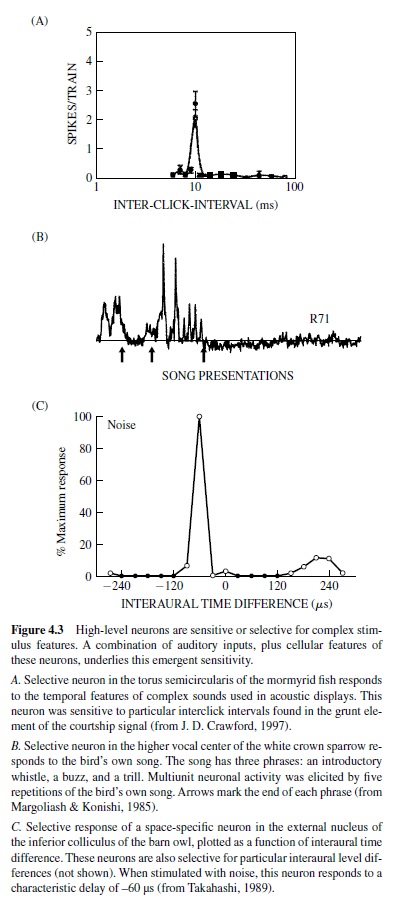
High-level neurons selective for complex stimulus features have been found in every auditory system.These include the song-specific responses found in the song birds, pulseinterval-specific neurons in the midbrain of the mormyrid electric fish, and space-specific neurons in the space-mapped region of the inferior colliculus of the barn owl (Figure 4.3). It is not always clear what combination of inputs and intrinsic properties conveys such specificity.
The basic anatomical organization of the central auditory system does not differ greatly among vertebrates. These connections are reviewed in chapters in The Mammalian Auditory Pathway: Neuroanatomy (Webster, Popper, & Fay, 1993), in Neurobiology of Hearing (Altschuler, Hoffman, Bobbin, & Clopton, 1991), and in The Central Auditory System (Ehret & Romand, 1997). The primary auditory nuclei send a predominantly contralateral projection to the auditory midbrain and in some vertebrates to second-order (olivary) nuclei and lemniscal nuclei. The auditory midbrain generally projects bilaterally to dorsal thalamus and then to hypothalamus and telencephalon. Major differences among central auditory structures appear seldom in evolution. Selective forces driving these changes have been ascribed to the development of new end organs in the auditory periphery and to the increased use of sound (Wilczynski, 1984).
Fay, 1998). The tasks of the insect auditory system are to filter important signals out of the environmental noise including specific frequencies, patterns, and loudness and to determine the location of the sound source. Behavioral studies have shown that crickets can phonotax, or orient toward, sound (as shown later in Figure 3.13). These studies have shown that crickets are sensitive to a wide range of frequencies, with intraspecific signals being most important (Pollack, 1998). They recognize cricket song, particularly pulse period. In the cricket central nervous system, there are neurons that encode the frequency, intensity, direction, and temporal patterns of song. These include multiple pairs of identified interneurons, including the intrasegmental neurons that respond to the temporal pattern of the song (Pollack, 1998).
Fishes
Psychophysical studies have shown that fish hear in the same sense that other vertebrates hear (Fay, 1988). This conclusion is based on behavioral studies of their sensitivity and discriminative acuity for sound. The best sensitivity for hearing specialists is –40 to –50 dB (re 1 dyne per cm2) units, between 200 Hz and 1500 Hz. Fishes without swim bladders or without clear connections between the swim bladder and the ear have best sensitivities between –35 dB and about 10 dB, between 50 Hz and 500 Hz. Sound pressure thresholds for fish that do not use the swim bladder in hearing are inadequate descriptors of sensitivity. The sensitivity of these animals is thus dependent on sound source distance and is better described in terms of acoustic particle motion. Fish ears are also inherently directional (Popper & Fay, 1999).
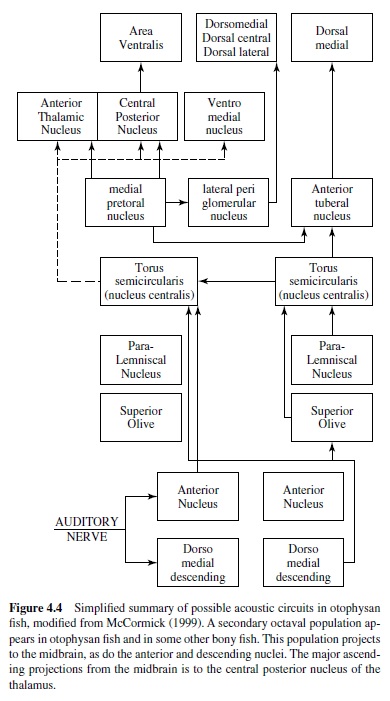
In all vertebrates the auditory nerve enters the brain and divides into two (ascending and descending) branches. In bony fish the ancestral pattern is for auditory and vestibular inputs to project to the anterior, magnocellular, descending and posterior nuclei of the ventral octaval column. Within fish that are auditory specialists, new more-dorsal auditory areas arise from the ventral column (McCormick, 1999). Auditory projections to the descending and anterior octaval nuclei have appeared independently many times in hearing specialists. Both the anterior and descending nuclei project to the auditory area of the central nucleus of the midbrain torus. This area is located medial to the lateral line area. In hearing specialists, secondary octaval and paralemniscal nuclei appear in the hindbrain. The secondary octaval nuclei receive
Insects
Insects hear to obtain information about their environment, so moths and mantises hear the echolocating sounds of bats, whereas crickets localize their mates (see Hoy, Popper, & input from the descending nucleus and project to the central nucleus. Many toral neurons phase-lock to the auditory stimulus, and some exhibit sharp frequency tuning, although the majority of toral units are more broadly tuned (Feng & Schellart, 1999). Some fish use sound for communication, and there are neurons in the central nucleus that are sensitive to the grunts, moans, and howls produced by vocalizing mormyrids (J. D. Crawford, 1997; see Figure 4.3, panel A). The central nucleus has major ascending projections to the dorsal thalamus (central posterior and sometimes anterior). It also projects to the ventromedial nucleus of the ventral thalamus, the posterior tuberculum, and the hypothalamus (McCormick, 1999). The central nucleus and hypothalamus are reciprocally interconnected, which may be related to the role of sound in reproductive and aggressive behavior in some fish. The telencephalon in bony fish is divided into dorsal and ventral areas, with the dorsal area proposed to be homologous to the pallium of other vertebrates, and the ventral area to the subpallium. Two dorsal areas have been shown to respond to sound (within dorsal medial pallium (DM) and dorsal central pallium (DC); see Figure 4.4), but little is know about auditory processing rostral to the midbrain.
Frogs (Anurans)
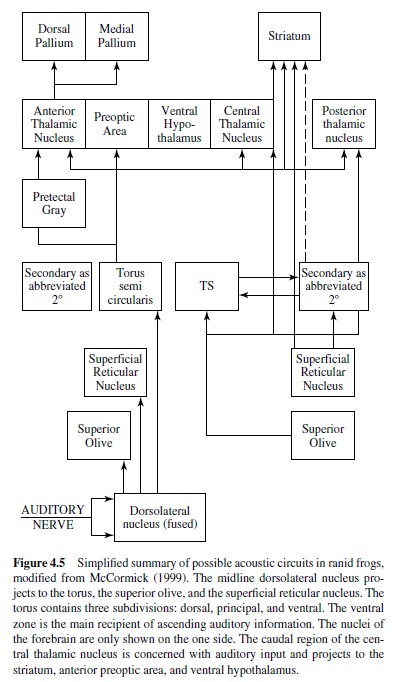
Psychophysical hearing data exist only for the frogs. Many frogs vocalize during mating and other social interactions, and they are able to detect, discriminate, and localize species-specific vocalizations. Behavioral studies have exploited the natural tendency of frogs to orient to sounds broadcast in a more or less natural setting (Zelick, Mann, & Popper, 1999). In frogs afferents project to the specialized dorsal medullary nucleus, and ventrally and laterally to the vestibular column. The dorsal nucleus is tonotopically organized with high-frequency responses from the basilar papilla medial and lower best-frequency responses from the amphibian papilla mapped laterally (McCormick, 1999), as well as typical V-shaped tuning curves (Feng & Schellart, 1999). A major transformation in the signal representation takes place in the dorsal nucleus, with primary like, onset, pauser, and chopper discharge patterns recorded (Feng & Schellart, 1999). These four discharge patterns may correspond to different processing streams or neural codes. The dorsal nucleus projects both directly and indirectly to the auditory midbrain torus, with projections to the superior olive and superficial reticular nucleus (Figure 4.5). The superior olive receives bilateral input from the dorsal nucleus, and many neurons there respond to a wide range of amplitude-modulated stimuli. The ventral zone of the torus receives most of the ascending inputs. It is tonotopically organized; its neurons are often selective to amplitude-modulated stimuli; and more neurons respond to complex sounds than in the medulla (Feng & Schellart, 1999). The torus projects to the central and posterior nuclei of the thalamus and to the striatum. Recordings from the posterior nucleus show sensitivity to the frequency combination present in the frog advertisement calls, and many neurons in central thalamus are broadly tuned and sensitive to specific temporal features of the call (Feng & Schellart, 1999). The central thalamus projects to the striatum, the anterior preoptic area, and the ventral hypothalamus. These connections may mediate control of reproductive and social behavior in frogs (Wilcyznski et al., 1993). The anterior thalamic nucleus supplies ascending information to the medial pallium, although little is known about pallial auditory processing.
Reptiles
The auditory central nervous system is organized in a common plan in both birds and reptiles, presumably due to the conserved nature of the auditory sense and their close phylogenetic relationship (Carr & Code, 2000; Figure 4.6). The auditory nerve projects to two cochlear nuclei, the nucleus magnocellularis and the nucleus angularis, and sometimes to the second-order nucleus laminaris. The nucleus magnocellularis projects to the nucleus laminaris that in turn projects to the superior olive, to the lemniscal nuclei, and to the central nucleus of the auditory midbrain (torus semicircularis, nucleus mesencephalicus lateralis dorsalis, inferior colliculus). The nucleus angularis projects to the superior olive, to the lemniscal nuclei, and to the central nucleus of the auditory midbrain. The parallel ascending projections of angularis and laminaris may or may not overlap with one another, and probably do overlap in the primitive condition. Hindbrain auditory connections are generally bilateral, although contralateral projections predominate. The lemniscal nuclei project to midbrain, thalamic, and forebrain targets. The central nucleus of the auditory midbrain projects bilaterally to its dorsal thalamic target (nucleus medialis or reuniens in reptiles, nucleus ovoidalis in birds). The auditory thalamus projects to the auditory region of the forebrain (medial dorsal ventricular ridge in reptiles, Field Lin birds). Field Lprojects to other forebrain nuclei that may be involved in the control of song and other vocalizations. Descending projections from the archistriatum to the intercollicular area (and directly to the hypoglossal nucleus in some) appear to mediate vocalization.
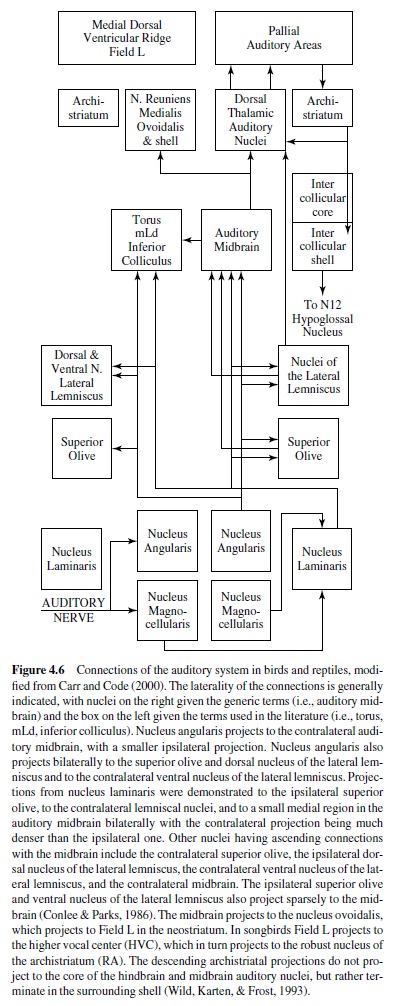
The organization of the central auditory pathways in the turtles is considered to be close to the ancestral plan, whereas the brainstem auditory nuclei of lizards and snakes differ somewhat from other reptiles and birds (Gleich & Manley, 2000). This may be because lizards usually have two types of hair cell, tectorial and freestanding. Tectorial hair cells resemble those found in birds and mammals. Auditory nerve fibers that innervate them encode low center frequencies (100–800 Hz) and have sharp asymmetric tuning curves. Fibers from freestanding hair cells have high center frequencies (900–4000 Hz), high spontaneous rates, and broad symmetric tuning curves. Freestanding hair cells may be a uniquely derived feature of lizards that enables this group to respond to higher frequencies.Auditory nerve fibers from tectorial hair cells project to the nucleus magnocellularis and the lateral nucleus angularis. Neurons that contact freestanding hair cells project primarily to the nucleus angularis medialis. There have been very few physiological investigations of the cochlearnucleiinreptiles,althoughtheauditoryperipheryhas been studied extensively (Carr & Code, 2000).
Birds
Birds use sound for communication and hear higher frequencies than turtles, snakes, and lizards (Dooling, Lohr, & Dent, 2000; Klump, 2000). Most birds hear up to 5 kHz to 6 kHz, and the barn owl has exceptional high-frequency hearing, with characteristic frequencies of 9 kHz to 10 kHz in the auditory nerve (Konishi, 1973). Some land birds such as pigeons, chickens, and guinea fowl are also sensitive to infrasound, below 20 Hz (Carr, 1992). Infrasound signals may travel over great distances, and pigeons may use them for orientation.
Cochlear Nuclei Encode Parallel Ascending Streams of Auditory Information
The auditory nerve projects to nucleus magnocellularis and nucleus angularis in the pattern described for the bird and reptile morphotype (as discussed earlier; see Figure 4.6). In the owl, nucleus magnocellularis is the origin of a neural pathway that encodes timing information, while a parallel pathway for encoding sound level and other aspects of the auditory stream originates with nucleus angularis (Takahashi, 1989). Auditory responses include primary like, onset, chopper, and complex Type IV responses (Köppl, Carr, & Soares, 2001). Recordings in the chicken cochlear nuclei have found a similar but less clear segregation of function (Warchol & Dallos, 1990). The similarities between the owl and the chicken suggest that the functional separation of time and level coding is a common feature of the avian auditory system. The auditory system uses phase-locked spikes to encode the timing of the stimulus (Figure 4.2, panel B). In addition to precise temporal coding, behavioral acuity is also assumed to depend on the activity of neural ensembles (Figure 4.2, panel C). Phase locking underlies accurate detection of temporal information, including ITDs (Klump, 2000) and gap detection (Dooling, Lohr, & Dent, 2000). Neural substrates for phase locking include the specialized end-bulb terminal in the nucleus magnocellularis, termed an end-bulb of Held. This large synapse conveys the phase-locked discharge of the auditory nerve fibers to its postsynaptic targets in the nucleus magnocellularis (Trussell, 1997, 1999). AMPA-type (a-Amino-3-hydroxy-5-methyl-4-isoxazole propionic acid) glutamate receptors contribute to the rapid response of the postsynaptic cell by virtue of their rapid desensitization kinetics (Parks, 2000).
Detection of Interaural Time Difference in Nucleus Laminaris
Nucleus magnocellularis projects to the nucleus laminaris (Rubel & Parks, 1988; Carr & Konishi, 1990). The projections from the nucleus magnocellularis to the nucleus laminaris resemble the Jeffress model for encoding ITDs (see Joris, Smith, & Yin, 1998). The Jeffress model has two elements: delay lines and coincidence detectors. A Jeffress circuit is an array of coincidence detectors, each element of which has a different relative delay between its ipsilateral and contralateral excitatory inputs. Thus, ITD is encoded into the position (a place code) of the coincidence detector whose delay lines best cancel out the acoustic ITD (for reviews, see Joris et al., 1998; Konishi, 2000). Neurons of the nucleus laminaris phase-lock to both monaural and binaural stimuli but respond maximally when phase-locked spikes from each side arrive simultaneously, that is, when the difference in the conduction delays compensates for the ITD (Carr & Konishi, 1990). The cochlear nuclei also receive descending GABAergic inputs from the superior olive that may function as gain control elements or a negative feedback to protect nucleus laminaris neurons from losing their sensitivity to ITDs at high sound intensities (Peña, Viete, Albeck, & Konishi, 1996).
Efferent Control
Efferent innervation of the ear characterizes all vertebrates (Roberts & Meredith, 1992). Cochlear efferent neurons near the superior olive innervate the avian basilar papilla (Code, 1997). Differences in the organization of the avian cochlear efferent and the mammalian olivocochlear systems suggest that there may be significant differences in how these two systems modulate incoming auditory information. Abneural short hair cells in birds have only efferent endings, and these efferents appear act to inhibit responses of the auditory nerve and raise auditory thresholds.
Lemniscal Nuclei
The lemniscal nuclei are ventral to the auditory midbrain. There are two identified lemniscal nuclei in reptiles (dorsal and ventral) and three in birds (dorsal, intermediate, and ventral). These names are the same as those of the lemniscal nuclei in mammals, but the nuclei should not be considered homologous. The dorsal nucleus (LLDp) mediates detection of interaural level differences (ILDs) in the barn owl (Carr & Code, 2000). Interaural level differences are produced by the shadowing effect of the head when a sound source originates from off the midline (Klump, 2000). Some owls experience larger than predicted differences because their external ears are also oriented asymmetrically in the vertical plane. Because of this asymmetry, ILDs vary more with the elevation of the sound source than with azimuth. This asymmetry allows owls to use ILDs to localize sounds in elevation, and they use ITDs to determine the azimuthal location of a sound. The level pathway begins with the cochlear nucleus angularis, which responds to changing sound levels over about a 30-dB range (Carr & Code, 2000). Each nucleus angularis projects to contralateral LLDp. The cells of LLDp are excited by stimulation of the contralateral ear and inhibited by stimulation of the ipsilateral ear. Mapping of ILDs begins in LLDp, with neurons organized according to their preferred ILD. LLDp neurons do not encode elevation unambiguously and may be described as sensitive to ILD, but not selective because they are not immune to changes in sound level. The encoding of elevation improves in the auditory midbrain.
Midbrain and Emergence of Relevant Stimulus Features
The auditory midbrain receives ascending input and projects to the thalamus. It is surrounded rostrally and laterally by an intercollicular area that receives descending input from the forebrain archistriatum (Puelles, Robles, Martinez-de-laTorre, & Martinez, 1994). The auditory midbrain mediates auditory processing, whereas the intercollicular area appears to mediate vocalization and other auditory-motor behaviors. The auditory midbrain is divided into an external nucleus and a central nucleus. The nucleus angularis, LLDp, and nucleus laminaris project to regions of the central nucleus (Conlee & Parks, 1986; Takahashi, 1989). Interaural time difference and ILD signals are combined, and the combinations are conveyed to the external nucleus, which contains a map of auditory space (Knudsen, 1980; Konishi, 1986). Studies of the owl auditory midbrain have shown that most neurons are binaural, excited by inputs from the contralateral ear and inhibited by the ipsilateral ear, although bilateral excitation and contralateral excitation are also present. Many neurons are sensitive to changes in interaural level and time difference. The tonotopic organization is consistent with the tonotopy observed in lizards and crocodiles, and low best frequencies are dorsal (Carr & Code, 2000).
Space-specific responses in the barn owl appear to be created through the gradual emergence of relevant stimulus responses in the progression across the auditory midbrain. Information about both interaural time and level differences project to the external nucleus, and each space-specific neuron receives inputs from a population of neurons tuned to different frequencies (Takahashi, 1989). The nonlinear interactions of these different frequency channels act to remove phase ambiguity in the response to ITDs. The representation of auditory space is ordered, with most of the external nucleus devoted to the contralateral hemifield (Knudsen, 1980). The external nucleus projects topographically to the optic tectum that contains maps of visual and auditory spaces that are in register. Activity in the tectum directs the rapid head movements made by the owl in response to auditory and visual stimuli (Knudsen, du Lac, & Esterly, 1987).
Thalamus and Forebrain
The central nucleus projects to both the external nucleus and the nucleus ovoidalis of the thalamus. Nucleus ovoidalis in turn projects ipsilaterally to Field L. Nucleus ovoidalis has been homologized to the mammalian medial geniculate nucleus (MGv; Karten & Shimizu, 1989). Nucleus ovoidalis is tonotopically organized, with high best frequencies located dorsally and low best frequencies ventrally (Proctor & Konishi, 1997). In the barn owl all divisions of the central nucleus project to ovoidalis, and the physiological responses in ovoidalis reflect this diverse array of inputs. Most neurons had responses to ITD or ILD, at stimulus frequencies similar to those found in the midbrain. In contrast to the mapping found in the midbrain, however, no systematic representation of sound localization cues was found in ovoidalis (Proctor & Konishi, 1997). Nevertheless, sound localization and gaze control are mediated in parallel in the midbrain and forebrain of the barn owl (Carr & Code, 2000).
Field L is the principal target of ascending input from ovoidalis. It is divided into three parallel layers, L1, L2, and L3,withL2furtherdividedintoL2aandL2b.Auditoryunitsin L2 generally have narrow tuning curves with inhibitory sidebands, which might be expected from their direct input from dorsal thalamus, whereas the cells of L1 and L3 exhibit more complex responses in the guinea fowl (Scheich, Langer, & Bonke,1979).ThegeneralavianpatternisthatFieldLprojects to the adjacent hyperstriatum and to other nuclei of the caudal neostriatum.Auditory neostriatal targets of Field L(direct and indirect) include dorsal neostriatum in the pigeon, the higher vocal center (HVC) in songbirds, and ventrolateral neostriatum in budgerigars. These neostriatal nuclei project to the auditory areas of the archistriatum (intermediate archistriatum, ventro medial part (AIVM) and the robust nucleus of the archistriatum,orRA),whichprojectbackdowntotheauditory thalamus and midbrain (Carr & Code, 2000).
Song System Is Composed of Two Forebrain Pathways
Many animals make elaborate communication sounds, but few of them learn these sounds. The exceptions are humans and the many thousands of songbird species, as well as parrots and hummingbirds, that acquire their vocal repertoire by learning (Doupe & Kuhl, 1999). Both humans and songbirds learn their vocal motor behavior early in life, with a strong dependence on hearing, both of the adults that they will imitate and of themselves as they practice.
The song system is composed of an anterior and a posterior pathway. The posterior forebrain or motor pathway is composed of a circuit from HVC to the RA and then to the motor nuclei that control the syrinx and respiration (Brainard & Doupe, 2000; Konishi, 1985; Nottebohm, 1980). The posterior pathway is required throughout life for song production. The anterior forebrain pathway is needed during song learning, but not for normal adult song production, and is made up of a projection from HVC to X to DLM (dorsolateral part of the medial thalamus) to LMAN (lateral magnocellular nucleus of the anterior neostriatum) to RA. The posterior pathway is the presumed site where the motor program underlying the bird’s unique song is stored, whereas the anterior pathway contains neurons that respond to song stimuli, consistent with the idea that this pathway is a possible site of template storage and song evaluation (Margoliash, 1997; Brenowitz, Margoliash, & Nordeen, 1997).The anterior pathway projects to the posterior pathway and is well positioned to provide a guiding influence on the developing motor program. It is also homologous to cortical basal-ganglia circuits in other species (Bottjer & Johnson, 1997).
Mammals
Mammals hear high frequencies and use sound for communication.Humans hear up to 20kHz, while microchiropteran bats have evolved high-frequency hearing for use in sonar, with characteristic frequencies of 50 kHz to 120 kHz. Some large mammals (elephants) are also sensitive to infrasound, which they use for communication (K. B. Payne, Langbauer, & Thomas, 1986).
Auditory Nerve
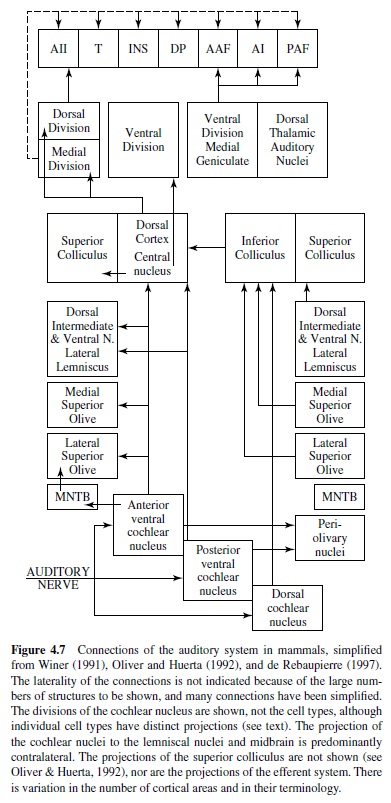
There are two types of auditory nerve afferents in mammals, Type 1 and Type 2. Type 1 afferents receive sharply tuned inputs from inner hair cells and send thick myelinated axons into the brain, where they divide into two. The ascending branch goes to the anterior region of the ventral cochlear nucleus and the descending branch to the posterior region of the ventral cochlear nucleus and to the new dorsal cochlear nucleus. Type 2 afferents are assumed to be unique to mammals, are innervated by outer hair cells, and have thin, unmyelinated axons. They project to granule cell caps of ventral cochlear nucleus (VCN) and dorsal cochlear nucleus (DCN) and are involved in the efferent feedback to the cochlea (Ryugo, 1993). See Figure 4.7.
Tonotopy is preserved in the projections of the auditory nerve. In mammals, the ventral part of each cochlear nucleus receives low center frequency (CF) (apical) input, and dorsal areas receive high CF input. These tonotopic projections are not point to point because each point on the basilar membrane projects to an isofrequency plane across the extent of the cochlear nucleus. Thus the cochlear place representation is expanded into a second dimension in the brain, unlike the visual and somatosensory systems, which are point to point. These tonotopic sheets are preserved all the way to cortex, although it is not clear what features are processed in these isofrequency slabs. Divergent and convergent connections within isofrequency planes may be observed at all levels. The auditory nerve forms different types of terminals onto different cell types in the cochlear nucleus (Ryugo, 1993). End bulbs of Held terminals are formed on bushy cells (as discussed later), whereas more varicose or bouton-like terminals are formed on other cell types in the cochlear nuclei. The auditory nerve appears to use glutamate as a transmitter, often with the postsynaptic cell expressing “fast” AMPA-type glutamate receptors that can mediate precise temporal coding (Oertel, 1999; Parks, 2000; Trussell, 1999).
The Cochlear Nucleus Produces Ascending Parallel Projections
There are four major cell types in the ventral cochlear nucleus (Rhode & Greenberg, 1992; Rouiller, 1997; Young, 1998). First, bushy cells respond in a primary- or auditorynerve-like fashion to the auditory stimulus. Second, octopus cells respond to onsets or stimulus transients; and third, two classes of multipolar neurons respond principally with “chopper” firing patterns. Bushy cells receive end-bulb inputs from the auditory nerve and exhibit accurate temporal coding. There are two forms of bushy cells, spherical and globular. Spherical cells dominate the anterior ventral cochlear nucleus, respond to lower best frequencies, and project to the medial superior olive, which is sensitive to ITDs. Globular bushy cells by comparison sometimes chop or exhibit onset responses to the stimulus, respond to higher frequencies, and project to the lateral superior olive and the medial nucleus of the trapezoid body. These projections may mediate detection of ILDs. Octopus cells in the posterior ventral cochlear nucleus are multipolar, with thick dendrites that extend across the nerve root (Oertel, Bal, Gardner, Smith, & Joris, 2000). This morphology enables them to integrate auditory nerve inputs across a range of frequencies. Octopus cells encode the time structure of stimuli with great precision and exhibit onset responses to tonal stimuli (Oertel et al., 2000). Onsets play an important role in theories of speech perception and segregation and grouping of sound sources (Bregman, 1990). Two classes of multipolar neurons respond to tones principally with “chopper” firing patterns (Doucet & Ryugo, 1997).
The dorsal cochlear nucleus appears for the first time in mammals, perhaps associated with the development of highfrequency hearing and motile external ears. It is composed of a cerebellum-like circuit in the superficial layers, with projection cells below that receive auditory nerve inputs (Berrebi & Mugnaini, 1991; Young, 1998). Dorsal cochlear nucleus cells exhibit a wide variety of response types, with one theory of function relating to echo suppression. The granule cells in the superficial layers receive ascending somatosensory input that may convey information about head and ear position. The deep portion of the dorsal cochlear nucleus contains fusiform and stellate cell types. Fusiform cells exhibit complex (Type IV) frequency tuning curves, with small areas of excitation at best frequency and at sides. This response is well suited to detecting the notches in sound level created by the pinnae that provide cues for locating sound in elevation (May, 2000).
Binaural Interactions and Feedback to the Cochlea Originate in Periolivary and Olivocochlear Nuclei
The superior olivary complex consists of the lateral and medial superior olivary nuclei and a large number of smaller cell groups known as the periolivary nuclei, which are sources of both ascending and descending projections (Helfert & Aschoff, 1997). All receive input from the cochlear nuclei.
Their functions are largely unknown, except for efferent control of the cochlea and encoding sound level (Warr, 1992). The medial nucleus of the trapezoid body (MNTB) projects to the lateral superior olive, ventral nucleus of the lateral lemniscus, medial superior olive, and other periolivary nuclei. Responses of MNTB cells were similar to their primary excitatory input, the globular bushy cell, which connects to the MNTB via end-bulb synapse. The MNTB cell output forms an important inhibitory input to a number of ipsilateral auditory brain stem nuclei, including the lateral superior olive. MNTB neurons are characterized by voltage-dependent potassium conductances that shape the transfer of auditory information across the bushy cell to MNTB cell synapse and allow high-frequency auditory information to be passed accurately across the MNTB relay synapse (Trussell, 1999).
Two populations of olivary neurons project to the cochlea: lateral and medial (Warr, 1992). Thin olivocochlear fibers arise from the lateral olivocochlear group located ipsilaterally in the lateral superior olive. Thick olivocochlear fibers arise from the medial olivocochlear group located bilaterally in the periolivary nuclei. Although they project primarily to the cochlea, olivocochlear neurons also give off branches to a variety of nuclei in the brainstem, and to inferior colliculus, thus involving auditory and nonauditory nuclei in the olivocochlear reflex system. Olivocochlear neurons can be activated by sound, whereas activation of the medial olivocochlear bundle results in suppression of spontaneous and tone-evoked activity in the auditory nerve.
Olivary Nuclei and Interaural Interactions
The olivary nuclei regulate the binaural convergence of acoustic information and mediate spatial hearing.Neural computations of sound location take place at this first site of binaural convergence. The lateral superior olive encodes ILD, whereas the medial superior olive encodes time differences. Thus an important transformation takes place here. Information conveyed by temporal and rate codes is transformed in the olivary nuclei into labeled line-place principle codes for location.
The lateral superior olive principal cells receive excitatory inputs from ipsilateral globular bushy cells, as well as inhibitory glycinergic inputs onto their cell bodies and proximal dendrites, relayed from the contralateral ear via the MNTB. The MNTB input acts to reverses the sign of bushy cell input from excitatory to inhibitory to make an EI response—that is, excited (E) by the ipsilateral ear and inhibited (I) by the contralateral ear. Traditionally, the lateral superior olive has been assigned the role of extracting azimuthal angle information of high-frequency sound from ILD. Some sensitivity to time differences has also been observed. Almost all lateral superior olive responses have monotonic rate-level functions, typically with sigmoidal ILD sensitivity functions. In general, as the strength of the contralateral input increases with increasing loudness in the contralateral ear, the maximum rate decreases. Thus the lateral superior olive rate signals a range of ILDs (Kuwada, Batra, & Fitzpatrick, 1997).
Sensitivity to ITDs originates in the medial superior olive. The organization of the medial superior olive circuit appears to conform to the requirements of the Jeffress model for transforming ITDs into a place code (Joris et al., 1998). The Jeffress model is made up of delay lines and coincidence detectors. Each coincidence detector in the array has a different relative delay between its ipsilateral and contralateral excitatory inputs. Interaural time difference is encoded into the position or place in the array whose delay lines best cancels out the ITD. Neurons of the medial superior olive act as coincidence detectors. They phase-lock to both monaural and binaural stimuli and respond maximally when phase-locked spikes from each side arrive simultaneously, that is, when the difference in the conduction delays compensates for the ITD (Joris et al., 1998). The overall result of this scheme is the creation of an array of cells tuned to specific ITDs and arranged according to their best azimuth. The azimuth of a sound source is coded by the location of maximal activity in the array (Joris et al., 1998).
Auditory Midbrain: Inferior Colliculus and the Emergence of Biologically Important Parameters
The inferior colliculus is the midbrain target of ascending auditory information. It has two major divisions, the central nucleus and dorsal cortex, and both divisions are tonotopically organized. The inputs from brainstem auditory nuclei are either distributed across or superimposed on maps to form what are believed to be locally segregated functional zones for processing different aspects of the auditory stimulus (Ehret, 1975; Oliver & Huerta, 1992). The central nucleus receives both direct monaural input and indirect binaural input. Physiological studies show both binaural and monaural responses (Ehret, 1975).
Casseday and Covey (1996) proposed that tuning processes in the inferior colliculus are related to the biological importance of sounds. Their ideas are summarized here. There is a change in timing properties at the inferior colliculus, from rapid input to slowed output, and they propose that this transformation is related to the timing of specific behaviors. The framework proposed by Casseday and Covey is useful because at least some neurons in the inferior colliculus are tuned to behaviorally relevant stimuli that trigger species-specific behavior, and the processing of these sign stimuli triggers action patterns for hunting, escape, or vocal communication. Evidence for the theory comes from the convergence of parallel auditory pathways at the inferior colliculus, the interaction of the inferior colliculus with motor systems, tuning of auditory midbrain neurons to biologically important sounds, the slow pace of neural processing at the inferior colliculus, and the slow pace of motor output.
Thalamus
Three major features characterize the auditory forebrain (de Rebaupierre, 1997; Winer, 1991). First, there is a primary, lemniscal pathway from the cochlear nuclei to primary auditory cortex (A1) with a systematic representation of tonotopy, binaural signals, and level. Second, a parallel nonprimary pathway arises in midbrain tegmentum, dorsal medial geniculate body, and nonprimary auditory cortex with broad tuning curves and nontopical representation predominate. Third, an even more broadly distributed set of connections and affiliations link auditory forebrain with cortical and subcortical components of the limbic forebrain and associated autonomic areas, as well as elements of the motor system that organize behavioral responses to biologically significant sounds (Winer, 1991).
The primary target of the inferior colliculus in dorsal thalamus is the medial geniculate. This nucleus has three subdivisions: medial, ventral, and dorsal. The ventral division receives major ascending input from the central nucleus of the inferior colliculus and contains sharply tuned cells like those of the inferior colliculus. The ventral division is tonotopically organized although the organization is not simple (there is a concentric component with low frequencies in the center; Imig & Morel, 1988). The cells of the dorsal and medial divisions are fairly unresponsive to tones or noise and respond with long latencies, consistent with major projection back from perirhinal cortex. The functional role of the dorsal and medial divisions is not clear, except to note that nonmonotonic (i.e., selective) responses are common there. In the mustached bat (Pteronotus), both medial and dorsal divisions contain fine delay-tuned neurons (Olsen & Suga, 1991; Suga, 1988). Recent studies on the bat’s auditory system indicate that the corticofugal system mediates a highly focused positive feedback to physiologically “matched” subcortical neurons, and widespread lateral inhibition to physiologically “unmatched” subcortical neurons, to adjust and improve information processing (Suga, Gao, Zhang, Ma, & Olsen, 2000). Suga proposed that the processing of complex sounds by combination-sensitive neurons is heavily dependent on the corticofugal system.
Auditory Cortex
The greatest difference between mammals and other vertebrates is the evolution of the cortex in place of the nuclear organization of the forebrain (Karten & Shimizu, 1989). Whether or not this new structure has facilitated the creation of new auditory areas, new areas are a feature of the mammalian auditory specialists. Whereas primitive mammals like tenrecs have few auditory areas (Krubitzer, Kunzle, & Kaas, 1997),thereareatleastseventonotopicmapsinthecatandthe mustached bat. In the cat these areas include A1; secondary auditory cortex (A2); the anterior auditory field; posterior, ventral, and ventral posterior areas as well as insular; Te; and other anterior ectosylvian fields with uncertain tonotopy (de Rebaupierre, 1997). A1 and A2 share physiological features of alternating bands of EE and EI neurons that are mapped orthogonal to the tonotopic axis. In primary auditory cortex responses tend to be more transient than auditory nerve responses, and they show inhibition away from their best frequency. Most responses are binaural and similar to responses from brainstem. These binaural responses are generated by short latency excitatory input from contra ear, and ipsilateral input that might be E, I, or mixed, with the best frequency matched to the input from the contralateral ear.
In the mustached bat there are at least seven cortical areas, many of which are related to processing echolocation signal components. A1 systematically represents frequency with an enlarged representation of the Doppler shift compensation region (pulse frequency range), mapping not just frequency, but amplitude as well. There are several maps of echo delay, for delays that represent near,midrange,andfartargets.Thereisalso a map of the contralateral azimuth and a second Doppler shift region. Suga (1988) used these data to construct a parallelhierarchical scheme for signal processing. Because the different constant-frequency and frequency-modulated components differ in frequency, they are processed in parallel channels in the auditory system by virtue of their tonotopy. In the cortex, however, combination-sensitive neurons may be created by comparing across frequency channels (Suga, 1988).
Auditory Function and Behavior
Absolute Auditory Thresholds
A fundamental behavioral measure of hearing sensitivity is the audiogram, a plot of detection thresholds for pure tones across the audible spectrum, which provides an estimate of the frequency range and limits of an animal’s hearing. These parameters are influenced by the features of the peripheral auditory system (Wever, 1949), and in mammals these features include the size and impedance-matching characteristics of the middle ear system (Dallos, 1973; Geisler & Hubbard, 1975; Guinan & Peake, 1967; Møller, 1983; Nedzelnitsky, 1980; Rosowski, 1994), the length and stiffness of the basilar membrane (Békésy, 1960; Echteler, Fay, & Popper, 1994; Manley, 1972), the size of the helicotrema (a small opening at the cochlear apex; Dallos, 1970), the density of hair cells (Burda & Voldrich, 1980; Ehret & Frankenreiter, 1977), and the density of hair cell innervation (Guild, Crowe, Bunch, & Polvogt, 1931) along the basilar membrane. In other animals, features of the auditory periphery also play a role in defining the limits and range of hearing in birds (Gleich & Manley, 2000), fish (Popper & Fay, 1999), anurans (Capranica & Moffat, 1983; Lewis, Baird, Leverenz, & Koyama, 1982), and insects (Yager, 1999).
For most vertebrates, the audiogram is a smooth U-shaped function; thresholds are high at the lower and upper frequency boundaries compared to intermediate frequencies where thresholds are lowest (see, e.g., Masterton, Heffner, & Ravizza, 1969). Mammals differ greatly in the octave range over which they can hear, from as little as 3.5 octaves in the mouse and horseshoe bat to over 8 octaves in the dolphin, raccoon, cat, and kangaroo rat. The smaller octave range of hearing in the mouse and bat nonetheless covers a large frequency bandwidth, as these animals hear ultrasound, in which a single octave (frequency doubling) spans a minimum of 40 kHz. Humans show greatest sensitivity between 1 kHz and 4 kHz and hear over a range of about seven octaves (Sivian & White, 1933; see Figure 4.8).
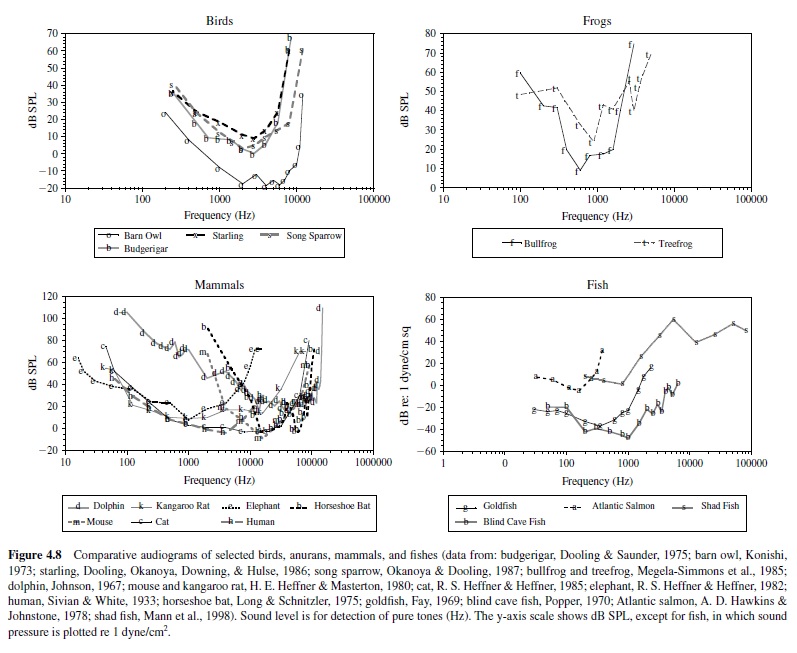
Some animals show enhanced sensitivity nested within their range of hearing. For instance, the audiogram of the echolocating horseshoe bat is highly irregular in shape (Long & Schnitzler, 1975). Between 10 kHz and 40 kHz, a plot of threshold change with frequency resembles the standard U-shaped function of most vertebrates, but the range of this animal’s hearing extends far above 40 kHz. Threshold declines gradually at higher frequencies between 40 kHz and 70 kHz before rising rapidly at approximately 81 kHz. The audiogram then shows a very sharp peak in sensitivity at about 83 kHz; the auditory threshold at neighboring lower and upper bounding frequencies (81 kHz and 90 kHz) is elevated by about 30 dB. This bat emits echolocation signals adjusted to return at 83 kHz and has evolved a highly specialized auditory system to detect this biologically important sound frequency. The basilar membrane of the horseshoe bat shows considerable expansion of its frequency map in the region that responds to frequencies around 83 kHz, and this magnification is preserved in the tonotopic organization of the ascending auditory pathway. Thus, the unusual shape of this animal’s audiogram reflects an adaptation to facilitate the reception of species-specific acoustic signals (Neuweiler, Bruns, & Schuller, 1980).
Adaptations in the auditory periphery also support specializations for low-frequency hearing. Examples are the kangaroo rat, mole rat, and Mongolian gerbil, small mammals that have evolved enlarged external ears and middle ear cavities that serve to collect and amplify low-frequency sounds (A. Ryan, 1976; H. E. Heffner & Masterton, 1980; Ravicz, Rosowski, & Voight, 1992). In fact, these organs take up roughly two thirds of the cross section of the Mongolian gerbil’s head.These animals rely on low-frequency hearing to receive warning signals from conspecifics that must carry over long distances (Ravicz et al., 1992). Elephants also hear very lowfrequencies(65dBSPLat16Hz;R.S.Heffner&Heffner, 1982), which is presumably important to long-distance communication through infrasound (K. B. Payne et al., 1986).
In vertebrate animals whose hearing sensitivity spans a narrow frequency range, a communication receiver may appear to dominate the auditory system. The frequency range of maximum sensitivity in birds is about 1 kHz to 5 kHz, with absolute hearing sensitivity approaching 0 dB SPL (Dooling, 1980; Dooling et al., 2000). There appears to be a general correspondence between a bird’s peak auditory sensitivity and the average power spectrum of its species-specific song (e.g., canary, budgerigar, field sparrow, red-winged blackbird; Dooling, Mulligan, & Miller, 1971; Dooling & Saunders, 1975; Heinz, Sinnott, & Sachs, 1977; Konishi, 1970), suggesting the relative importance of a communication receiver in the avian auditory system. Nocturnal predators (hawks and owls) generally have lower thresholds than songbirds and nonsongbirds, and they use acoustic signals in part to detect and localize prey. Hearing sensitivity in birds falls off dramatically at 8 kHz to 12 kHz, depending on the species.
Behavioral measures of hearing in anurans (frogs and toads) also suggest that a communication receiver dominates the auditory system of these animals, but most data come from experiments that have relied on behavioral responses that the animals normally make in the context of vocal communication. One such technique, evoked calling, exploits the observation that male frogs will vocalize in response to recordings of natural or synthetic conspecific mating calls, while recordings of other species’ calls fail to elicit vocalizations. In the bullfrog the sound pressure level of a species-specific call must be approximately 60 dB SPL to evoke calling (Megela, 1984).Another technique commonly used to measure hearing in frogs is selective phonotaxis, which exploits the observation that a gravid female will approach a speaker that broadcasts either natural or synthetic conspecific mating calls in preference to one that broadcasts other acoustic stimuli. The female green tree frog exhibits selective phonotaxis to pure tone stimuli at frequencies corresponding to the two major spectral peaks of the mating call, 900 Hz and 3000 Hz (Gerhardt,1974).The minimum sound pressure level that elicits selective phonotaxis from the female green tree frog is approximately 55 dB SPLfor a 900-Hz pure tone and 90 dB SPL for a 3000-Hz pure tone (Gerhardt, 1976). With a synthetic mating call (900- and 3000-Hz tones presented together), the phonotaxis threshold is 48 dB SPL(Gerhardt, 1981).
Using a neutral psychophysical technique that does not require behavior in the context of acoustic communication, Megela-Simmons, Moss, and Daniel (1985) measured hearing sensitivity in the bullfrog and green tree frog at frequencies within and outside those used by these animals for species-specific communication. The bullfrog’s audiogram, like many other vertebrates, is a U-shaped function, ranging between about 300 Hz and 3000 Hz, with highest sensitivity between 600 Hz and 1000 Hz, where this species’s mating call contains peak spectral energy. By contrast, the green tree frog’s audiogram is a W-shaped function, with highest hearing sensitivity at 900 Hz and 3000 Hz, frequencies where spectral energy in the species-specific mating call is greatest. The differences between the audiograms of the bullfrog and the green tree frog can be attributed to a larger separation of frequency tuning of the two hearing organs in the frog’s auditory periphery. In both species the amphibian papillae respond to frequencies up to about 1200 Hz, but the basilar papilla of the green tree frog resonates to approximately 3000 Hz, higher than that of the bullfrog’s basilar papilla, which resonates to approximately 1800 Hz (Lewis, Baird, et al., 1982).
The frequency range of hearing is generally largest in mammals, followed by birds, frogs, fish, and insects (e.g., see the goldfish audiogram plotted in Figure 4.8). However, there are some noteworthy exceptions to this trend. One example is the American shad, a fish species that shares its habitat with the echolocating dolphin. The shad can hear sounds over a frequency range from 100 Hz to an astonishing 180 kHz. While this fish’s threshold is higher in the ultrasonic range than in the audible range, this species can detect 100-kHz signals at about 140 dB re 1 Pa (Mann, Lu, Hastings, & Popper, 1998). Although a variety of fish species is subject to predation by dolphins, the shad has apparently evolved ultrasonic hearing to detect the sonar signals of its predator.
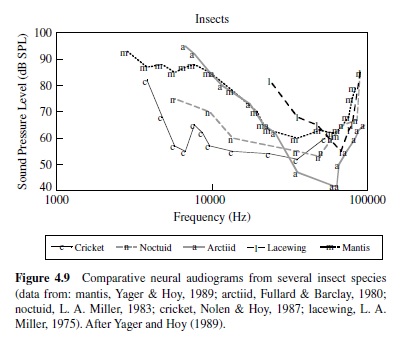
The importance of audition for the evasion of predators is well illustrated by insects that have evolved hearing for the evasion of echolocating bats. The hearing range and sensitivity in insects are often inferred from responses of auditory neurons, and many hear ultrasonic frequencies,which are produced by echolocating bats as they hunt insect prey (see Figure 4.9). Examples of insects that hear ultrasound include the praying mantis (a single ear located on the midline of the ventral thorax; Yager & Hoy, 1986), green lacewings (ears on the wings; L. A. Miller, 1970, 1984), noctuid moths (ears on the dorsal thorax; Roeder & Treat, 1957), hawk moths (ear built into mouthparts; Roeder, Treat, & Vandeberg, 1970), Hedyloidea butterflies (ears at the base of the forewings; Yack & Fullard,1999),crickets(prothoracictibia;Moiseff,Pollack,& Hoy, 1978; Oldfield, Kleindienst, & Huber, 1986), and tiger beetles (ears on the abdomen; Spangler, 1988; Yager, Cook, Pearson, & Spangler, 2000; Yager & Spangler, 1995). Generally,insect auditory thresholds in the ultrasonic range are high, at or above 50 dB SPL, and the frequency range of hearing is typically one to two octaves (Yager, 1999).
Examples also exist for insect sound detection in the human audio range, and often (but not exclusively), low-frequency hearing supports species-specific acoustic communication. Crickets and bush crickets have ears on the proximal tibiae of the prothoracic legs, and the low-frequency range of a large set of auditory receptors corresponds with the spectral content of their species-specific communication calls, generally between 2 kHz and 6 kHz (Imaizumi & Pollack, 1999; Michelsen, 1992; Pollack, 1998).
Masked Auditory Thresholds
When an acoustic signal coincides with interfering background noise, its detection may be partially or completely impaired. The process by which one sound interferes with the detection of another is called masking. Several stimulus parameters influence the extent to which masking occurs, including the relation among the temporal structure, amplitude, and frequency composition of the signal and the masker (e.g., Jeffress, 1970; Scharf, 1970). Predictably, the more similar the temporal and spectral characteristics of the masker are to those of the signal, the more effectively it interferes with the detection of the signal (e.g., Jesteadt, Bacon, & Lehman, 1982; Small, 1959; Vogten, 1974, 1978; Wegel & Lane, 1924). And when the sound pressure level of the masker increases, so does the detection threshold of the signal (e.g., Egan & Hake, 1950; Greenwood, 1961a; J. Hawkins & Stevens, 1950; B. C. J. Moore, 1978; Vogten, 1978; Zwicker & Henning, 1984).
If a masking stimulus is broadband white noise, only a portion of the noise band actually contributes to the masking of a pure tone stimulus. This was originally demonstrated by Fletcher (1940), who measured detection thresholds in humans for pure tones against white noise of varying bandwidths. In this experiment, noise bands were geometrically centered at the frequency of a test tone. The spectrum level of thenoise(i.e.,thepowerofthenoiseina1-Hzband)remained constant, but as the bandwidth varied, so did its total power. Because the total power of white noise is proportional to its bandwidth, it is perhaps not surprising that the threshold for detecting the pure tone increased as the noise band widened. The interesting observation was, however, that the detection threshold for the pure tone increased as the noise band increased only up to a critical value, beyond which the threshold remained constant. Fletcher termed this value the critical band—the frequency region about a pure tone that is effective in masking that tone. This effect is illustrated in Figure 4.10, panel A.
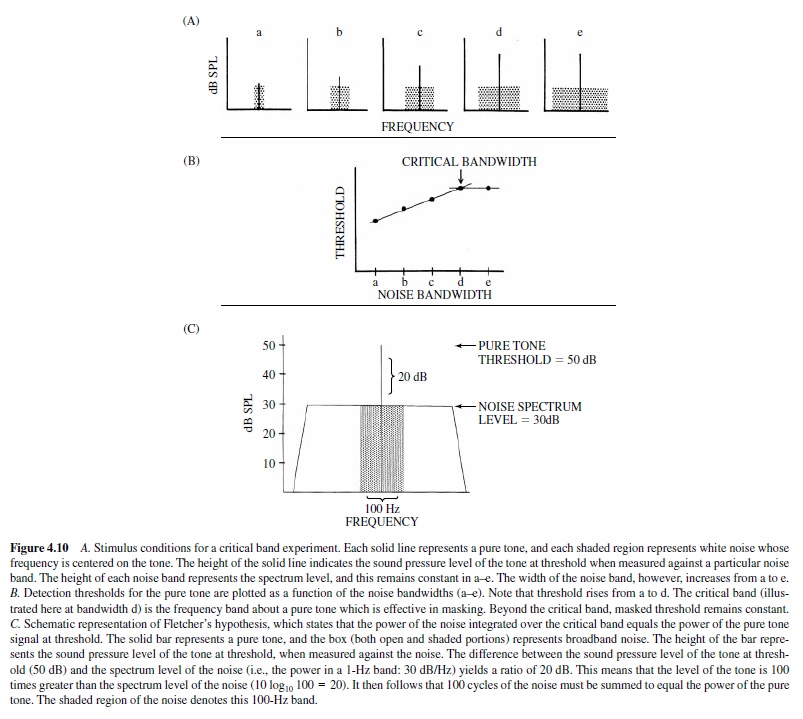
Figure 4.10 presents a schematic representation of the stimulus conditions in a critical band experiment. The solid bar in each graph (a–e) represents a pure tone of a fixed frequency, and the shaded area represents white noise, centered at the frequency of the tone. The spectrum level of the noise in each graph is the same; however, the bandwidth increases from a to e. Accordingly, the total power of the noise also increases from a to e. The height of each bar indicates the level of the pure tone at threshold, when measured against the noise. From a to d the height of the bar increases, indicating that a higher amplitude tone is required for detection as the noise band widens. However, in e the height of the bar is the same as that in d, even though the bandwidth of the noise has again increased. Below (B) the amplitude of the pure tone at threshold is plotted for each of the five noise bandwidths. This figure summarizes the data presented earlier, showing that threshold increases up to bandwidth d and thereafter remains constant. The breakpoint in the function at bandwidth d represents the critical band.
The importance of the results of critical band experiments rests on the implication that the ear sums the noise power or energy over a limited frequency region. A large critical band indicates that the noise must be summed over a wide frequency band in order to mask the signal and therefore indicates relatively poor frequency resolution of the auditory system. By contrast, a small critical band indicates relatively high frequency resolution.
Fletcher (1940) included in the concept of the critical band a hypothesis proposing that the power of the noise integrated over the critical band equals the power of the pure tone signal at threshold. This implies that a critical band can be determined indirectly by measuring the detection threshold for a pure tone against broadband masking noise, rather than directly by measuring the threshold against a variety of noise bandwidths. If one knows the level of the tone at threshold and the spectrum level of the noise, the ratio of the two provides the necessary information to determine the critical bandwidth based on Fletcher’s assumptions. The level of the tone and the spectrum level of the noise are expressed in logarithmic units (dB); therefore, the ratio of the two is simply dB tone – dB noise spectrum level. Given this ratio, one can then calculate the frequency band over which the noise must be integrated to equal the power of the pure tone. Figure 4.10, panel C, illustrates this analysis.
In Figure 4.10, panel C, the solid line represents a pure tone, and the boxed-in area (both open and shaded portions) represents broadband white noise. The height of the bar denotes the amplitude of the pure tone at threshold (50 dB SPL) when measured against the background noise (spectrum level 30 dB SPL/Hz), and the difference between the two is 20 dB. This ratio of 20 dB, in linear units, equals a ratio of 100 (10 log10 100=20 dB). That is, the power of the pure tone is 100 times greater than the power in one cycle of noise; therefore, 100 cycles of the noise must be added together to equal the power of the tone. The shaded portion of the noise represents the 100-Hz frequency region about the pure tone that contributes to the masking. If Fletcher’s assumptions were correct, this value (100 Hz) should equal the critical band, as measured directly; in accordance with this logic, the ratio of the pure tone at threshold to the spectrum level of the broadband noise has been termed the critical ratio (Zwicker, Flottorp, & Stevens, 1957).
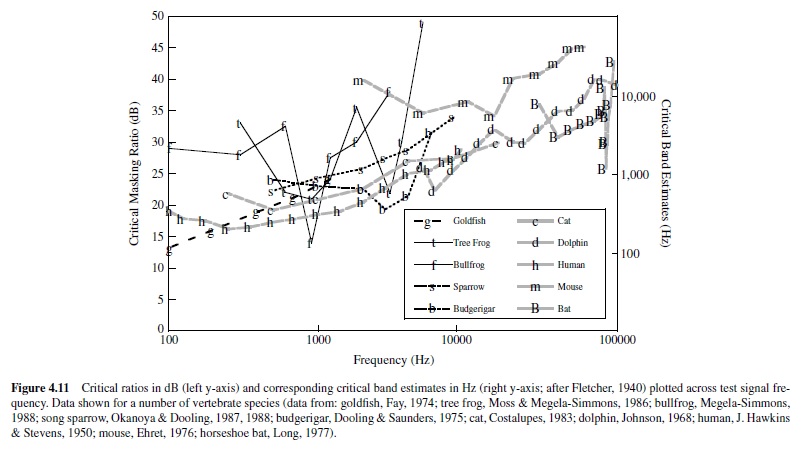
Fletcher’s assumptions have been tested, and it is now well established that critical bands (measured directly) are in fact approximately 2.5 times larger than estimates made from critical ratios (Saunders, Denny, & Bock, 1978; Zwicker et al., 1957). This outcome indicates that Fletcher’s assumptions were not entirely correct; however, the two measures do follow almost parallel patterns of change with signal frequency. Figure 4.11 illustrates this relation, summarizing data collected from several vertebrate species, including humans.The critical ratios have been transformed to estimates of critical bands, following Fletcher’s assumption that the power of the pure tone at threshold equals the power integrated over the critical band of noise. For most species tested, both critical bands and critical ratios increase systematically as a function of signal frequency, and the proportionality between the critical band and the critical ratio exists across a wide range of frequencies. In fact, had Fletcher assumed that the critical band contained 2.5 times the power of the masked tone at threshold (rather than equal power), the two functions would overlap for human listeners at frequencies above 300 Hz.
There are other empirically determined parallels between critical bands and critical ratios. Results of both critical band and critical ratio experiments show that the threshold for detecting a pure tone signal varies with the spectrum level of the masking noise. As the power of the noise increases, there is a proportionate increase in detection threshold (e.g., J. Hawkins & Stevens, 1950; Zwicker et al., 1957). Moreover, experimental findings also indicate that estimates of both the critical band and the critical ratio are invariant with the level of the masking stimulus, except at high noise spectrum levels (exceeding 60–70 dB; Greenwood, 1961a; J. Hawkins & Stevens, 1950).
Prior to Fletcher’s study of the critical band, research on the peripheral auditory system revealed the existence of a frequency map along the cochlear partition (Guild et al., 1931; Steinberg, 1937). High frequencies are coded at the base of the basilar membrane, and lower frequencies are coded progressively toward the apex. This place coding arises from changes in the stiffness of the basilar membrane from base to apex. At the base, where the membrane is stiffest, high frequencies produce maximal displacement; and toward the apex, where relative stiffness decreases, lower frequencies produce maximal displacement (Békésy, 1960).
Fletcher approached his work on the critical band with the assumption that this measure would permit psychophysical estimates of the frequency coordinates of the basilar membrane. Indeed, he found that the function relating stimulus frequency to position along the basilar membrane paralleled the function relating stimulus frequency to the width of the critical band. Both the range of frequencies encoded by a fixed distance along the basilar membrane and the size of the critical band increase as an exponential function of sound frequency (Fletcher, 1940; Greenwood, 1961b; Liberman, 1982). This observation led to the hypothesis that a critical band represents a constant distance along the basilar membrane over which the neural response is integrated (Fletcher, 1940; Zwicker et al., 1957).
Following the early psychophysical studies of critical ratios and critical bands in humans, auditory masking research began on other vertebrate species. These experiments have permitted a comparative approach to the study of frequency selectivity in the auditory system. Remarkably, in a variety of vertebrates (e.g., cat: Watson, 1963; Costalupes, 1983; Pickles, 1975; mouse: Ehret, 1975; chinchilla: J. D. Miller, 1964; rat: Gourevitch, 1965), measures of critical bands and critical ratios show similar frequency-dependent trends, and this pattern resembles that observed in humans—that is, increasing systematically with signal frequency (3 dB/octave). This general pattern has led to the suggestion that frequency selectivity in the auditory systems of vertebrates depends on a common mechanism, the mechanical response of the cochlea (Greenwood, 1961b).
Direct measures of frequency selectivity in single VIIIth nerve fibers differ from those obtained psychophysically, indicating that critical ratios and critical bands are not simple correlates of the tuning curves of primary fibers (Pickles & Comis, 1976). This finding does not rule out the possibility that neural integration along the cochlear partition lays the foundation for frequency selectivity, although it does suggest that other processes, such as the distribution and temporal pattern of neural discharge in the central auditory system, may be involved in frequency discrimination.
Although critical bands and critical ratios increase systematically with signal frequency in most vertebrates, there are noteworthy exceptions. The parakeet shows a U-shaped function; critical ratios are lowest at an intermediate frequency of this animal’s hearing range, and this frequency region corresponds to the dominant frequency components of its vocalizations.Also in this frequency region, the parakeet’s absolute detection thresholds are lowest (Dooling & Saunders, 1975). Asecond example can be found in the echolocating horseshoe bat, which shows a sharp decline in critical ratio (i.e., a marked increase in frequency resolution) at 83 kHz, relative to neighboring frequencies (Long, 1977). This specialization for frequency resolution at 83 kHz parallels that observed for absolute sensitivity described earlier (Neuweiler et al., 1980).
In the parakeet and the horseshoe bat, the spectral regions of greatest frequency selectivity and absolute sensitivity coin-cide; however, it is important to emphasize that these two measures of auditory functionare not typically related.The shapes of the audiogram and the critical ratio function differ markedly in most animals; at frequencies where absolute sensitivity is relatively high, frequency selectivity is not necessarily also high. Nonetheless, measures of hearing in the parakeet and horseshoe bat suggest that auditory specializations (possibly, e.g., the mechanical response of the cochlea, hair cell density and innervation patterns, tonotopic representation in the central auditory system, etc.) do occur to facilitate discrimination of biologically significant signals from noise.
The shape of the green tree frog’s critical ratio function departs from that of most vertebrates. This animal shows a W-shaped critical ratio function, with lowest critical ratios at 900 Hz and 3000 Hz, corresponding to the dominant spectral peaks of its mating call. The smallest critical ratios obtained in the green tree frog are approximately 22 dB, indicating good resolving power of this animal’s ear at biologically salient frequencies, 900 Hz and 3000 Hz. These data compare closely with estimates from other vertebrates at 900 Hz and 3000 Hz and suggest that the ear of the anuran, despite its distinct morphology, can filter frequency as well as that of other vertebrates, including those that possess basilar membranes (Moss & Simmons, 1986).
The mechanical response of the tonotopically organized cochlea can adequately account for measures of frequency selectivity among most vertebrates, and this implies that frequency selectivity is mediated by the spatial distribution of neural activity in the auditory system. However, data obtained from fish (e.g., goldfish: Fay, 1970, 1974; cod: A. D. Hawkins & Chapman, 1975) present a challenge to this commonly accepted notion. There is no biophysical evidence that the auditory receptor organ of the fish, the sacculus (also lacking a basilar membrane), operates on a place principle of frequency coding like the cochlea (Fay & Popper, 1983). Yet fish exhibit the same pattern of frequency-dependent changes in critical ratios as do other vertebrates whose peripheral auditory systems show place coding of frequency. Instead, frequency selectivity in fish has been explained in terms of temporal coding of neural discharge (Fay, 1978a, 1978b, 1983). That is, the temporal pattern of neural discharge in primary auditory fibers, regardless of their innervation sites along the sacculus, may carry the code for frequency selectivity. At present, differences and similarities in the mechanisms of frequency selectivity between fish and other vertebrates are not well understood.
Frequency Difference Limens
The discrimination of sounds on the basis of signal frequency is a common acoustic problem solved by species throughout the animal kingdom. In laboratory studies of frequency discrimination, reference and comparison tones are typically presented in sequence, and the listener is required to report when there is a change in frequency (see Figure 4.12). The data are plotted as the change in frequency required for discrimination as a function of the test frequency. Frequency difference thresholds (limen) measured in mammals, birds, and fishes show a common trend: F/F is approximately constant (Weber’s law holds), with thresholds tending to rise steadily with test frequency. In most animal groups tested (but see the exception noted later), individual species tend to fall within the same range, from less than 1% to about 10%. A low-frequency specialist is the pigeon, and it is hypothesized that this animal uses infrasound for homing (Quine & Kreithen, 1981). The bottlenose dolphin shows well-developed frequency discrimination from 1000 Hz to 140 kHz (Thompson & Herman, 1975).
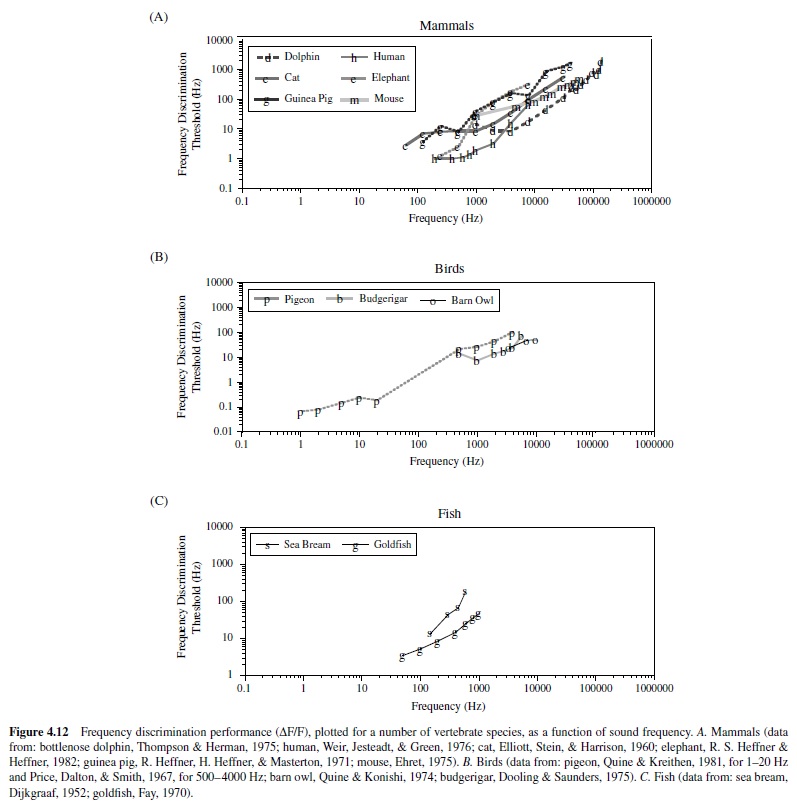
A cross-species comparison of sound frequency discrimination illustrates that common patterns in the data can arise through different mechanisms. Frequency discrimination in insects arises from different auditory receptors that are tuned to different sound frequencies (Michelsen, 1966; Oldfield et al., 1986). Mechanical tuning of the basilar papilla may support frequency discrimination in birds, but other mechanisms may also operate (Gleich & Manley, 2000). In the case of frogs and toads, the tectorial membrane over the amphibian papilla appears to support a traveling wave (Hillery & Narins, 1984; Lewis, Leverenz, & Koyama, 1982), and its mechanical tuning may contribute to frequency discrimination (Fay & Simmons, 1999), but temporal processing or hair cell tuning may also play a role. The fish ear lacks a hearing organ that could support a mechanical place principle of frequency analysis (Békésy, 1960; Fay & Simmons, 1999), but nonetheless fish show a pattern of frequency discrimination that resembles mammals and most birds. Hair cell micromechanics (Fay, 1997), hair cell tuning (A. C. Crawford & Fettiplace, 1980), and time-domain processing (Fay, 1978b) have been proposed as mechanisms for frequency discrimination in fish. Frequency discrimination in mammals is generally assumed to depend on the mechanical tuning of the basilar membrane (Békésy, 1960), but the variety of mechanisms that presumably operate in nonmammalian species challenges us to look more closely at this problem in these animals as well.
In anurans no psychophysical studies have yet measured frequency discrimination across the audible spectrum, as have been conducted in mammals, birds, and fishes. However, frequency discrimination data warrant mention. Evoked calling and selective phonotaxis methods have been used to estimate frequency discrimination in several different anuran species, each of which was tested only over a narrow frequency range that was appropriate for the methods that required behavioral responses in the context of acoustic communication behavior. Most threshold estimates were between 9% and 33%, generally higher than those taken from other species (e.g., Doherty & Gerhardt, 1984; Gerhardt, 1981; Narins & Capranica, 1978; M. J. Ryan, 1983; Schwartz & Wells, 1984). The higher threshold estimates may reflect the methods employed or differences in the frequency resolving power of the anuran ear (Fay & Simmons, 1999). The psychophysical data on critical ratios measured in the green tree frog (Moss & Simmons, 1986), which fall within the range of birds, mammals, and fishes, speak against the latter interpretation, but direct psychophysical studies of frequency discrimination in anurans would address the question more effectively.
Positive and negative phonotaxis have been used to measure frequency discrimination in insects. For example, the cricket (Teleogryllus oceanicus) steers toward a 5-kHz model of a conspecific calling song broadcast through a loud speaker and steers away from a 40-kHz model of a bat echolocation call. By systematically manipulating the stimulus frequency between that of the conspecific call and that of the echolocation signal, the cricket shows a shift in its phonotaxis behavior, which is related to its frequency discrimination of these sound frequencies (Moiseff et al., 1978). This is shown in Figure 4.13.
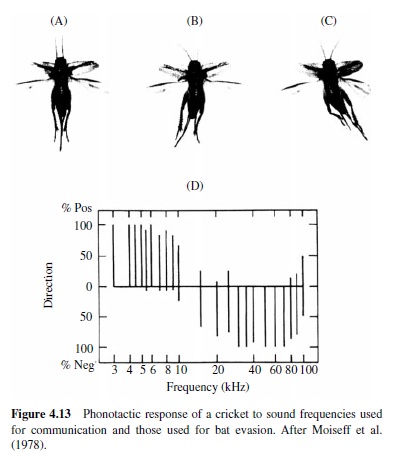
Temporal Resolution
Temporal processing of sound stimuli is an important aspect of hearing that contributes to the perception of complex signals and the localization of sound sources (discussed later). There are many different approaches to the study of temporal processing in the auditory system, but not all have been widely applied to the study of different animal species. Because we emphasize comparative hearing in this research paper, we selected for discussion in this section two measures of temporal resolution that have been studied in several animal groups: temporal modulation transfer function (TMTF) and gap detection. Both measures require the subject to detect changes in the envelope of acoustic stimuli. Abrupt onset or offset of pure tones produces spectral smearing of the stimulus that could provide unintended cues to the subject, and therefore experimenters generally study temporal resolution of the auditory system using noise stimuli.
Temporal Modulation Transfer Function
Detection of the sinusoidal amplitude modulation of broadband noise depends on the rate and depth of stimulus modulation. Measurements of the minimum amplitude modulation depth required for modulation detection across a range of modulation rates can be used to estimate a TMTF. Behavioral data taken from the human, chinchilla, and parakeet all yield TMTFs with low-pass characteristics. The rate at which temporalmodulationdetectionfallstohalfpower (–3dB)is50Hz for the human (Viemeister, 1979), 270 Hz for the chinchilla (Salvi, Giraudi, Henderson, & Hamernik, 1982), and 92 Hz for the parakeet (Dooling & Searcy, 1981). At higher rates, detection of temporal modulation requires increasing depths of amplitude modulation up to around 1000 Hz, and thresholds remain high up to about 3000 Hz (Fay, 1992), after which the auditory system can no longer resolve the temporal modulation. By contrast, the TMTF of the goldfish does not resemble a low pass filter but rather remains relatively constant across modulation rates between 2.5 Hz and 400 Hz (see Figure 4.14).
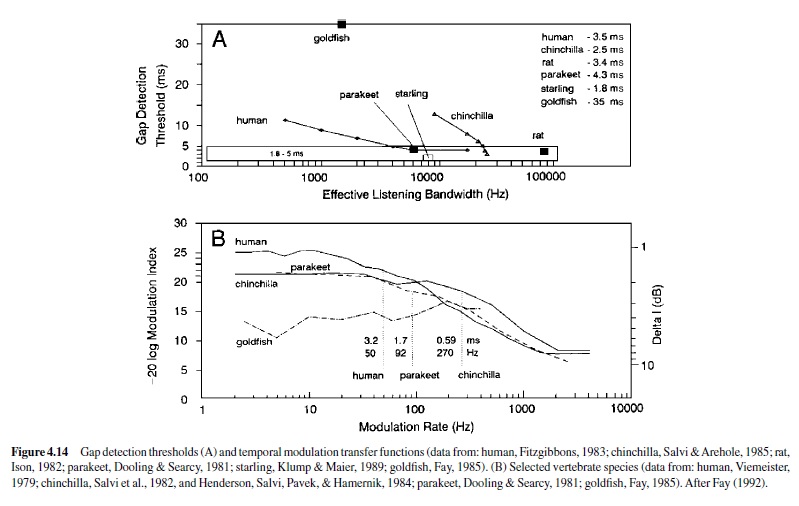
In mammals, data show that detection of temporal modulation of broadband noise depends on hearing bandwidth. High-frequency hearing loss in the chinchilla produces a rise in threshold of amplitude modulation detection across rates and a drop in the half-power temporal modulation rate (Salvi et al., 1982).
Gap Detection
The shortest silent interval that an animal can detect in an acoustic signal is referred to as the gap detection threshold, and in mammals this measure has been shown to depend on noise bandwidth (see Figure 4.14). In both the human (Fitzgibbons, 1983) and the chinchilla, gap detection thresholds are over 10 ms for narrowband noise and systematically decrease with noise bandwidth to a minimum of about 3.5 ms for the human (Fitzgibbons, 1983) and 2.5 ms for the chinchilla (Salvi & Arehole, 1985). The minimum gap detection threshold in the rat is 3.4 ms (Ison, 1982) and in the parakeet it is 4.3 ms (Dooling & Searcy, 1981). Experimentally induced hearing loss above 1 kHz in the chinchilla can raise the gap detection threshold to 23 ms (Salvi &Arehole, 1985). The goldfish shows a gap detection threshold of 35 ms (Fay, 1985). Striking is the very small gap detection threshold of the starling: only 1.8 ms (Klump & Maier, 1989).
Gap detection, like theTMTF, depends on band width, which suggests an influence of frequency tuning in the auditory periphery on performance of these temporal tasks. Comparative hearing loss data are not, however, entirely consistent with this notion. Both gap detection and TMTF may also reflect limitations of neural time processing in the CNS (Fay, 1992).
Localization
Sound source localization plays a central role in the lives of many animals: to find conspecifics, to find food, and to avoid predators. A large number of species use acoustic signals for social communication, and commonly such signals convey the message, “Here I am. Come find me.” For example, the advertisement calls of male frogs attract gravid females to their position along the pond (Capranica, 1976). Calls of birds serve a similar function. Thus, localization of the sender is an important function of acoustic communication in social animals. Some animals detect and localize prey from the acoustic signals they produce. The barn owl, for example, listens to rustling sounds generated by mice that move over the ground. The owl can track and capture the prey in complete darkness (R. S. Payne, 1971) by localizing the sounds generated by its movements through the grass and leaves on the ground.Another example of an animal that uses sound to localize prey is the echolocating bat. The bat transmits ultrasonic acoustic signals that reflect off the prey and uses the features of the reflected echo to localize and capture small flying insects, and it can do so in the absence of vision (Griffin, 1958). The acoustic signals produced by predators can also serve as a warning to prey, and the localization of predator-generated signals can aid in the evasion of predators. For example, moths, crickets, and praying mantises can detect and localize the ultrasound of an echolocating bat, which can guide its flight away from the predator (Moiseff et al., 1978; R. S. Payne, Roeder, & Wallman, 1966; Yager & Hoy, 1986, 1989). Playing several crucial functions, it is not surprising that the capacity to localize sound sources occurs widely throughout the animal kingdom.
In most animals sound localization is enabled by the presence of two ears and a central auditory system that can compare the direction-dependent signals that each receives. The comparison of the signal arrival time (onset, amplitude peaks in the envelope, and ongoing phase) and amplitude spectrum at the two ears provides the basis for sound source localization in most vertebrates, referred to as ITD and interaural intensity difference cues (see Figure 4.15). Directional hearing in some animals, however, depends on directionality of hair cells of the auditory receptor organ (e.g., fish) or directionality of the external ear (e.g., Michelsen, 1998).
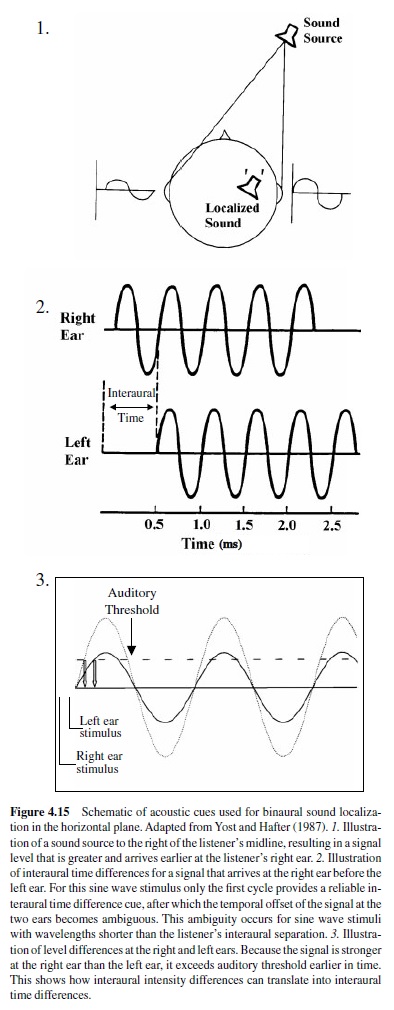
The acoustic cues used by mammals for horizontal sound localization depends on the time-frequency structure of the signals. Ongoing phase differences between signals received at the two ears can be discriminated unambiguously only if the period of the signal is longer than the interaural distance. In humans the distance between the two ears is roughly 17 cm, and the maximum interaural time delay is therefore about 0.5 ms (sound travels in air at a speed of approximately 344 m/s). Humans can use the phase difference of a pure tone signal to localize sound if the frequency is below 1400 Hz (Mills, 1958). At higher frequencies humans use interaural intensity differences for sound localization. In all land vertebrates, interaural intensity difference cues become available when wavelength of the sound is smaller than the dimensions of the animal’s head, so that sufficient sound shadowing occurs to produce amplitude differences of the signal at the two ears (see Figure 4.15). Masterton et al. (1969), H. E. Heffner and Masterton (1980), and R. S. Heffner and Heffner (1992) reported a negative correlation between interaural distance and high-frequency hearing and suggested that high-frequency hearing evolved in animals with small heads to enable sound localization using interaural intensity cues.
There are many different approaches to measuring the accuracy with which a listener can localize a sound source. The listener may indicate the direction of a sound source by pointing or aiming the head. Here, the accuracy of the listener’s motor behavior is included in the localization measure. Some tasks simply require the subject to lateralize a sound source relative to a reference point. In many psychophysical experiments, the subject is asked to indicate whether a sound source location changed over successive presentations. Localization resolution measured in this way is referred to as the minimum audible angle (MAA; Mills, 1958). The MAAdepends on the sound stimulus, with pure tones generally yielding higher thresholds than broadband signals. In mammals MAA can be very small: about 0.8 deg in the human (Mills, 1958), 1.2 deg in the elephant (R. S. Heffner & Heffner, 1982), and 0.9 deg in the bottlenose dolphin (Renaud & Popper, 1975). The macaque monkey has an MAA of 4.4 deg (R. S. Heffner & Masterton, 1978), similar to the opossum with an MAA of 4.6 deg (Ravizza & Masterton, 1972). Data from the horse show a surprisingly large MAA of 37 deg (R. S. Heffner & Heffner, 1984). The pallid bat, an echolocating species that is also known to use passive listening for prey capture, has an MAAof 2 deg (Fuzessery, Buttenhoff,Andrews, & Kennedy, 1993), whereas the echolocating big brown bat has an MAA of 14 deg in a passive listening paradigm (Koay, Kearns, Heffner, & Heffner, 1998). Estimates of azimuthal localization accuracy in the actively echolocating big brown bat are considerably lower: 1 deg to 3 deg (Masters, Moffat, & Simmons, 1985; Simmons et al., 1983). See Figure 4.15, panel B.
Vertical localization in mammals depends largely on spectral cues, created by the direction-dependent filtering of acoustic signals by the external ears, head, and torso (Yost & Gourevitch, 1987). The vertical position of a sound source influences the travel path of the sound through the pinna, which in turn shapes the signal spectrum (Batteau, 1967; R. S. Heffner, Heffner, & Koay, 1995, 1996). Human listeners can discriminate the vertical position of a sound source with accuracy of about 3 deg, but performance falls apart when pinna cues are disturbed (Batteau, 1967; R. S. Heffner et al., 1996). Vertical localization performance in mammals is typically poorer than horizontal localization, with thresholds of about 2 deg in dolphin (Renaud & Popper, 1975), 3 deg in humans (Wettschurek, 1973), 3 deg in rhesus pig tailed monkey (Brown, Schessler, Moody, & Stebbins, 1982), 3 deg in bats (Lawrence & Simmons, 1982), 4 deg in cat (Martin & Webster, 1987), 13 deg in opossum (Ravizza & Masterton, 1972), and 23 deg in chinchilla (R. S. Heffner et al., 1995). Certainly, free movement of the head and pinnae can aid in an animal’s localization of a sound source.
The echolocating bat’s foraging success depends on accurate localization of prey in azimuth, elevation, and distance. The bat uses the same acoustic cues described earlier for sound source localization in azimuth and elevation. The bat determines target distance from the time delay between its sonar vocalizations and the returning echoes and uses the three-dimensional information about target location to guide the features of its sonar vocalizations and to position itself to grasp insect prey with its wing or tail membrane (Erwin, Wilson, & Moss, 2001). Psychophysical studies of echo-delay difference discrimination report thresholds as low as 30 s, corresponding to a range difference of 0.5 cm (reviewed in Moss & Schnitzler, 1995).
Behavioral studies demonstrate that birds also use interaural time and intensity differences to localize a sound source in the horizontal plane; however, there is some debate over the mechanisms. Researchers have argued that the bird’s ears are too closely spaced to use ITDs from two independent pressure receivers, and the sound frequencies that they hear are too low for their small heads to generate sufficient sound shadowing to use interaural intensity differences. This problem can be solved if one assumes that the bird’s ears act as pressure difference receivers (Kühne & Lewis, 1985). Apressure difference receiver is distinct from a direct pressure receiver in that the left and right ears are acoustically coupled through an interaural canal, allowing stimulation of the tympanic membrane from both directions (i.e., from the outside of the head and through the opposite ear via the interaural canal). The interaural intensity and time cues available to the animal are enhanced through a pressure-difference receiver, and substantial data support this hypothesized mechanism for sound localization in birds. However, owing largely to methodological difficulties in fully testing this hypothesis, some researchers continue to challenge the notion (Klump, 2000).
The minimum resolvable angle (MRA) measures the absolute localization performance of an animal, as opposed to relative localization tasks that only require the subject to detect a change in sound source location (e.g., MAA).The MRA has been studied in a number of bird species, and thresholds range from 1 deg to 3 deg in the barn owl (Knudsen & Konishi, 1979; Rice, 1982), saw-whet owl (Frost, Baldwin, & Csizy, 1989), and marsh hawk (Rice, 1982) to over 100 deg in the zebra finch (Park & Dooling, 1991) and the bobwhite quail (Gatehouse & Shelton, 1978). (See Figure 4.16.) It is not clear whether the very high thresholds reported for some species reflect poor localization ability or limitations in the psychophysical methods used to study localization performance. The great horned owl has an MRA of 7 deg (Beitel, 1991), the red-tailed hawk 8 deg to 10 deg, and the American kestrel 10 deg to 12 deg (Rice, 1982). The budgerigar shows an MRA of 27 deg (Park & Dooling, 1991), and the great tit 23 deg (Klump, Windt, & Curio, 1986).
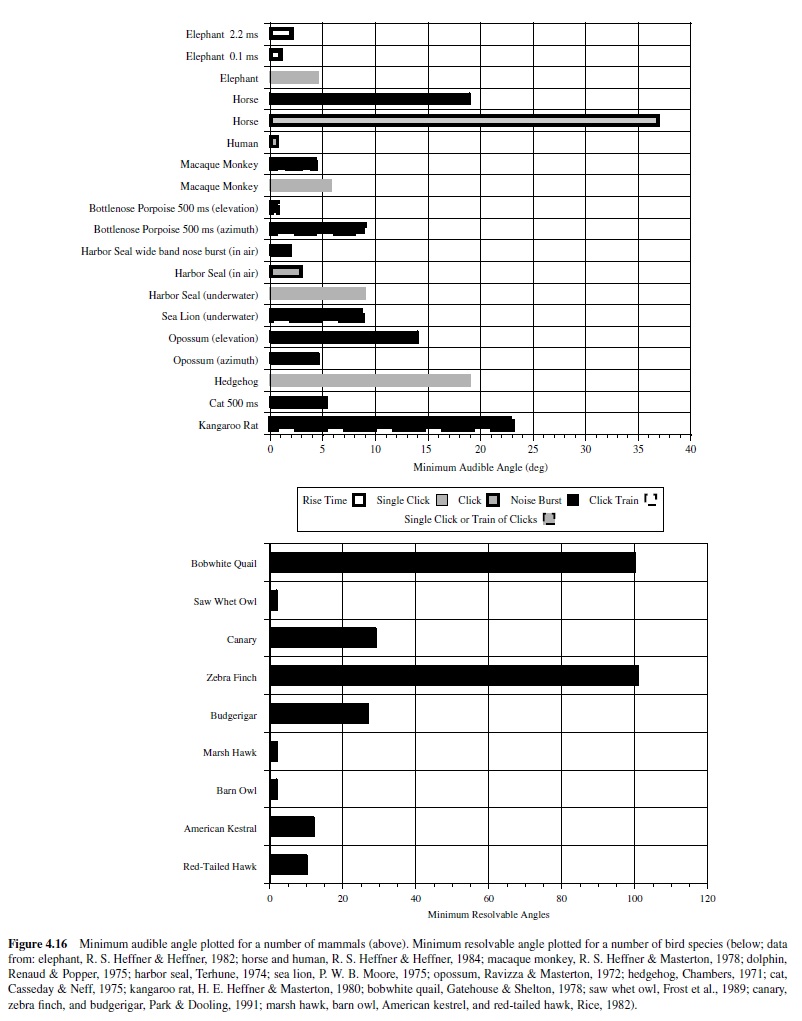
It is not surprising that the smallest MRAs have been measured in raptors. The barn owl, for example, is a nocturnal predator that depends largely on hearing to find prey and has developed exceptional sound localization abilities. It hears higher frequency sounds than most birds (see Figure 4.8), and it shows specializations for temporal processing in the central auditory system that presumably supports its horizontal sound localization (see Figure 4.15). The dominant cue used by the barn owl for vertical sound localization is interaural intensity cues, created by the asymmetrical positions of its right and left ear canals. In addition, the barn owl’s feather ruff enhances elevation-dependent changes in signal intensity (Moiseff, 1989). Vertical sound localization thresholds, like MRA in the horizontal plane, are lowest for broadband signals, as small as 2.2 deg for a 1,000-s noise burst (Knudsen & Konishi, 1979).
Minimum audible or resolvable angles have not been measured in frogs, but binaural hearing is required for sound localization in anurans (Feng, Gerhardt, & Capranica, 1976). Selective phonotaxis studies have been conducted to examine the female frog’s localization accuracy in approaching a speaker that broadcasts a species-specific advertisement call. Taking the mean error between the frog’s position and the position of the sound source averaged across all jumps during phonotactic approaches has yielded estimates of sound localization accuracy in several species: dendrobatid frog, 23 deg (Gerhardt & Rheinlaender, 1980); green tree frog, 15.1 deg (Rheinlaender, Gerhardt, Yager, & Capranica, 1979); painted reed frog, 22 deg in two dimensions, 43 deg in three dimensions (Passmore, Capranica, Telford, & Bishop, 1984); and gray tree frog, 23 deg in three dimensions (Jørgenson & Gerhardt, 1991). Sound localization by the frog derives from a combination pressure-pressure difference system (Feng & Shofner, 1981; Michelsen, 1992; Michelsen, Jørgenson, Christensen-Dalsgaard, & Capranica, 1986).
Fish can localize sound underwater, as they are sensitive to the acoustic particle motion that changes with the sound source direction. Cod can make angular discriminations of sound source location on the order of 20 deg in the horizontal plane and 16 deg in the vertical plane (Chapman & Johnstone, 1974), and sound localization depends on the integrity of both ears (Schuijf, 1975). It appears that vector coding within and across auditory receptor organs in the fish ear supports sound localization: Although the underwater acoustics that impact sound localization in fish differ from those for sound localization in terrestrial animals, it is interesting to note that similar organizational principles appear to operate; namely, binaural cues are used by fish for azimuthal localization and monaural cues for elevational localization (Fay & Edds-Walton, 2000).
Studies of some insect species show that despite their small size they are able to localize sound sources. Localization of acoustic sources is important to social communication and predator evasion in many insect species, which is achieved largely through pressure difference receivers and movement receivers (Autrum, 1940; Michelsen, 1998), although experimental evidence shows that acoustic cues are also available for some insect species to use pressure receivers (R. S. Payne et al., 1966). Pressure difference receivers are more sensitive than movement receivers in acoustic far fields. As in other animals that apparently use pressure difference receivers (e.g., frogs and birds, as discussed earlier), sound waves reach both surfaces of the tympanal membrane, and the directional cues are enhanced by the different paths of acoustic activation. Long, lightly articulated sensory hairs protruding from the body surface of an insect are inherently directional, and the activation pattern of these movement receivers can be used to determine sound source location, particularly at close range, where their sensitivity may be comparable to that of a pressure difference receiver (Michelsen, 1992, 1998).
Some insects are capable not only of lateralizing the direction of a sound source but also scaling the direction of a phonotactic response according to the angular position of the sound source. For example, crickets placed in an arena adjust the angle of each turn toward a loudspeaker broadcasting a conspecific call (Bailey & Thomson, 1977; Latimer & Lewis, 1986; Pollack, 1998). It is noteworthy that behavioral studies of sound localization in crickets using a treadmill apparatus that can elicit and track phonotactic behavior, while keeping the distance from the sound source fixed, have found that localization ability is still intact after removal of one ear or the tracheal connections between the ears. New data show that crickets retain 1 dB to 2 dB of directionality after surgical removal of one ear, which appears to be adequate for localization tasks in simplified laboratory tasks (Michelsen, 1998).
Auditory Scene Analysis
Auditory scene analysis involves the organization of complex acoustic events that allows the listener to identify and track sound sources in the environment. For example, at the symphony individuals in the audience may be able to hear out separate instruments or differentiate between music played from different sections of the orchestra. At the same time, each listener may also track a melody that is carried by many different sections of the orchestra together. In effect, the listener groups and segregates sounds, according to similarity or differences in pitch, timbre, spatial location, and temporal patterning, to organize perceptually the acoustic information from the auditory scene. In animal communication systems, auditory scene analysis allows an individual to segregate and interpret the acoustic signals of conspecifics that may overlap other environmental signals in frequency and time. The same principle holds for identifying and tracking the signals produced by predators. Auditory scene analysis thus allows the listener to make sense of dynamic acoustic events in a complex auditory world (Bregman, 1990), which is essential to the lives of all hearing animals.
Only recently have studies of animal auditory perception examined the principles of scene analysis in nonhuman species. Experiments with European starlings (Braaten & Hulse, 1993; Hulse, MacDougall-Shackleton, & Wisniewski, 1997; MacDougall-Shackleton, Hulse, Gentner, & White, 1998) and goldfish (Fay, 1998, 2000) have demonstrated that spectral and temporal features of acoustic patterns influence the perceptual organization of sound in these animals. Using conditioning and generalization procedures, these researchers provided empirical evidence that both fish and birds can hear out complex acoustic patterns into auditory streams. The use of biologically relevant stimuli in the study of auditory scene analysis has not been widely applied, but this approach was adopted by Wisniewski and Hulse (1997), who examined the European starling’s perception of conspecific song and found evidence for stream segregation of biologically relevant acoustics in this bird species. Neurophysiological studies have also recently begun to examine the neural correlates of scene analysis in the primate auditory system (Fishman, Reser, Arezzo, & Steinschneider, 2001). Although the detection, discrimination, and localization of signals lay the building blocks for audition, it is clear that auditory systems across the phylogenetic scale must also organize this information for scene analysis to support species-specific acoustic behaviors that are central to social behaviors and predator evasion.
Summary and Conclusions
This research paper takes a comparative approach in its review of neurophysiological, anatomical, and behavioral studies of auditory systems. Selective pressures to encode the salient features of the auditory stream have produced a suite of convergent physiological and morphological features that contribute to auditory coding. All auditory systems, from those of insects to those of mammals, are organized along similar lines, with peripheral mechanisms responsive to acoustic vibrations that serve to activate neurons in the ascending
auditory pathway. Most auditory systems also contain efferent systems that can modulate activity in the periphery and stations of the ascending pathway. It is also noteworthy that both invertebrate and vertebrate auditory systems appear to use comparable neural codes to carry information about sound source spectrum, amplitude, and location in space.
Behavioral studies of auditory systems reveal many common patterns across species. For example, hearing occurs over a restricted frequency range, often spanning several octaves. Absolute hearing sensitivity is highest over a limited frequency band, typically of biological importance to the animal, and this low-threshold region is commonly flanked by regions of reduced sensitivity at neighboring frequencies. Absolute frequency discrimination generally decreases with an increase in sound frequency, as does frequency selectivity. Some animals, however, show specializations in hearing sensitivity and frequency selectivity for biologically relevant sounds, with two regions of high sensitivity or frequency selectivity. Often, but not always, the specializations for sound processing can be traced to adaptations in the auditory periphery.
In sum, this research paper reviewed the basic organization of the auditory systems in a host of animal species. We detailed the anatomical and physiological features of the auditory system and described how these features support a broad range of acoustic behaviors. We presented data from auditory generalists and specialists to illustrate both common principles and species-specific adaptations for acoustic communication, sound source localization, predator evasion, and echolocation. The topic of this review is so broad that we also attempted to provide some direction for individuals who wish to read more in-depth coverage of research in comparative studies of audition.
Bibliography:
- Altschuler, R. D., Hoffman, D., Bobbin, D., & Clopton, B. (Eds.). (1991). Neurobiology of hearing: Vol. 3: The central auditory system. New York: Raven Press.
- Autrum, H. (1940). Über Lautäusserungen und Schallwahrnehmung bei Arthoropoden. II. Das Richtungshören von Locusta und Versuch einer Hörtheorie für Tympanalorgane vom Locustidentyp. Zeitschrift fur Vergleichende Physiologie, 28, 326–352.
- Bailey, W. J., & Thomson, P. (1977). Acoustic orientation in the cricket Teleogryllus oceanicus (Le Guillou). Journal of Experimental Biology, 67, 61–75.
- Batteau, D. W. (1967). The role of the pinna in human localization. Proceedings of the Royal Society of London, 168B, 158–180.
- Beitel, R. E. (1991). Localization of azimuthal sound direction by the great horned owl. Journal of the Acoustical Society of America, 90, 2843–2846.
- Békésy, G. von. (1960). Experiments in hearing. New York: McGraw-Hill.
- Beranek, L. (1988). Acoustical measurements. New York: Acoustical Society of America Publication.
- Berrebi,A. S., & Mugnaini, E. (1991). Distribution and targets of the cartwheel cell axon in the dorsal cochlear nucleus of the guinea pig. Anatomy and Embryology, Berlin, 183(5), 427–454.
- Bottjer, S. W., & Johnson, F. (1997). Circuits, hormones, and learning: Vocal behavior in songbirds. Journal of Neurobiology, 33, 602–618.
- Braaten, R. F., & Hulse, S. H. (1993). Perceptual organization of temporal patterns in European starlings (Sturnus vulgaris). Perception and Psychophysics, 54, 567–578.
- Brainard, M. S., & Doupe, A. J. (2000). Auditory feedback in learning and maintenance of vocal behaviour. Nature Reviews. Neuroscience, 1(1), 31–40.
- Bregman, A. S. (1990). Auditory scene analysis: The perceptual organization of sound. Cambridge, MA: MIT Press.
- Brenowitz, E. A., Margoliash, D., & Nordeen, K. W. (1997). An introduction to birdsong and the avian song system. Journal of Neurobiology, 33, 495–500.
- Brown, C. H., Schessler, T., Moody, D., & Stebbins, W. (1982). Vertical and horizontal sound localization in primates. Journal of the Acoustical Society of America, 72, 1804–1811.
- Brugge, J. (1992). An overview of central auditory processing. In A. N. Popper & R. R. Fay (Eds.), The mammalian auditory pathway: Neurophysiology (pp. 1–33). New York: Springer-Verlag.
- Burda, H., & Voldrich, L. (1980). Correlations between hair cell density and auditory threshold in the white rat. Hearing Research, 3, 91–93.
- Capranica, R. R. (1976). Morphology and physiology of the auditory system. In R. Llinás & W. Precht (Eds.), Frog neurobiology (pp. 551–575). New York: Springer-Verlag.
- Capranica, R. R., & Moffat, A. M. (1983). Neurobehavioral correlates of sound communication in anurans. In J. P. Ewert, R. R. Capranica, & D. J. Ingle (Eds.), Advances in vertebrate neuroethology (pp. 701–730). New York: Plenum Press.
- Carr, C. E. (1992). Evolution of the central auditory system in reptiles and birds. In D. B. Webster, R. R. Fay, & A. N. Popper (Eds.), The evolutionary biology of hearing (pp. 511–543). New York: Springer-Verlag.
- Carr, C. E., & Code, R. A. (2000). The central auditory system of reptiles and birds. In R. J. Dooling, R. R. Fay, & A. N. Popper (Eds.), Comparative hearing: Birds and reptiles (pp. 197–248). New York: Springer-Verlag.
- Carr, C. E., & Konishi, M. (1990). A circuit for detection of interaural time differences in the brainstem of the barn owl. Journal of Neuroscience, 10, 3227–3246.
- Casseday, J. H., & Covey, E. (1996). A neuroethological theory of the operation of the inferior colliculus. Brain, Behavior, and Evolution, 147, 311–336.
- Casseday, J. H., & Neff, W. D. (1975). Auditory localization: Role of auditory pathways in brain stem of the cat. Journal of Neurophysiology, 38, 842–858.
- Chapman, C. J., & Johnstone, A. D. F. (1974). Some auditory discrimination experiments on marine fish. Journal of Experimental Biology, 61, 521–528.
- Chambers, R. E. (1971). Sound localization in the hedgehog (Paraechinus hypomelas). Unpublished doctoral dissertation, Florida State University, Tallahassee.
- Clack, J. A. (1997). The evolution of tetrapod ears and the fossil record. Brain, Behavior, and Evolution, 50, 198–212.
- Code, R. A. (1997). The avian cochlear efferent system. Poultry and Avian Biology: Reviews, 8(1), 1–8.
- Conlee, J. W., & Parks, T. N. (1986). Origin of ascending auditory projections to the nucleus mesencephalicus lateralis pars dorsalis in the chicken. Brain Research, 367, 96–113.
- Costalupes, J. A. (1983). Broadband masking noise and behavioral pure tone thresholds in cats. Journal of the Acoustical Society of America, 74, 758–764.
- Crawford, A. C., & Fettiplace, R. (1980). The frequency selectivity of auditory nerve fibers and hair cells in the cochlea of the turtle. Journal of Physiology, 306, 79–125.
- Crawford, J. D. (1997). Feature-detecting auditory neurons in the brain of a sound producing fish. Journal of Comparative Physiology, 180, 439–450.
- Dallos, P. (1970). Low-frequency auditory characteristics: Species dependence. Journal of the Acoustical Society of America, 48(2), 489–499.
- Dallos, P. (1973). The auditory periphery: Biophysics and physiology. New York: Academic Press.
- Dallos, P. (1996). Overview: Cochlear neurobiology. In P. Dallos, A. N. Popper, & R. R. Fay (Eds.), The cochlea (pp. 1–43). New York: Springer-Verlag.
- de Rebaupierre, F. (1997). Acoustical information processing in the auditory thalamus and cerebral cortex. In G. Ehret & R. Romand (Eds.), The central auditory system (pp. 317–398). New York: Oxford University Press.
- Dijkgraaf,S.(1952).UberdieSchallwharnehmungbeiMeeresfishen. Zeitschrift fur Vergleichende Physiologie, 34, 104–122.
- Doherty, J. A., & Gerhardt, H. C. (1984). Evolutionary and neurobiological implications of selective phonotaxis in the spring peeper (Hyla crucifer). Animal Behavior, 32, 875–881.
- Dooling, R. J. (1980). Behavior and psychophysics of hearing in birds. In A. N. Popper & R. R. Fay (Eds.), Studies of hearing in vertebrates (pp. 261–288). New York: Springer-Verlag.
- Dooling, R. J., Lohr, B., & Dent, M. L. (2000). Hearing in birds and reptiles. In R. J. Dooling, R. R. Fay, & A. N. Popper (Eds.), Comparative hearing: Birds and reptiles (pp. 308–359). New York: Springer-Verlag.
- Dooling, R. J., Mullingan, J. A., & Miller, J. D. (1971). Auditory sensitivity and song spectrum of the common canary (Serinus canarius). Journal of the Acoustical Society of America, 50, 700–709.
- Dooling, R. J., Okanoya, K., Downing, J., & Hulse, S. (1986). Hearing in the starling (Sturnus vulgaris): Absolute thresholds and critical ratios. Bulletin of the Psychonomic Society, 24, 462–464.
- Dooling, R. J., & Saunders, J. C. (1975). Hearing in the parakeet (Melopsittacus undulatus): Absolute thresholds, critical ratios, frequency difference limens and vocalizations. Journal of Comparative and Physiological Psychology, 88, 1–20.
- Dooling, R. J., & Searcy, M. D. (1981). Amplitude modulation thresholds for the parakeet (Melopsittacus undulatus). Journal of Comparative Physiology, 143, 383–388.
- Doucet, J. R., & Ryugo, D. K. (1997). Projections from the ventral cochlear nucleus to the dorsal cochlear nucleus in rats. Journal of Comparative Neurology, 385, 245–264.
- Doupe, A. J., & Kuhl, P. K. (1999). Birdsong and human speech: Common themes and mechanisms. Annual Review of Neuroscience, 22, 567–631.
- Echteler, S. M., Fay, R. R., & Popper, A. N. (1994). Structure of the mammalian cochlea. In R. R. Fay & A. N. Popper (Eds.), Comparative hearing: Mammals (pp. 134–171). New York: Springer-Verlag.
- Egan, J. P., & Hake, H. W. (1950). On the masking pattern of a simple auditory stimulus. Journal of the Acoustical Society of America, 22, 622–630.
- Ehret, G. (1975). Masked auditory thresholds, critical ratios, and scales of the basilar membrane of the housemouse (Mus musculus). Journal of Comparative Physiology, 114, 1–12.
- Ehret, G. (1976). Critical bands and filter characteristics of the ear of the housemouse (Mus musculus). Biological Cybernetics, 24, 35–42.
- Ehret, G., & Frankenreiter, M. (1977). Quantitative analysis of cochlear structures in the house mouse in relation to mechanics of acoustical information processing. Journal of Comparative Physiology, 122, 65–85.
- Ehret, G., & Romand, R. (Eds.). (1997). The central auditory system. New York: Oxford University Press.
- Elliott, D., Stein, L., & Harrison, M. (1960). Determination of absolute intensity thresholds and frequency difference thresholds in cats. Journal of the Acoustical Society of America, 32, 380–384.
- Erwin, H., Wilson, W. W., & Moss, C. F. (2001). A computational model of sensorimotor integration in bat echolocation. Journal of the Acoustical Society of America, 110, 1176–1187.
- Fay, R. R. (1969). Behavioral audiogram for the goldfish. Journal of Auditory Research, 9, 112–121.
- Fay, R. R. (1970). Auditory frequency discrimination in the goldfish (Carassius auratus). Journal of Comparative Physiology and Psychology, 73, 175–180.
- Fay, R. R. (1974). Masking of tones by noise for the goldfish (Carassius auratus). Journal of Comparative Physiology and Psychology, 87, 708–716.
- Fay, R. R. (1978a). Coding of information in single auditory-nerve fibers of the goldfish. Journal of the Acoustical Society of America, 63, 136–146.
- Fay, R. R. (1978b). Phase locking in goldfish saccular nerve fibers accounts for frequency discrimination capacities. Nature, 275, 320–322.
- Fay, R. R. (1985). Sound intensity processing by the goldfish. Journal of the Acoustical Society of America, 78, 1296–1309.
- Fay, R. R. (1988). Hearing in vertebrates: A psychophysics databook. Winnetka, IL: Hill-Fay Associates.
- Fay, R. R. (1992). Structure and function in sound discrimination among vertebrates. In D. Webster, R. Fay, & A. Popper (Eds.), The evolutionary biology of hearing (pp. 229–263). New York: Springer-Verlag.
- Fay, R. R. (1997). Frequency selectivity of saccular afferents of the goldfish revealed by revcor analysis. In G. R. Lewis, R. F. Lyons, P. M. Nairns, C. R. Steele, & E. Hecht-Poinar (Eds.), Diversity in auditory mechanics (pp. 69–75). Singapore: World Scientific.
- Fay, R. R. (1998). Auditory stream segregation in goldfish (Carassius auratus). Hearing Research, 120, 69–76.
- Fay, R. R. (2000). Spectral contrasts underlying auditory stream segregation in goldfish (Carassius auratus). Journal of the Association for Research in Otolaryngology.
- Fay, R. R., & Edds-Walton, P. L. (2000). Directional encoding by fish auditory systems. Philosophical Transactions of the Royal Society of London, 355B, 1181–1284.
- Fay, R. R., & Popper, A. N. (1983). Hearing in fishes: Comparative anatomy of the ear and the neural coding of auditory information. In R. R. Fay & G. Gourevitch (Eds.), Hearing and other senses: Presentations in honor of E. G. Wever (pp. 123–148). Groton, CT: Amphora Press.
- Fay, R. R., & Simmons, A. M. (1999). The sense of hearing in fishes and amphibians. In R. R. Fay & A. N. Popper (Eds.), Comparative hearing: Fishes and amphibians (pp. 269–318). New York: Springer-Verlag.
- Feng, A. S., Gerhardt, H. C., & Capranica, R. R. (1976). Sound localization behavior of the green treefrog (Hyla cinerea) and the barking treefrog ( gratiosa). Journal of Comparative Physiology, 107A, 241–252.
- Feng, A. S., & Schellart, N. A. M. (1999). Central auditory processing in fish and amphibians. In R. R. Fay & A. N. Popper (Eds.), Comparative hearing: Fish and amphibians (pp. 218–268). New York: Springer-Verlag.
- Feng, A. S., & Shofner, W. P. (1981). Peripheral basis of sound localization in anurans. Acoustic properties of the frog’s ear. Hearing Research, 5, 201–216.
- Fettiplace, R., Ricci, A. J. & Hackney, C. M. (2001). Clues to the cochlear amplifier from the turtle ear. Trends in Neuroscience, 24(3), 169–175.
- Fishman, Y. I., Reser, D. H., Arezzo, J. C., & Steinschneider, M. (2001). Neural correlates of auditory stream segregation in primaryauditorycortexoftheawakemonkey.HearingResearch, 151, 167–187.
- Fitzgibbons, P. F. (1983). Temporal gap detection in noise as a function of frequency, bandwidth, and level. Journal of the Acoustical Society of America, 74, 67–72.
- Fletcher, H. (1940). Auditory patterns. Review Modern Physiology, 12, 47–65.
- Fritzch, B., Barald, K. F., & Lomax, M. I. (1998). Early embryology of the vertebrate ear. In E. W. Rubel, A. N. Popper, & R. R. Fay (Eds.), Development of the auditory system (pp. 80–145). New York: Springer-Verlag.
- Frost, B. J., Baldwin, P. J., & Csizy, M. L. (1989). Auditory localization in the northern saw-whet owl, Aegolius acadicus. Canadian Journal of Zoology, 67(8), 1955–1959.
- Fuchs, P. A. (1992). Development of frequency tuning in the auditory periphery. Current Opinions in Neurobiology, 2(4), 457–461.
- Fullard, J. H., & Barclay, R. M. R. (1980). Audition in spring species of arctiid moths as a possible response to differential levels of insectivorous bat predation. Canadian Journal of Zoology, 58, 1745–1750.
- Fuzessery, Z. M., Buttenhoff, P., Andrews, B., & Kennedy, J. M. (1993). Passive sound localization of prey by the pallid bat (Antrozous p. pallidus). Journal of Comparative Physiology, 171A, 767–777.
- Gatehouse, R. W., & Shelton, B. R. (1978). Sound localization in bobwhite quail (Colinus virginianus). Behavioral Biology, 22, 533–540.
- Geisler, D. C., & Hubbard, A. M. (1975). The compatibility of various measurements on the ear as related by a simple model. Acustica, 33, 220–222.
- Gerhardt, H. C. (1974). The significance of some spectral features in mating call recognition in the green treefrog. Nature, 261, 692–694.
- Gerhardt, H. C. (1976). Significance of two frequency bands in long distance vocal communication in the green treefrog. Nature, 261, 692–694.
- Gerhardt, H. C. (1981). Mating call recognition in the green treefrog (Hyla cinerea): Importance of two frequency bands as a function of sound pressure level. Journal of Comparative Physiology, 144, 9–16.
- Gerhardt, H. C., & Rheinlaender, J. (1980). Accuracy or sound localization in a miniature dendrobatid frog. Naturwissenschaften, 67, 362–363.
- Gleich, O., & Manley, G. A. (2000). The hearing organ of birds and crocodilia. In R. J. Dooling, R. R. Fay, & A. N. Popper (Eds.), Comparative hearing: Birds and reptiles (pp. 70–138). New York: Spring-Verlag.
- Gourevitch, H. C. (1965). Auditory masking in the rat. Journal of the Acoustical Society of America, 37, 439–443.
- Greenwood, D. D. (1961a). Auditory masking and the critical band. Journal of the Acoustical Society of America, 33, 484–502.
- Greenwood, D. D. (1961b). Critical bandwidth and the frequency coordinates of the basilar membrane. Journal of the Acoustical Society of America, 33, 1344–1356.
- Griffin, D. (1958). Listening in the dark. New Haven, CT: Yale University Press.
- Guild, S. R., Crowe, S. J., Bunch, C. C., & Polvogt, L. L. (1931). Correlations of differences in the density of innervation of the organ of Corti with differences in the acuity of hearing, including evidence as to the location in the human cochlea of the receptors for certain tones. Acta oto-laryngologica, 15, 269–308.
- Guinan, J. J., & Peake, W. T. (1967). Middle-ear characteristics of anesthetized cats. Journal of the Acoustical Society of America, 41, 1237–1261.
- Hawkins, A. D., & Chapman, C. J. (1975). Masked auditory thresholds in the cod, Gadus morhua L. Journal of Comparative Physiology, 103, 209–226.
- Hawkins A. D., & Johnstone, A. D. F. (1978). The hearing of the Atlantic salmon, Salmo salar. Journal of Fish Biology, 13, 655–673.
- Hawkins, J., & Stevens, S. (1950). The masking of pure tones and of speech by white noise. Journal of the Acoustical Society of America, 22, 6–13.
- Heffner, H. E., & Masterton, B. (1980). Hearing in Glires: Domestic rabbit, cotton rat, house mouse, and kangaroo rat. Journal of the Acoustical Society of America, 68, 1584–1599.
- Heffner, R. S., & Heffner, H. E. (1982). Hearing in the elephant (Elephas maximus): Absolute sensitivity, frequency discrimination, and sound localization. Journal of Comparative Psychology, 96, 926–944.
- Heffner, R. S., & Heffner, H. E. (1984). Sound localization in large mammals: Localization of complex sounds by horses. Behavioral Neuroscience, 98, 541–555.
- Heffner, R. S., & Heffner, H. E. (1985). Hearing range of the domestic cat. Hearing Research, 19, 85–88.
- Heffner, R. S., & Heffner, H. E. (1992). Evolution of sound localization in mammals. In D. B. Webster, R. R. Fay, & A. N. Popper (Eds.), The evolutionary biology of hearing (pp. 691–716). New York: Springer-Verlag.
- Heffner, R. S., Heffner, H. E., & Koay, G. (1995). Sound localization in chinchillas: II. Front/back and vertical localization. Hearing Research, 88, 190–198.
- Heffner, R. S., Heffner, H. E., & Koay, G. (1996). Sound localization in chinchillas: III. Effect of pinna removal. Hearing Research, 99, 13–21.
- Heffner, R., Heffner, H., & Masterton, R. B. (1971). Behavioral measurement of absolute and frequency difference thresholds in guinea pig. Journal of the Acoustical Society of America, 49, 1888–1895.
- Heffner, R. S., & Masterton, B. (1978). Contribution of auditory cortex to hearing in the monkey (Macaca mulatta). In D. J. Chivers & J. Herbert (Eds.), Recent advances in primatology (Vol. 1, pp. 735–754). New York: Academic Press.
- Heinz, R. D., Sinnott, J. M., & Sachs, M. B. (1977). Auditory sensitivity of the red-winged blackbird (Agelauis phoeniceus) and brown-head cowbird (Molothrus ater). Journal of Comparative Physiology and Psychology, 91, 1365–1376.
- Helfert, R., & Aschoff, A. (1997). Superior olivary complex and nuclei of the lateral lemniscus. In G. Ehret & R. Romand (Eds.), The central auditory system (pp. 193–258). New York: Oxford University Press.
- Henderson, D., Salvi, R., Pavek, G., & Hamernik, R. P. (1984). Amplitude modulation thresholds in chinchillas with highfrequency hearing loss. Journal of the Acoustical Society of America, 75, 1177–1183.
- Hillery, C. M., & Narins, P. M. (1984). Neurophysiological evidence for a traveling wave in the amphibian inner ear. Science, 225, 1037–1039.
- Hoy, R. R., Popper, A. N., & Fay, R. R. (1998). Comparative hearing: Insects. New York: Springer.
- Hudspeth, A. J., Choe, Y., Mehta, A. D., & Martin, P. (2000). Putting ion channels to work: Mechanoelectrical transduction, adaptation, and amplification by hair cells. Proceedings of the National Academy of Sciences, USA, 97(22), 11765–11772.
- Hulse, S. H., MacDougall-Shackleton, S. A., & Wisniewski, A. B. (1997). Auditory scene analysis by songbirds: Stream segregation of birdsong by European starlings (Sturnus vulgaris). Journal of Comparative Psychology, 111, 3–13.
- Imaizumi, K., & Pollack, G. S. (1999). Neural coding of sound frequency by cricket auditory receptors. Journal of Neuroscience, 19, 1508–1516.
- Imig, T., & Morel, A. (1988). Organization of the cat’s auditory thalamus. In G. M. Edelman, W. E. Gall, & W. M. Cowan (Eds.), Auditory function: Neurobiological bases of hearing (pp. 457–484). New York: Wiley.
- Ison, J. R. (1982). Temporal acuity in auditory function in the rat: Reflex inhibition by brief gaps in noise. Journal of Comparative and Physiological Psychology, 96, 945–954.
- Jeffress, L. A. (1970). Masking. In J. V. Tobias (Ed.), Foundations of modern auditory theory (Vol. 1, pp. 85–114). New York: Academic Press.
- Jesteadt, W., Bacon, S., & Lehman, J. R. (1982). Forward masking as a function of frequency, masker level, and signal delay. Journal of the Acoustical Society of America, 71, 950–962.
- Johnson, C. S. (1967). Sound detection thresholds in marine mammals. In W. N. Tavolga (Ed.), Marine bio-acoustics (Vol. 2, pp. 247–260). Oxford, UK: Pergamon.
- Johnson, C. S. (1968). Masked tonal thresholds in the bottle-nosed porpoise. Journal of the Acoustical Society of America, 44, 965–967.
- Jø´rgenson, M. B., & Gerhardt, H. C. (1991). Directional hearing in the gray tree frog Hyla versicolor eardrum vibrations and phonotaxis. Journal of Comparative Physiology, 169A, 177– 183.
- Joris, P. X., Smith, P. H., & Yin, T. C. (1998). Coincidence detection in the auditory system: 50 years after Jeffress. Neuron, 21, 1235–1238.
- Karten, H. J., & Shimizu, T. (1989). The origins of neocortex: Connections and lamination as distinct events in evolution. Journal of Cognitive Neuroscience, 1, 291–301.
- Klump, G. M. (2000). Sound localization in birds. In R. J. Dooling, R. R. Fay, & A. N. Popper (Eds.), Comparative hearing: Birds and reptiles (pp. 249–307). New York: Springer-Verlag.
- Klump, G. M., & Maier, E. H. (1989). Gap detection in the starling (Sturnus vulgaris): I. Psychophysical thresholds. Journal of Comparative Physiology, 164, 531–538.
- Klump, G. M., Windt, W., & Curio, E. (1986). The great tit’s (Parus major) auditory resolution in azimuth. Journal of Comparative Physiology, 158, 383–390.
- Knudsen, E. I. (1980). Sound localization in birds. In A. N. Popper & R. R. Fay (Eds.), Comparative studies of hearing in vertebrates (pp. 287–322). Berlin: Springer-Verlag.
- Knudsen, E. I., du Lac, S., & Esterly, S. D. (1987). Computational maps in the brain. Annual Review of Neuroscience, 10, 41–65.
- Knudsen, E. I., & Konishi, M. (1979). Mechanisms of sound localizations in the barn owl (Tyto alba). Journal of Comparative Physiology, 133, 13–21.
- Koay, G., Kearns, D., Heffner, H. E., & Heffner, R. S. (1998). Passive sound-localization ability of the big brown bag (Eptesicus fuscus). Hearing Research, 119, 37–48.
- Konishi, M. (1970). Comparative neurophysiological studies of hearing and vocalization in songbirds. Journal of Comparative Physiology, 66, 257–272.
- Konishi, M. (1973). How the owl tracks its prey. American Scientist, 61, 414–424.
- Konishi, M. (1985). Birdsong: From behavior to neuron. Annual Review of Neuroscience, 8, 125–170.
- Konishi, M. (1986). Centrally synthesized maps of sensory space. Trends in Neuroscience, 9, 163–168.
- Konishi, M. (2000). Study of sound localization by owls and its relevance to humans. Comparative Biochemistry & Physiology, 126, 459–469.
- Köppl, C., Carr, C. E., & Soares, D. (2001). Diversity of response patterns in the cochlear nucleus angularis (NA) of the barn owl. Association for Research Otolaryngology Abstract, 21,
- Köppl, C., & Manley, G. A. (1992). Functional consequences of morphological trends in the evolution of lizard hearing organs. In D. B. Webster, R. R. Fay, & A. N. Popper (Eds.), The evolutionary biology of hearing (pp. 489–510). New York: Springer-Verlag.
- Krubitzer, L., Kunzle, H., & Kaas, J. (1997). Organization of sensory cortex in a Madagascan insectivore, the tenrec (Echinops telfairi). Journal of Comparative Neurology, 379, 399–414.
- Kühne, R., & Lewis, B. (1985). External and middle ears. In A. S. King & J. McLelland (Eds.), Form and function in birds (Vol. 3, pp. 227–271). London: Academic Press.
- Kuwada, S., Batra, R., & Fitzpatrick, D. C. (1997). Neural processing of binaural temporal cues. In R. H. Gilkey & T. R. Andersen (Eds.), Binaural and spatial hearing (pp. 399–425). Hillsdale, NJ: Erlbaum.
- Latimer, W., & Lewis, D. B. (1986). Song harmonic content as a parameter determining acoustic orientation behavior in the cricket Teleogryllus oceanicus (Le Guillou). Journal of Comparative Physiology, 158A, 583–591.
- Lawrence, B. D., & Simmons, J. A. (1982). Echolocation in bats: The external ear and perception of the vertical positions of targets. Science, 218, 481–483.
- Lewis, E. R., Baird, R. A., Leverenz, E. L., & Koyama, H. (1982). Inner ear: Dye injection reveals peripheral origins of specific sensitivities. Science, 215, 1641–1643.
- Lewis, E. R., Leverenz, E. L., & Koyama, H. (1982). The tonatopic organization of the bullfrog amphibian papilla, an auditory organ lacking a basilar membrance. Journal of Comparative Physiology, 145, 437–445.
- Lewis, E. R., & Narins, P. M. (1999). The acoustic periphery of amphibians: Anatomy and physiology. In R. R. Fay & A. N. Popper (Eds.), Comparative hearing: Fish and amphibians (pp. 101–154). New York: Springer-Verlag.
- Liberman, M. C. (1982). The cochlear frequency map for the cat: Labeling auditory-nerve fibers of known characteristic frequency. Journal of the Acoustical Society of America, 72, 1441–1449.
- Long, G. R. (1977). Masked auditory thresholds from the bat, Rhinolophus ferrumequinum. Journal of Comparative Physiology, 100, 211–220.
- Long, G. R., & Schnitzler, H. U. (1975). Behavioral audiograms from the bat (Rhinolophus ferrumequinum). Journal of Comparative Physiology, 100, 211–219.
- MacDougall-Shackleton, S. A., Hulse, S. H., Gentner, T. Q., & White, W. (1998). Auditory scene analysis by European starlings (Sturnus vulgaris): Perceptual segregation of tone sequences. Journal of the Acoustical Society of America, 103, 3581–3587.
- Manley, G. A. (1972). A review of some current concepts of the functional evolution of the ear in terrestrial vertebrates. Evolution, 26, 608–621.
- Manley, G.A. (2000).The hearing organs of lizards. In R. J. Dooling, R. R. Fay, & A. N. Popper (Eds.), Comparative hearing: Birds and reptiles (pp. 139–196). New York: Springer-Verlag.
- Mann, D. A., Lu, Z., Hastings, M. C., & Popper, A. N. (1998). Detection of ultrasonic tones and simulated dolphin echolocation clicks by a teleost fish, the American Shad (Alosa sapidissima). Journal of the Acoustical Society of America, 104(1), 562–568.
- Margoliash, D. (1997). Functional organization of forebrain pathways for song production and perception. Journal of Neurobiology, 33, 671–693.
- Margoliash, D., & Konishi, M. (1985). Auditory representation of autogenous song in the song system of white crowned sparrows. Proceedings of the National Academy of Sciences, USA, 82, 5997–6000.
- Martin, R. L., & Webster, W. R. (1987). The auditory spatial acuity of the domestic cat in the interaural horizontal and median vertical planes. Hearing Research, 30, 239–252.
- Masters, W. M., Moffat, A. J. M., & Simmons, J. A. (1985). Sonar tracking of horizontally moving targets by the big brown bat Eptesicus fuscus. Science, 228,
- Masterton, B., Heffner, H., & Ravizza, R. (1969). The evolution of human hearing. Journal of the Acoustical Society of America, 45, 966–985.
- May, B. J. (2000). Role of the dorsal cochlear nucleus in the sound localization behavior of cats. Hearing Research, 148, 74–87.
- McCormick, C. A. (1999). Anatomy of the central auditory pathways of fish and amphibians. In R. R. Fay & A. N. Popper (Eds.), Comparative hearing: Fish and amphibians (pp. 155–217). New York: Springer-Verlag.
- Megela, A. L. (1984). Diversity of adaptation patterns in responses of eighth nerve fibers in the bullfrog, Rana catesbeiana. Journal of the Acoustical Society of America, 75, 1155–1162.
- Megela-Simmons, A. (1988). Masking patterns in the bullfrog (Rana catesbeiana): I. Behavioral effects. Journal of the Acoustical Society of America, 83, 1087–1092.
- Megela-Simmons, A., Moss, C. F., & Daniel, K. M. (1985). Behavioral audiograms of the bullfrog (Rana catesbeiana) and the green treefrog (Hyla cinerea). Journal of the Acoustical Society of America, 78, 1236–1244.
- Michelsen, A. M. (1966). Pitch discrimination in the locust ear: Observations on single sense cells. Journal of Insect Physiology, 12, 1119–1131.
- Michelsen, A. M. (1992). Hearing and sound communication in small animals: Evolutionary adaptations to the laws of physics. In D. B. Webster, R. R. Fay, & A. N. Popper (Eds.), The evolutionary biology of hearing (pp. 61–77). New York: Springer-Verlag.
- Michelsen,A.M.(1998).Biophysicsofsoundlocalizationininsects. In R. R. Hoy, A. N. Popper, & R. R. Fay (Eds.), Comparative hearing: Insects (pp. 18–62). New York: Springer-Verlag.
- Michelsen, A. M., Jorgenson, M., Christensen-Dalsgaard, J., & Capranica, R. R. (1986). Directional hearing of awake, unrestrained treefrogs. Naturwissenschaften, 73, 682–683.
- Miller, J. D. (1964). Auditory sensitivity of the chinchilla. Journal of the Acoustical Society of America, 36,
- Miller, L. A. (1970). Structure of the green lacewing tympanal organ (Chrysopa carnca, Neuroptera). Journal of Morphology, 181, 359–382.
- Miller, L. A. (1975). The behaviour of flying green lacewings, Chrysopa carnea, in the presence of ultrasound. Journal of Insect Physiology, 21, 205–219.
- Miller, L. A. (1983). How insects detect and avoid bats. In F. Huber & H. Markl (Eds.), Neuroethology and behavioral physiology (pp. 251–266). Berlin: Springer.
- Miller, L. A. (1984). Hearing in green lacewings and their responses to the cries of bats. In M. Canard, Y. Séméria, & T. R. New (Eds.), Biology of chysopidae (pp. 134–149). Boston: W. Junk.
- Miller, M. R. (1980). The reptilian cochlear duct. In A. N. Popper & R. R. Fay (Eds.), Comparative studies of hearing in vertebrates (pp. 169–204). Berlin: Springer Verlag.
- Mills, A. W. (1958). On the minimum audible angle. Journal of the Acoustical Society of America, 30, 237–246.
- Moiseff, A. (1989). Bi-coordinate sound localization by the barn owl. Journal of Comparative Physiology, 64A, 637–644.
- Moiseff, A., Pollack, G. S., & Hoy, R. R. (1978). Steering responses of flying crickets to sound and ultrasound: Mate attraction and predator avoidance. Proceedings of the National Academy of Sciences, USA, 75(8), 4052–4056.
- Møller, A. R. (1983). Auditory physiology. New York: Academic Press.
- Moore, B. C. J. (1978). Psychophysical tuning curves measured in simultaneous and forward masking. Journal of the Acoustical Society of America, 63, 524–532.
- Moore, P. W. B. (1975). Underwater localization of pulsed pure tones by the California sea lion (Zalophus californianus). Journal of the Acoustical Society of America, 58, 721–727.
- Moss, C. F., & Schnitzler, H.-U. (1995). Behavioral studies of auditory information processing. In A. N. Popper & R. R. Fay (Eds.), Hearing by bats (pp. 87–145). Berlin: Springer-Verlag.
- Moss, C. F., & Simmons, A. M. (1986). Frequency selectivity of hearing in the green treefrog, Hyla cinerea. Journal of Comparative Physiology, 159, 257–266.
- Narins, P. M., & Capranica, R. R. (1978). Communicative significance of the two-note call of the treefrog Eleutherodactylus coqui. Journal of Comparative Physiology, 127A, 1–9.
- Nedzelnitsky, V. (1980). Sound pressures in the basal turn of the cochlea. Journal of the Acoustical Society of America, 68, 1676–1689.
- Neuweiler, G., Bruns, V., & Schuller, G. (1980). Ears adapted for the detection of motion, or how echolocating bats have exploited the capacities of the mammalian auditory system. Journal of the Acoustical Society of America, 68, 741–753.
- Nolen, T. G., & Hoy, R. R. (1987). Postsynaptic inhibition mediates high-frequency selectivity in the cricket Teleogryllus oceanicus: Implications for flight phonotaxis behavior. Journal of Neuroscience, 7, 2081–2096.
- Nottebohm, F. (1980). Brain pathways for vocal learning in birds: A review of the first 10 years. Progressive Pyschobiology Physiology Psychology, 9, 85–124.
- Oertel, D. (1999). The role of timing in the brainstem auditory nuclei. Annual Review of Physiology, 61, 497–519.
- Oertel, D., Bal, R., Gardner, S. M., Smith, P. H., & Joris, P. X. (2000). Detection of synchrony in the activity of auditory nerve fibers by octopus cells of the mammaliancochlear nucleus. Proceedings of the National Academy of Sciences, USA, 97(22), 11773–11779.
- Okanoya, K., & Dooling, R. J. (1987). Hearing in passerine and psittacine birds: A comparative study of absolute and masked auditory thresholds. Journal of Comparative Psychology, 101, 7–15.
- Oldfield, B. P., Kleindienst, H. U., & Huber, F. (1986). Physiology and tonotopic organization of auditory receptors in the cricket Gryllus bimaculatus Journal of Comparative Physiology, 159A, 457–464.
- Oliver, D., & Huerta, M. (1992). Inferior and superior colliculi. In D. B. Webster, A. N. Popper, & R. R. Fay (Eds.), The mammalian auditory pathway: Neuroanatomy (pp. 169–221). New York: Springer-Verlag.
- Olsen, J. F., & Suga, N. (1991). Combination-sensitive neurons in the medial geniculate body of the mustached bat: Encoding of target range information. Journal of Neurophysiology, 65, 1275–1296.
- Park, T. J., & Dooling, R. J. (1991). Sound localization in small birds: Absolute localization in azimuth. Journal of Comparative Psychology, 105(2), 25–133.
- Parks, T. N. (2000). The AMPAreceptors of auditory neurons. Hearing Research, 147, 77–91.
- Passmore, N. I., Capranica, R. R., Telford, S. R., & Bishop, P. J. (1984). Phonotaxis in the painted reed frog (Hyperolius marmoratus).JournalofComparativePhysiology,154,189–197.
- Payne, R. S. (1971). Acoustic location of prey by barn owls (Tyto alba). Journal of Experimental Biology, 54, 535–573.
- Payne, R. S., Roeder, K. D., & Wallman, J. (1966). Directional sensitivity of the ears of noctuid moths. Journal of Experimental Biology, 44, 17–31.
- Payne, K. B., Langbauer, W. R., Jr., & Thomas, E. M. (1986). Infrasonic calls of the Asian elephant (Elephas maximus). Behavior Ecology and Sociobiology, 18, 297–301.
- Peña, J. L., Viete, S., Albeck, Y., & Konishi, M. (1996). Tolerance to sound intensity of binaural coincidence detection in the nucleus laminaris of the owl. Journal of Neuroscience, 16, 7046–7054.
- Pickles, J. O. (1975). Normal critical bands in the cat. Acta otolaryngology, 80, 245–254.
- Pickles, J. O., & Comis, S. D. (1976). Auditory-nerve fiber bandwidths and critical bandwidths in the cat. Journal of the Acoustical Society of America, 60, 1151–1156.
- Pierce, A. D. (1989). Acoustics: An introduction to its physical principles and applications. New York: Acoustical Society of America.
- Pollack, G. S. (1998). Neural processing of acoustic signals. In R. R. Hoy, A. N. Popper, & R. R. Fay (Eds.), Comparative hearing: Insects (pp. 139–196). New York: Springer-Verlag.
- Popper, A. N. (1970). Auditory capacities of the Mexican blind cave fish (Astyanax jordani) and its eyed ancestor (Astyanax mexicanus). Animal Behavior, 18, 552–562.
- Popper, A. N., & Fay, R. R. (1999). The auditory periphery in fishes. In R. R. Fay & A. N. Popper (Eds.), Comparative hearing: Fishes and amphibians (pp. 139–198). New York: Springer-Verlag.
- Price, L. L., Dalton, L. W., Jr., & Smith, J. C. (1967). Frequency DL in the pigeon as determined by conditioned suppression. Journal of Auditory Research, 7, 229–239.
- Proctor, L., & Konishi, M. (1997). Representation of sound localization cues in the auditory thalamus of the barn owl. Proceedings of the National Academy of Sciences, USA, 94, 10421– 10425.
- Puelles, L., Robles, C., Martinez-de-la-Torre, M., & Martinez, S. (1994). New subdivision schema for the avian torus semicircularis: Neurochemical maps in the chick. Journal of Comparative Neurology, 340, 98–125.
- Quine, D. B., & Konishi, M. (1974). Absolute frequency discrimination in the barn owl. Journal of Comparative and Physiological Psychology, 94, 401–415.
- Quine, D. B., & Kreithen, M. L. (1981). Frequency shift discrimination: Can homing pigeons locate infrasounds by doppler shifts? Journal of Comparative Physiology, 141, 153–155.
- Ravicz, M. E., Rosowski, J. J., & Voigt, H. F. (1992). Sound power collection by the auditory periphery of the Mongolian gerbil Meriones unguiculatus: Middle ear input impedance. Journal of the Acoustical Society of America, 92, 157–177.
- Ravizza, R. J., & Masterton, B. (1972). Contribution of neocortex to sound localization in opossum (Didelphis virginiana). Journal of Neurophysiology, 35, 344–356.
- Renaud, D. L., & Popper, A. N. (1975). Sound localization by the bottlenose purpoise Tursiops truncatus. Journal of Experimental Biology, 63, 569–585.
- Rheinlaender, J., Gerhardt, H. C., Yager, D. D., & Capranica, R. R. (1979). Accuracy of phonotaxis by the green treefrog (Hyla cinerea). Journal of Comparative Physiology, 133, 247– 255.
- Rhode, W. S., & Greenberg, S. (1992). Physiology of the cochlear nuclei. In A. N. Popper & R. R. Fay (Eds.), The mammalian auditory pathway: Neurophysiology (pp. 53–120). Heidelberg, Germany: Springer-Verlag.
- Rice, W. R. (1982). Acoustical location of prey by the marsh hawk: Adaptation to concealed prey. The Auk, 99(3) 403–413.
- Roberts, B. L., & Meredith, G. E. (1992). The efferent innervation of the ear: Variations on an enigma. In D. B. Webster, R. R. Fay, & A. N. Popper (Eds.), The evolutionary biology of hearing (pp. 185–210). New York: Springer-Verlag.
- Roeder, K. D., & Treat, A. E. (1957). Ultrasonic reception by the lympanic organ of noctuid moths. Journal of Experimental Zoology, 134, 127–158.
- Roeder, K. D., Treat, A. E., & Vandeberg, J. S. (1970). Auditory sensation in certain hawkmoths. Science, 159, 331–333.
- Rosowski, J. J. (1994). Outer and middle ears. In R. R. Fay & A. N. Popper (Eds.), Comparative hearing: Mammals (pp. 172–247). New York: Springer-Verlag.
- Rouiller, E. (1997). Functional organization of auditory pathways. In G. Ehret & R. Romand (Eds.), The central auditory system (pp. 3–96). New York: Oxford University Press.
- Rubel, E. W., & Parks, T. N. (1988). Organization and development of the avian brainstem auditory system. In G. M. Edelman, W. E. Gall, & W. M. Cowan (Eds.), Auditory function: Neurobiological bases of hearing (pp. 3–92). New York: Wiley.
- Ryan, A. (1976). Hearing sensitivity of the mongolian gerbil, Meriones unguiculatus. Journal of the Acoustical Society of America, 59, 1222–1226.
- Ryan, M. J. (1983). Sexual selection and communication in a neotropical frog, Physalaemus pustulosus. Evolution, 37, 261–272.
- Ryugo, D. K. (1993). The auditory nerve: Peripheral innervation, cell body morphology and central projections. In D. B. Webster, A. N. Popper, & R. R. Fay (Eds.), The mammalian auditory pathway: Neuroanatomy (pp. 23–65). New York: SpringerVerlag.
- Sachs, M. B., & Abbas, P. J. (1974). Rate versus level functions for auditory-nerve fibers in cats: Tone-burst stimuli. Journal of the Acoustical Society of America, 56, 1835–1847.
- Salvi, R. J., & Arehole, S. (1985). Gap detection in chinchillas with temporary high-frequency hearing loss. Journal of the Acoustical Society of America, 77, 1173–1177.
- Salvi, R. J., Giraudi, D. M., Henderson, D., & Hamernik, R. P. (1982). Detection of sinusoidal amplitude modulated noise by the chinchilla. Journal of the Acoustical Society of America, 71, 424–429.
- Saunders, J. C., Denny, R. M., & Bock, G. R. (1978). Critical bands in the parakeet (Melopsittacus undulatus). Journal of Comparative Physiology, 125, 359–365.
- Scharf, B. (1970). Critical bans. In J. V. Tobias (Ed.), Foundations of modern auditory theory (pp. 159–202). New York: Academic Press.
- Scheich, H., Langer, G., & Bonke, D. (1979). Responsiveness of units in the auditory neostriatum of the guinea fowl (Numida meleagris) to species specific calls and synthetic stimuli: II. discrimination of iambus-like calls. Journal of Comparative Physiology, 32, 257–276.
- Schuijf, A. (1975). Directional hearing of cod (Gadus morhua) under approximate free field conditions. Journal of Comparative Physiology, 98, 307–332.
- Schwartz, J. J., & Wells, K. D. (1984). Interspecific acoustic interactions of the neotropical treefrog, Hyla ebraccata. Behavior Ecology Sociobiology, 14, 211–224.
- Simmons, J. A., Kick, S. A., Lawrence, B. D., Hale, C., Bard, C., & Escudie, B. (1983). Acuity of horizontal angle discrimination by the echolocating bat, Eptesicus fuscus. Journal of Comparative Physiology, 153A, 321–330.
- Sivian, L. J., & White, S. J. (1933). On minimum audible sound fields. Journal of the Acoustical Society of America, 4, 288–321.
- Small, A. M., Jr. (1959). Pure-tone masking. Journal of the Acoustical Society of America, 31, 1619–1625.
- Spangler, H. G. (1988). Hearing in tiger beetles (Cicindelidae). Physiogical Entomology, 13, 447–452.
- Steinberg, J. C. (1937). Positions of stimulation in the cochlea by pure tones. Journal of the Acoustical Society of America, 8, 176–180.
- Suga, N. (1988). Auditory neuroethology and speech processing: complex sound processing by combination sensitive neurons. In G. M. Edelman, W. E. Gall, & W. M. Cowan (Eds.), Auditory function: Neurobiological bases of hearing (pp. 679–720). New York: Wiley.
- Suga, N., Gao, E., Zhang, Y., Ma, X., & Olsen, J. F. (2000). The corticofugal system for hearing: Recent progress. Proceedings of the National Academy of Sciences, USA, 97, 11807– 11814.
- Sullivan, W. E., & Konishi, M. (1984). Segregation of stimulus phase and intensity coding in the cochlear nucleus of the barn owl. Journal of Neuroscience, 4, 1787–1799.
- Takahashi, T. T. (1989). The neural coding of auditory space. Journal of Experimental Biology, 146, 307–322.
- Terhune, J. M. (1974). Directional hearing of a harbor seal in air and water. Journal of the Acoustical Society of America, 56, 1862–1865.
- Thompson, R. K., & Herman, L. M. (1975). Underwater frequency discrimination in the bottlenose dolphin (1–140 kHz) and the human (1–8 kHz). Journal of the Acoustical Society of America, 57, 943–948.
- Trussell, L. O. (1997). Cellular mechanisms for preservation of timing in central auditory pathways. Current Opinion in Neurobiology, 7, 487–492.
- Trussell, L. O. (1999). Synaptic mechanisms for coding timing in auditory neurons. Annual Review of Neuroscience, 61, 477–496.
- Viemeister, N. F. (1979). Temporal modulation transfer functions based upon modulation thresholds. Journal of the Acoustical Society of America, 66, 1364–1380.
- Vogten, L. L. M. (1974). Pure-tone masking: A new result from a new method. In E. Zwicker & E. Terhardt (Eds.), Psychophysical models and physiological facts in hearing (pp. 142–155). Tutzing, Germany: Springer-Verlag.
- Vogten, L. L. M. (1978). Simultaneous pure tone masking: The dependence of masking asymmetries on intensity. Journal of the Acoustical Society of America, 63, 1509–1519.
- Wagner, H., Takahashi, T., & Konishi, M. (1987). Representation of interaural time difference in the central nucleus of the barn owl’s inferior colliculus. Journal of Neuroscience, 7, 3105–3116.
- Warchol, M. E., & Dallos, P. (1990). Neural coding in the chick cochlear nucleus. Journal of Comparative Physiology, 166, 721–734.
- Warr, W. B. (1992). Organization of olivocochlear efferent systems in mammals. In D. B. Webster, A. N. Popper, & R. R. Fay (Eds.), The mammalian auditory pathway: Neuroanatomy (pp. 410–448). New York: Springer-Verlag.
- Watson, C. (1963). Masking of tones by noise for the cat. Journal of the Acoustical Society of America, 35, 167–172.
- Webster, D. B., Popper,A. N., & Fay, R. R. (Eds.). (1993). The mammalian auditory pathway: Neuroanatomy. New York: SpringerVerlag.
- Wegel, R. L., & Lane, C. E. (1924). The auditory masking of one pure tone by another and its probable relation to the dynamics of the inner ear. Physical Review, 23, 266–285.
- Weir, C., Jesteadt, W., & Green, D. (1976). Frequency discrimination as a function of frequency and sensation level. Journal of the Acoustical Society of America, 61, 178–184.
- Wettschurek, R. G. (1973). Die absoluten Unterschiedswellen der Richtungswahrnehmung in der Medianebene beim naturlichen Hören, sowie heim Hören über ein KunstkoptÜbertragungssystem. Acoustica, 28, 97–208.
- Wever, E. G. (1949). Theory of hearing. New York: Wiley.
- Wever, E. G. (1978). The reptile ear. Princeton, NJ: Princeton University Press.
- Wilczynski, W. (1984). Central neural systems subserving a homoplasous periphery. American Zoology, 24, 755–763.
- Wilczynski, W., Allison, J. D., & Marlev, C. A. (1993). Sensory pathways linking social and environmental cues to endocrine control regions of amphibian forebrains. Brain, Behavior, and Evolution, 42, 252–264.
- Wild, J. M., Karten, H. J., & Frost, B. J. (1993). Connections of the auditory forebrain in the pigeon (Columba livia). Journal of Comparative Neurology, 337, 32–62.
- Wiley, R. H., & Richards, D. G. (1978). Physical constraints on acoustic communication in the atmosphere: Implications for the evolution of animal vocalizations. Behavioral Ecology and Sociobiology, 3, 69–94.
- Winer, J.A. (1991).The functional architecture of the medial geniculate body and the primary auditory cortex. In D. B.Webster,A. N.
- Popper, & R. R. Fay (Eds.), The mammalian auditory pathway: Neuroanatomy (pp. 222–409). NewYork: Springer-Verlag.
- Wisniewski, A. B., & Hulse, S. H. (1997). Auditory scene analysis in European starlings (Sturnus vulgaris): Discrimination of song segments, their segregation from multiple and reversed conspecific songs, and evidence for conspecific categorization. Journal of Comparative Psychology, 111, 337–350.
- Yack, J. E., & Fullard, J. H. (1999). Ultrasonic hearing in nocturnal butterflies. Nature, 403, 265–266.
- Yager, D. D. (1999). Hearing. In F. R. Prete, H. Wells, P. H. Wells, & L. E. Hurd (Eds.), The praying mantids (pp. 93–113). Baltimore: Johns Hopkins University Press.
- Yager, D. D., & Hoy, R. R. (1986). The cyclopean ear: A new sense for the Praying Mantis. Science, 231, 647–772.
- Yager, D. D., Cook, A. P., Pearson, D. L., & Spangler, H. G. (2000). A comparative study of ultrasound-triggered behaviour in tiger beetles (Cicindelidae). Journal of Zoology, London, 251, 355– 368.
- Yager, D. D., & Hoy, R. R. (1989). Audition in the praying mantis, Mantis religiosa L.: Identification of an interneuron mediating ultrasonic hearing. Journal of Comparative Physiology, 165, 471–493.
- Yager, D. D., & Spangler, H. G. (1995). Characterization of auditory afferents in the tiger beetle, Cicindela marutha Journal of Comparative Physiology, 176A, 587–600.
- Yost, W. A., & Gourevitch, G. (Eds.). (1987). Directional hearing. New York: Springer-Verlag.
- Yost, W. A., & Hafter, E. R. (1987). Lateralization. In W. A. Yost & G. Gourevitch (Eds.), Directional hearing (pp. 49–84). New York: Springer-Verlag.
- Young, E. D. (1998). The cochlear nucleus. In G. M. Shepherd (Ed.), Synaptic organization of the brain (pp. 131–157). New York: Oxford University Press.
- Zelick, R., Mann, D., & Popper, A. N. (1999). Acoustic communication in fishes and frogs. In R. R. Fay & A. N. Popper (Eds.), Comparative hearing: Fish and amphibians (pp. 363–411). New York: Springer-Verlag.
- Zwicker, E., Flottorp, G., & Stevens, S. (1957). Critical bandwidths in loudness summation. Journal of the Acoustical Society of America, 29, 548–557.
- Zwicker, E., & Henning, G. B. (1984). Binaural masking level differences with tones masked by noises of various bandwidths and levels. Hearing Research, 14, 179–183.
ORDER HIGH QUALITY CUSTOM PAPER

Always on-time

Plagiarism-Free

100% Confidentiality