
Sample MRI In Psychiatry Research Paper. Browse other research paper examples and check the list of research paper topics for more inspiration. If you need a religion research paper written according to all the academic standards, you can always turn to our experienced writers for help. This is how your paper can get an A! Feel free to contact our research paper writing service for professional assistance. We offer high-quality assignments for reasonable rates.
1. Introduction
Although computerized tomography has been available for imaging studies in psychiatry for a number of years, the advent of MRI led to significant improvements in structural and subsequently also in functional imaging due to higher resolution and high-quality gray–white matter segmentation. The first studies using structural MRI were performed at the beginning of the 1980s and opened up new avenues for the investigation of functional and neurochemical properties of normal functions and pathological alterations of the brain.
Academic Writing, Editing, Proofreading, And Problem Solving Services
Get 10% OFF with 24START discount code
This research paper will provide an overview over the different aspects of MR technology in psychiatry. Considering the limitations of space, no comprehensive presentation of the studies performed so far and no complete references can be given. Instead, milestones and representative examples of studies and results will be presented. For more comprehensive information, the reader is referred to suitable monographs and review articles (Mazziotta et al. 2000, Toga and Mazziotta 2000).
2. Structural Magnetic Resonance Imaging (Mri)
2.1 Technical Foundations
The MRI technique is based on the physical phenomenon that atomic nuclei with an odd number of nucleons (protons plus neutrons) behave like electrically charged spinning tops that produce a magnetic field. If a strong external magnetic field is now imposed, the nuclei align either parallel or antiparallel to the field, and precess around their axis at a specific (Larmor) frequency. External electromagnetic radiofrequency (RF) pulses can move the spinning nuclei out of their initial alignment. When the RF pulse is removed, the nuclei return to their equilibrium state. This relaxation is accompanied by a RF signal, which is detected by RF coils. Localization of the signal is accomplished by frequency and phase encoding by means of external gradients. The acquired information is then transformed into different gray levels and displayed as a MR image.
2.2 Findings
2.2.1 Schizophrenia. Numerous structural MRI studies suggested that the occurrence of ventricular enlargement is one of the most consistent findings in schizophrenia. Additionally, reductions in the size of the temporal lobes, the amygdala-hippocampal complex, the frontal lobes, parietal lobes, and the corpus callosum were described. On the other hand, volume increases of the subcortical nuclei have been found.
Despite these findings, there is still no general consensus on the presence of localized structural abnormalities. Chua and McKenna (1995) conclude from their detailed review of structural MRI studies that the findings concerning the temporal lobe limbic structures as most consistent. In general, the described structural MRI findings support the notion of schizophrenia as a disturbance of fronto-temporal neuronal integrity.
It has been reported that the structural brain changes in schizophrenia do not correlate with the duration of the illness. Therefore, it seems likely that the structural alterations do not merely reflect advanced atrophic processes. Rather, they seem to stem from pathogenic factors which are most active either prior to or at the time of onset of the disease and do not significantly progress depending on the duration of the illness. However, this concept of schizophrenia is still controversially discussed and newer studies are suggesting progressing neuropathological alterations in schizophrenia after onset of the disease (DeLisi et al. 1997).
2.2.2 Affective Disorders. Global cerebral atrophy and increased ventricular–brain ratio (VBR) in unipolar as well as bipolar depressed patients have been described but these findings are less consistent than those reported for schizophrenic patients. MRI studies in bipolar patients revealed evidence of global cerebral atrophy including lateral ventricular enlargement and increased VBR.
Reductions in the prefrontal lobe volume especially in the subgenual prefrontal cortex have been reported (Drevets et al. 1998). Recurrent major depression associated with hypercortisolism induced neurotoxicity might lead to hippocampal atrophy, which was indicated by the finding of bilaterally reduced hippocampal and amygdala core nuclei volumes in patients with major depression. Additionally, depressed patients have been shown to have smaller caudate and putamen volumes bilaterally. Late onset depressives demonstrated significantly more left medial temporal lobe atrophy than early onset patients.
2.2.3 Dementia. CT and MRI have delineated structural changes in Alzheimer’s disease (AD), including cerebral atrophy associated with widening of cortical sulci, ventricular enlargement, and deep white-matter lesions with periventricular distributions. Using MRI technology, it could be shown that significant brain atrophy is present early in the disease process and a direct correlation between the atrophy and the severity of cognitive impairment could be observed. Magnetic resonance imaging has illustrated this relationship as greater involvement of mediotemporal areas (Murphy et al. 1993).
Regarding the differential diagnosis of Alzheimer’s disease from vascular dementia (VD), greater amounts of white matter and periventricular hyperintensities have been suggested to be indicative of VD.
3. Functional Magnetic Resonance Imaging (fMRI)
3.1 General Aspects
Aside from the above presented structural information, the MRI technology has been extended to the investigation of various functional aspects of the central nervous system and related neuropsychiatric disorders. These variations of functional MRI (fMRI) are either based on measures of regional differences in oxygenated blood (BOLD contrast), the change in regional blood flow (perfusion fMRI), the random movement of water molecules (diffusion weighted fMRI), or the quantity and distribution of neurochemical compounds in the brain (MRI spectroscopy). Based on the fact that changes in neuronal activity result in focal changes of perfusional parameters, blood oxygenation, and metabolism, fMRI lends itself to the study of brain activation under behavioral, neuropsychological, and emotional tasks. The technical aspects and representative findings will be discussed below.
3.2 Blood Oxygen Level Dependent Contrast (BOLD) fMRI
3.2.1 Technical Foundations. Studies of brain activation based on the contrast agent-free BOLD technique are commonly referred to as functional MRI (fMRI). The BOLD technique uses the endogenous MRI contrast agent deoxyhemoglobin as the source of the signal. The ferrous iron on the heme of deoxyhemoglobin is paramagnetic but diamagnetic in oxyhemoglobin. Cerebral blood flow studies showed that cerebral activation leads to a local increase in oxygen delivery beyond the actual metabolic demand. This results in a higher concentration of diamagnetic oxyhemoglobin and a decrease of the paramagnetic deoxyhemoglobin in the activated brain regions. Consequently, the existing field inhomogeneities between intra- and extravascular space diminish and the T2* signal increases.
The most commonly used imaging sequences for BOLD-fMRI employ echo-planar imaging (EPI). The technique is based on the application of only one RF pulse followed by multiple reversals of the frequency-encoding readout gradient. The advantages of this sequence include high acquisition speed and high signal-to-noise ratio. fMRI using scanners with field strengths greater than 1.5 T lead to improvement of the signal-to-noise ratio. Faster computer algorithms are currently starting to allow for near real time fMRI studies in which the activation maps are calculated during the study.
3.2.2 Paradigm Design. The experimental designs for fMRI studies are either established as blocked or as event related designs. In the case of the blocked design, a specific activation condition and a baseline condition are presented continuously over a certain period of time. The underlying assumption is that the cognitive demand imposed by the activation condition will be added to the baseline activity without any significant interaction (‘pure insertion’). Event related designs try to model the hemodynamic response and signal changes associated with individual trials.
3.2.3 Data Processing And Analysis.
(a) Realignment. The observed signal change in fMRI activation studies at 1.5 T are usually in the range of 1–5 percent. Postprocessing and statistical procedures enable the detection and interpretation of these signals. In order to avoid movement, physical head constraints such as headholders or bite-bars are used. Additionally, computerized algorithms for realignment of the acquired images are applied.
(b) Spatial normalization. Spatial normalization of the images to a standard template brain is often performed prior to statistical analysis to allow signal averaging across subjects and to report the resulting activation foci in terms of standard coordinates.
(c) Statistics. Various parametric and nonparametric methods are adopted for the analysis of fMRI datasets. In blocked paradigm designs, significant activation states in terms of differences between the baseline and the activation conditions can be detected by a t-test for each individual voxel. The time series of the ideal response function can be modeled for example by a box-car function and voxels which correlate significantly with this response function are regarded as activated. An extension of this statistical approach is based on the General Linear Model.
In event-related designs, a modeling of the individual hemodynamic response function is employed and those voxels that are best predicted by a particular response function in relation to the known onsets of the stimulus events will be identified.
Functional connectivity has been defined as the correlation of activity among brain regions. Additionally, the term ‘effective connectivity’ has been introduced; this is the influence an area has, directly or indirectly, on another area. Functional connectivity can be described in terms of path coefficients (Buchel et al. 1999).
3.2.4 Findings.
(a) Schizophrenia
(i) Verbal fluency. Since disturbances in language perception or production are related to both positive and negative symptoms of schizophrenia, the investigation of neural circuits involved in language processing are likely to be of importance for the pathophysiology of schizophrenia. Functional activation studies using language activation paradigms lead to some new concepts of the underlying networks. It appears that the cerebral structures involved in language processing exceed the ‘classical’ language areas such as Broca’s and Wernicke’s area. Especially the extent of frontal, temporal, and parietal areas associated with spontaneous language production is noteworthy (Schlosser et al. 1998). Schizophrenic patients demonstrated significantly less left frontal activation and greater left temporal activation than normal controls during a word fluency task (Yurgelun Todd et al. 1996).
(ii) Working memory. There is a vast body of literature suggesting cognitive deficits in schizophrenia especially in the domains of attention, short-term memory, and executive functions. The fMRI technique has been used to demonstrate alterations in the activation pattern of higher cortical association areas and related subcortical neuronal networks in schizophrenic patients while performing working memory tasks. It has been demonstrated that schizophrenic patients revealed less activation in the frontal cortex than a group of healthy controls (Callicott et al. 1998).
(iii) Emotional processing. Schizophrenic patients as compared to normal controls did not demonstrate amygdala activation during induced sadness despite matched ratings to normal controls (Schneider et al. 1998).
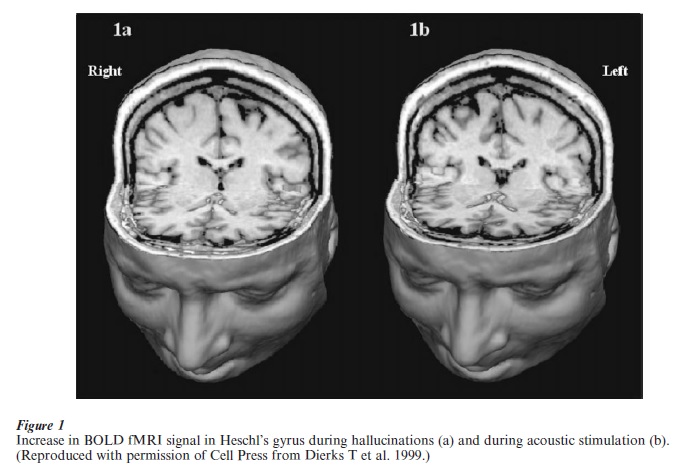
(iv) Hallucinations. Aside from the application of external activation tasks or events, spontaneously occurring psychopathological symptoms could be directly visualized. An increase of the BOLD fMRI signal in Heschl’s gyrus could be observed during hallucinations (Fig. 1(a)). Activation at the same location could also be identified during acoustic stimulation (Fig. 1(b)), suggesting the involvement of primary auditory areas in auditory verbal hallucinations (Dierks et al. 1999).
(b) Obsessive-compulsive disorder
Symptom provocation paradigms with individually tailored stimuli in patients with obsessive compulsive disorder led to defined activations in different brain areas. Whereas a patient group revealed activations in medial orbitofrontal, lateral frontal, anterior temporal, anterior cingulate, and insular cortex, as well as caudate, lenticulate, and amygdala, normal control subjects did not show any significant activations (Breiter et al. 1996). These results point towards a physiological overactivation of an orbitofrontal caudate circuit.
(c) Substance abuse. Individually tailored cues have also been used to study different aspects of the functional neuroanatomy of the reward system in the context of drug craving. Cocaine-associated cues were applied to map activation in regions thought to be related to craving (e.g., prefrontal and cingulate cortices).
(d) Dementia. While performing an auditory stimulation task, predominant activation foci were seen in the inferior and middle frontal gyrus (left greater than right) in healthy controls but not in patients with mild AD. The latter group also showed additional activation suggesting compensatory recruitment of locally expanded foci and remote regions, for example, right frontal activation (Saykin et al. 1999).
(e) fMRI and pharmacology. There is considerable interest in using fMRI for the study of pharmacological influences on functional brain networks. The studies reported have either investigated the direct effect of a drug challenge on the BOLD signal or they have examined the modulatory influence of a pharmacological intervention on brain activation patterns.
After acute cocaine infusion, a negative signal change was noted in the amygdala, which correlated with craving ratings, whereas activation in the ventral tegmentum, pons, basal forebrain, caudate, cingulate, and most regions of lateral prefrontal cortex correlated with cocaine induced euphoria. The beneficial effects on brain activation patterns of treatment with atypical in comparison to typical antipsychotic drugs has been demonstrated both with motor stimulation (Braus et al. 1999) and a working memory task (Honey et al. 1999).
3.3 Perfusion fMRI
In analogy to radioactive tracers in emission tomography, ‘MR tracers’ have been used to image brain perfusion. Two different approaches are currently adopted. The first is based on the application of paramagnetic contrast agents, such as gadolinium DTPA. The second approach employs steady-state arterial spin labeling (ASL) techniques, which ‘label’ arterial blood as it moves up through the brain and then follow the effect of the labeled blood on the amplitude of the MRI signal from defined slices. Using a flow imaging technique, parieto-occipital and temporo-occipital to whole slice signal intensity ratios were reported to be significantly lower in AD patients than healthy controls. Additionally, parieto-occipital hypoperfusion correlated with dementia severity.
3.4 Diffusion-Weighted fMRI
Diffusion-weighted images are MRI images with signal intensities sensitized to the random motion of water molecules. In tissues that have a random microstructure, the measured apparent diffusion coefficient (ADC) seems to be the same in all directions (isotropic diffusion), while in tissues that have a regularly ordered microstructure, such as in parallel axons, the measured ADC varies with tissue orientation (anisotropic diffusion).
Diffusion tensor analysis allows advanced quantification of the directionality of diffusion anisotropy. The six independent scalar elements of the diffusion tensor contain the information required to characterize diffusion in all directions.
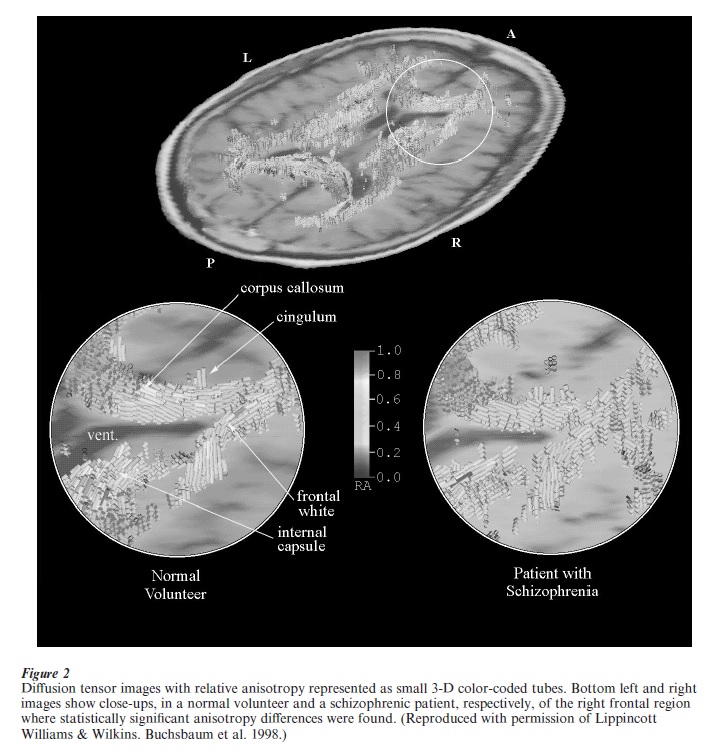
Applying diffusion weighted imaging to a psychiatric population, significantly lower diffusion anisotropy in the white matter of the prefrontal cortex in schizophrenic patients than in normal controls was observed (Buchsbaum et al. 1998). Figure 2 displays diffusion tensor images of a normal volunteer and a schizophrenic patient, respectively, illustrating these findings.
3.5 Magnetic Resonance Spectroscopy (MRS)
Aside from structural and functional imaging with MRI as described above, magnetic resonance spectroscopy (MRS) allows for the in i o investigation of various biochemical substances including membrane compounds, substrates of energy metabolism, neurotransmitters, and also brain concentrations of pharmacological agents.
3.5.1 Technical Foundations. The basis of MRS is widely the same as for MRI imaging as outlined above. As mentioned above, the different nuclei have a defined resonance frequency and as the nuclei reorientate themselves along the static field they send out a signal at this frequency, thus giving rise to the specific MRI signal. MRS is based on the fact that not all nuclei of one type resonate at the same frequency even if a homogeneous magnetic field without any externally applied gradients is present. This is due to the fact that the nuclei find themselves in small local variations of the magnetic field caused by differing chemical environments. This small variation in the resonant frequency is called chemical shift. Whereas MRI and fMRI do not specifically use this chemical shift information, with MRS the full range of different frequencies is usually resolved and displayed as a frequency spectrum with different peaks and valleys.
The most important applications of MRS in psychiatry are 1H-MRS and 31P-MRS. In 1H-MRS, the peaks of the spectrum include N-acetyl aspartate (NAA), creatin-phosphocreatin (Cr-PCr), quaternary ammonium methyl groups (containing choline and other compounds), myo-inositol (containing myo-inositol monophosphate and glycine), glutamine, glutamate, aspartate, gamma-aminobutyric acid (GABA), and lactate. NAA is an amino acid present in high concentrations in neurons and is regarded as a neuronal marker although the exact role of the substance is not yet established. Since the signal of these molecules is embedded in the signal of abundant water molecules in the brain, the water signal has to be ‘suppressed’ by certain techniques.
31P-MRS allows the measurement of brain membrane phospholipids and high-energy phosphate metabolism. The phosphorus spectrum includes the three peaks from adenosine triphosphate (ATP, beta-ATP and alpha-ATP), phosphocreatine (PCr), phosphodiesters (PDE), phosphomonoesters (PME), and inorganic phosphate (PI). The peaks of PME and PDE are indicators of membrane synthesis and a decrease in the PME/PDE ratio has been suggested to be indicative of a decreased rate of phospholipid synthesis. Other nuclei which are of importance for MRS in psychiatry are 7Li, 13C, and 19F.
3.5.2 Findings.
(a) Schizophrenia. Decreased levels of PME and PI and increased levels of ATP and PDE in the dorsolateral prefrontal cortex could be found in drug-naïve first episode schizophrenic patients. Additionally, PME levels were significantly decreased in frontal regions of schizophrenic patients who had high scores on negative symptom rating scales. However, these and subsequent findings are not without controversy. Decreased levels of PDE in schizophrenic patients compared to normal controls were described (Volz et al. 1998b). Major improvements and changes in the MRS techniques including different localization methods might be possible explanations for the divergent findings.
Using a technique with multiple slices consisting of several single-volume elements, it could be demonstrated that NAA-relative signal intensity reductions in schizophrenia appear to be remarkably localized, involving primarily the hippocampal region and the dorsolateral prefrontal cortex (Bertolino et al. 1998).
Memory function in patients with schizophrenia were found to be related to temporal but not frontal Cr content as determined with MRS, a pattern that was not apparent among controls. Ratios of NAA to choline-containing compounds were reported to be significantly reduced in the bilateral basal ganglia regions of medicated schizophrenic patients compared to normal subjects, suggesting that neuronal dysfunction may be observable subcortical structures as well.
(b) Affective disorders. Bipolar I patients showed increased PME and intracellular pH levels in the manic or depressed state while the concentration of these metabolites was decreased in the euthymic state. Bipolar II patients had decreased PCr levels in the depressed, manic, and euthymic state. The observed changes were not related to cerebral 7Li concentration as determined by MRS. In euthymic patients with bipolar disorder, the Cho/Cr-PCr peak ratio was higher than that in normal controls which could be interpreted as a result of a membrane breakdown that may occur in the basal ganglia of patients with bipolar disorder. In patients with unipolar major depression, increased PME and decreased ATP values in the frontal lobe could be detected (Volz et al. 1998a). With 1H-MRS, decreased levels of NAA/Cr-PCr were found in the dorsolateral prefrontal cortex of bipolar patients, suggesting decreased neuronal density or neuronal dysfunction in the DLPFC region.
(c) Dementia. Alzheimer’s disease has been shown to be associated with an increase in brain PME early in the course of the disease and followed by an increase in PDE and PCr later on. The increase in PME might reflect early abnormalities in membrane metabolism while the increase of PDE and PCr shows neuronal degeneration and death. Recent studies suggest an increase in the PME/PDE ratio of approximately 50 percent, but no differences in absolute values of PME and PDE between patients with Alzheimer’s diseases and normal controls could be established. However, in other studies in patients with mild to moderate AD, no differences in any phosphorus metabolite concentration s or ratios could be detected, nor any correlations of 31P metabolite levels with severity of dementia.
With 1H MRS, decreased levels of NAA and increased myo-inositol could be found. The change in myo-inositol might represent alterations of the polyphosphate second messenger system. Cognitive dysfunction of demented patients was significantly correlated with reductions of NAA, but not with increases of myo-inositol (Heun et al. 1997).
(d) Treatment studies. It could be demonstrated that the treatment response to lithium in manic patients with bipolar disorder is more closely related to the lithium concentration in the brain than to the concentration in serum.
It remains unclear whether neuroleptic treatment might cause additional changes in the brain metabolic patterns. Associations between the chlorpromazine equivalent neuroleptic dose received by patients and NAA contents in different brain structures have been described, suggesting a favorable long-term effect of neuroleptic treatment on neuronal function. In schizophrenic patients treated with atypical antipsychotics, decreased levels of Cho were found in the left basal ganglia, while increased levels of NAA were found in the left frontal cortex. Few MRS follow-up studies after neuroleptic treatment have been reported so far. A 1H-MRS spectroscopy study demonstrated a renormalization of increased pretreatment (GABA + Glu) /Cr ratio after neuroleptic treatment which may implicate the recovery of normal neuronal function in neurotransmitters.
4. Outlook
In the past years, applications of MRI in psychiatry have experienced a tremendous growth both in research and clinical practice. The MRI imaging modalities reviewed above have to be regarded as complementary with respect to the acquired information. For example, combining fMRI and MRS will allow for the detection of metabolite patterns within areas of altered functional activation. fMRI in combination with DTI will help to address the issue of functional and effective connectivity by mapping both regional intercorrelations of BOLD signal changes and structural connections in terms of long fiber tracts. MRI-based methods will further benefit from multimodal imaging approaches in conjunction with imaging techniques based in the field of nuclear medicine or electrophysiology, such as positron emission tomography (PET), electroencephalography (EEG), or magnetoencephalography (MEG).
The availability of modern technologies such as MRI has to a significant extent contributed to the recent progress in the assessment of the biological basis of psychiatric disorders and the development of successful treatment strategies. MRI technology has already proved itself and will continue to be a valuable ‘window to the brain.’
Bibliography:
- Bertolino A, Callicott J H, Elman I, Mattay V S, Tedeschi G, Frank J A, Breier A, Weinberger D R 1998 Regionally specific neuronal pathology in untreated patients with schizophrenia: a proton magnetic resonance spectroscopic imaging study. Biological Psychiatry 43: 641–8
- Braus D F, Ende G, Weber-Fahr W, Sartorius A, Krier A, Hubrich-Ungureanu P, Ruf M, Stuck S, Henn F A 1999 Antipsychotic drug effects on motor activation measured by functional magnetic resonance imaging in schizophrenic patients. Schizophrenia Research 39: 19–29
- Breiter H C, Rauch S L, Kwong K K, Baker J R, Weisskoff R M, Kennedy D N, Kendrick A D, Davis T L, Jiang A, Cohen M S, Stern C E, Belliveau J W, Baer L, O’Sullivan R L, Savage C R, Jenike M A, Rosen B R 1996 Functional magnetic resonance imaging of symptom provocation in obsessive-compulsive disorder. Archives of General Psychiatry 53: 595–606
- Buchel C, Coull J T, Friston K J 1999 The predictive value of changes in effective connectivity for human learning. Science 283: 1538–41
- Buchsbaum M S, Tang C Y, Peled S, Gudbjartsson H, Lu D, Hazlett E A, Downhill J, Haznedar M, Fallon J H, Atlas S W 1998 MRI white matter diffusion anisotropy and PET metabolic rate in schizophrenia. Neuroreport 9: 425–30
- Callicott J H, Ramsey N F, Tallent K, Bertolino A, Knable M B, Coppola R, Goldberg T, van Gelderen P, Mattay V S, Frank J A, Moonen C T, Weinberger D R 1998 Functional magnetic resonance imaging brain mapping in psychiatry: methodological issues illustrated in a study of working memory in schizophrenia. Neuropsychopharmacology 18: 186–96
- Chua S E, McKenna P J 1995 Schizophrenia—a brain disease? A critical review of structural and functional cerebral abnormality in the disorder. British Journal of Psychiatry 166: 563–82
- DeLisi L E, Sakuma M, Tew W, Kushner M, Hoff A L, Grimson R 1997 Schizophrenia as a chronic active brain process: a study of progressive brain structural change subsequent to the onset of schizophrenia. Psychiatry Research 74: 129–40
- Dierks T, Linden D E J, Jandl M, Formissano E, Goebel R, Lanfermann H, Singer W 1999 Activation of Heschl’s gyrus during auditory hallucinations. Neuron 22: 615–21
- Drevets W C, Ongur D, Price J L 1998 Neuroimaging abnormalities in the subgenual prefrontal cortex: implications for the pathophysiology of familial mood disorders. Molecular Psychiatry 3: 220–6
- Heun R, Schlegel S, Graf Morgenstern M, Tintera J, Gawehn J, Stoeter P 1997 Proton magnetic resonance spectroscopy in dementia of Alzheimer type. International Journal of Geriatric Psychiatry 12: 349–58
- Honey G D, Bullmore E T, Soni W, Varatheesan M, Williams S C, Sharma T 1999 Differences in frontal cortical activation by a working memory task after substitution of risperidone for typical antipsychotic drugs in patients with schizophrenia. Proceedings of the National Academy of Science USA 96: 13432–7
- Mazziotta J C, Toga A W, Frackowiak R S J (eds.) 2000 Brain Mapping. The Disorders. Academic, San Diego, CA
- Murphy D G M, DeCarli C D, Daly E, Gillette J A, McIntosh A R, Haxby J V, Teichberg D, Schapiro M B, Rapoport S I, Horwitz B 1993 Volumetric magnetic resonance imaging in men with dementia of the Alzheimer type: correlations with disease severity. Biological Psychiatry 34: 612–21
- Saykin A J, Flashman L A, Frutiger S A, Johnson S C, Mamourian A C, Moritz C H, O’Jile J R, Riordan H J, Santulli R B, Smith C A, Weaver J B 1999 Neuroanatomic substrates of semantic memory impairment in Alzheimer’s disease: patterns of functional MRI activation. Journal of the International Neuropsychology Society 5: 377–92
- Schlosser R, Hutchinson M, Joseffer S, Rusinek H, Saarimaki A, Stevenson J, Dewey S L, Brodie J D 1998 Functional magnetic resonance imaging of human brain activity in a verbal fluency task. Journal of Neurology Neurosurgery and Psychiatry 64: 492–8
- Schneider F, Weiss U, Kessler C, Salloum J B, Posse S, Grodd W, Muller Gartner H W 1998 Differential amygdala activation in schizophrenia during sadness. Schizophrenia Research 34: 133–42
- Toga A W, Mazziotta J C (eds.) 2000 Brain Mapping. The Systems. Academic, San Diego, CA
- Volz H P, Rzanny R, Riehemann S, May S, Hegewald H, Preussler B, Hubner G, Kaiser W A, Sauer H 1998a 31P magnetic resonance spectroscopy in the frontal lobe of major depressed patients. European Archi es of Psychiatry and Clinical Neuroscience 248: 289–95
- Volz H P, Rzanny R, Rossger G, Hubner G, Kreitschmann Andermahr I, Kaiser W A, Sauer H 1998b Phosphorus magnetic resonance spectroscopy of the dorsolateral prefrontal region in schizophrenics—a study including 50 patients and 36 controls. Biological Psychiatry 44: 399–404
- Yurgelun Todd D A, Waternaux C M, Cohen B M, Gruber S A, English C D, Renshaw P F 1996 Functional magnetic resonance imaging of schizophrenic patients and comparison subjects during word production. American Journal of Psychiatry 153: 200–5
ORDER HIGH QUALITY CUSTOM PAPER

Always on-time

Plagiarism-Free

100% Confidentiality