
View sample Workplace Safety and Health Research Paper. Browse other research paper examples and check the list of research paper topics for more inspiration. If you need a religion research paper written according to all the academic standards, you can always turn to our experienced writers for help. This is how your paper can get an A! Feel free to contact our custom writing service for professional assistance. We offer high-quality assignments for reasonable rates.
1. Definition Of Workplace Safety And Health
Workplace safety and health refer here to all practical actions taken at the shopfloor level to promote the safety and health of workers. Such actions should be theory-driven because accident theories help to pinpoint dangerous factors in the company, and they offer directions for practical solutions. The focus of these actions is the behavior and attitudes of the workers subject to the highest risk of occupational accidents and diseases.
Academic Writing, Editing, Proofreading, And Problem Solving Services
Get 10% OFF with 24START discount code
2. Short History Of Occupational Safety And Health
The history of occupational safety and health starts in the fourth century BC, when Hippocrates described the occurrence of lead poisoning among miners. Later, another Roman physician, Galen, wrote about various occupational diseases (Fraser 1989). However, the first written source to mention a disease as actually being occupational in origin was Agricola’s De Re Metallica (1556), which ends with a note on diseases and accidents among miners. At that time a woman could be married to as many as seven miners, one after the other. Eleven years later (1567) Paracelsus published Von der Bergsucht und anderen Bergkrankheiten, describing the diseases of smelter workers and metallurgists (Hunter 1955).
Finally, in 1700, Ramazzini published a book entitled De Morbis Artificum Diatriba, in which he examined the health conditions of over 50 occupations. Because of his success, he is called the Father of Occupational Medicine.
Observations on occupational diseases did not lead to legislative action until 1802, when the Health and Morals of Apprentices Act was confirmed in England. This act was then improved by the Factory Acts in the middle of the nineteenth century. The first compulsory social security system for wage-earners was also set up about that time, in Germany in 1883. The Workmen’s Compensation Act followed in Britain in 1897. It provided for automatic compensation to an injured worker. In 1919 occupational safety and health became a truly worldwide concern when the International Labour Organisation (ILO) was founded in Geneva to establish International Conventions and International Recommendations for the development of standards and procedures for occupational health and accident prevention (Fraser 1989).
3. Theories On Occupational Accidents
A feature common to different definitions of an occupational accident is the unexpected and unintentional nature of the incident. When physical injury is added, an occupational accident can be defined as an unexpected and unintentional series of events leading to the physical injury of a person at work. The other precondition for an occupational accident is a contractual relationship between the employer and the employee (Figlio 1985).
Until the end of the nineteenth century, people thought that accidents were brought on by their sins or were ‘God’s will.’ This idea was based on the fact that most hazards were caused by natural phenomena. People had very limited means with which to resist the forces of nature. The onset of industrialization in the twentieth century meant that production moved from homes to factories. Since people had built these environments, most of the hazards were also manmade. Thus the idea of accident prevention fell on fruitful ground.
3.1 Theories On Accident Causes
The first scientific theory attempting to explain accidents was the theory of accident proneness. Greenwood and Woods (1919) insisted that ‘accidents occur to a limited number of individuals who have a special susceptibility to accidents’ (preface). Accident proneness was presumed to be a stable personality trait. The theory assumed that some people have an inherent tendency to be involved in accidents (Shaw and Sichel 1971).
The theory of accident proneness has been criticized on both theoretical and empirical grounds. The studies published have displayed conceptual confusion, how- ever, surrounding the meaning of accident proneness. Accident proneness is understood as a unitary trait, as a general characteristic, and as an innate and un-modifiable characteristic, and it is thus used as an explanatory concept. The statistical criticism of the accident proneness theory culminates in the question of whether the entire population has the same risk to be involved in an accident or not. Because the accident proneness theory is based on an incorrect assumption of homogeneous exposure to risk, it should be substituted by the concept of accident liability, which is based on the assumption of the inequality of exposure (McKenna 1983).
According to the danger factor theory, an accident happens when a worker and a danger factor meet so that the worker injures him/herself. The accident is a stochastic event, the probability of which is determined by the number of danger factors. The most critical danger factors are those with the highest energy content (Skiba 1973). This theory is mostly based on practical experience.
A more sophisticated version of the danger factor theory is the ergonomic approach to the causes of accidents. The ergonomic approach assumes that disturbances in the flow of information increase the risk of accident occurrence. The exchange of information between a worker and his or her environment, or between a worker and co-workers or supervisors are preconditions to accident avoidance (Saari 1984).
3.2 Theories On Risk Taking
The recent theories related to accidents are those on risk taking. They have been developed in research on traffic safety. Most of the authors have thought that their theories can be applied to risk-taking situations in work-life as well.
The risk compensation theory assumes that people have a constant level of risk that they are ready to accept. If the risk level decreases due to safety measures (e.g., seat belts in cars), people tend to adjust their goals (e.g., try to arrive sooner at their destination) so that the risk level returns to exactly the same level as before. The effects of safety measures are thus eliminated in the long run (O’Neill 1977). Because the assumption of exact compensation is criticized, the concept of risk compensation is often replaced by the concept of behavioral adaptation.
According to the risk homeostasis theory, the risk of traffic accidents is determined by the homeostatic system, which is analogous to the room temperature system. The main assumption of the theory is that the target level of risk is the only factor determining accident rates. Perceived benefits and costs of risk taking and cautious behavior are the factors controlling the level of target risk. The risk homeostasis theory argues that the effect of a safety measure depends on its motivational nature for the people who use it. The effect of a measure (e.g., mandatory seat belt use) which does not motivate its users will be eliminated in the long run as the drivers take more risks. However, safety can be enhanced by measures that motivate people to desire safety (Wilde 1982). If such motivation can be achieved, the effect of the measure may be greater than technical calculations show.
A complementary theory for the risk homeostasis theory is the risk motivation theory (Trimpop 1994). This model assumes that both personality and situational factors influence one’s risk perception, which is divided into physiological, emotional, and cognitive components. Each one has its own target level of risk, which contributes to the total target level of risk. Based on the rational calculation of costs and benefits, a risk taker is motivated to act. These acts influence the environment, which then gives either positive or negative feedback. The actor can then perceive the risks in a new and better way.
The theory of zero risk received its name from the assumption that drivers of motor vehicles adapt to the risks involved in driving to the point that they do not generally feel any risk in a traffic situation or their subjective risk assessments approach zero. People avoid the feeling of risk just as they avoid pain. There is a risk threshold, however, above which risk is experienced as aversive. A driver tends to satisfy his or her motives in traffic, as well as in other areas of life. This need to satisfy motives pushes him or her to drive faster and more hazardously. Both excitatory and inhibitory motives influence the decision making of a driver. The most hazardous excitatory motives are ‘extra motives’ (i.e., those outside traffic, such as the saving of time and effort) which prompt the driver to increase speed. The increased risk of an accident is related to the strength of these extra motives (Naatanen and Summala 1976).
If the psychological portrayal of a human being with respect to accident theories is analyzed, a change can be seen. The first theories assumed that a human being is a passive accident victim who has an inherent tendency to be involved in accidents. In the more recent theories, a human being is an actor who actively searches for information from the environment. The theories, however, accept that a human being is not perfect and does make mistakes and errors. As technology becomes more reliable, a human being will be the greatest risk factor for him herself.
4. The Behavior Modification Approach
The approach of behavior modification is based on operant learning behavior. Behavior is seen as a function of its relation to various prior and current events. The preceding events are called antecedents, and the events following the performance are consequences. If an act has increased in rate after a particular consequence has reliably followed it, the consequence is reinforcing. But if the rate has decreased, the consequence is aversive. Last, if a behavior disappears when a prior reinforcing consequence is continued, the situation is called extinction (SulzerAzaroff et al. 1994).
4.1 Interventions
The training of workers is usually the first form of intervention included in a behavior modification program. The aim of training is to teach safe work habits. The training must be as illustrative as possible, for example, showing photographs of workers using safety glasses. It is also possible to show unsafe scenes and ask workers to point out the unsafe actions. The important point in training is to repeat the safe habits in different ways for the workers. Several studies, however, have shown that training alone is not sufficient to improve safety performance (SulzerAzaroff et al. 1994).
The alternative method for traditional classroom teaching is an informational safety campaign. The first prerequisite for an effective informational campaign is to set a clear objective with a specific message that is positive, simple, plausible, and comprehensible. The campaign material should be designed to attract attention. Posters should be placed at crucial points of action, for example, on the wall of the canteen at a construction site. The effect of a campaign is usually short-lived. The types of intervention used in informational safety campaigns have not influenced the number or the seriousness of accidents (Saarela et al. 1989).
The other alternative method is to utilize small groups in accident prevention. This idea is based on experiences from quality circles, which are problem- solving groups largely used in the manufacturing industry. As in the case of quality circles, small accident prevention groups consist of members of the same organization meeting regularly to solve safety- related problems. In a Finnish shipyard the small groups had from 4 to 13 members, and they met 5 to 11 times during one year. The two tasks of the groups were to eliminate the obstacles to good order and safety and establish new housekeeping practices— behavior modification. The program was successful both in improving housekeeping and in reducing accidents (Saarela 1990).
Goal setting is the other main method with which to improve performance. The first requirement for successful goal setting is that the workers who are to be the subjects of the intervention participate in the setting of the goals. Difficult goals inspire better performance than easy goals do. The best goals are difficult, but achievable. The utmost goal should be divided into subgoals that are easy to understand. The first goals should be rather concrete, such as ‘we should use hard hats all the time at the construction site’ (Locke and Latham 1990).
4.2 Positive Reinforcement
Positive reinforcement refers to an increase in the frequency of a response following the presentation of a positive reinforcer. Whether or not a particular event is a positive reinforcer is determined empirically. The effectiveness of the reinforcer depends on several factors. Reinforcement given immediately after the response is more effective than feedback given after a long delay. The greater the amount of a reinforcer, the more frequent the response. Reinforcers that are highly valued lead to greater performance. A continuous schedule of reinforcement, where a response is reinforced each time it occurs, is the most effective (Kazdin 1975).
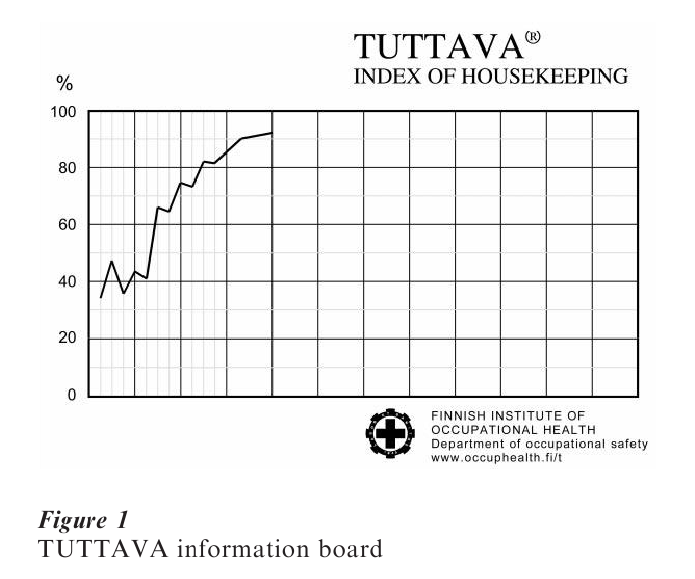
Positive reinforcement should be given soon after the observation of a desired behavior. It ought to be given regularly, for example, once a week. The feedback should be visible and given to all workers at the same time. One way to fulfill these requirements is to place a special information board on the wall so that a curve illustrates the development of the safety score on the experimental area from one observation to another. One example of such an information board is the TUTTAVA-board developed at the Finnish Institute of Occupational Health (Fig. 1), TUTTAVA being a Finnish acronym for a program to help improve production, quality, and safety.
One form of positive reinforcement is the use of a token economy. A token is a tangible object, for example, a lottery ticket, which can become a conditioned reinforcer. The use of tokens may shorten the delay between the behavior and the consequence, reinforce the behavior any time and any place, and provide a visible record for evaluation. The weakness of the token economy is that it pictures behavior as a simple series of stimuli and reactions. The token economy is, however, rather inexpensive for companies to operate (Brown 1978).
4.3 Measurement Of Safety Behavior
It is useful to start a behavior modification program with accident analysis. The analysis of accidents during the previous three to five years pinpoints the hazardous sites of the workplace. It is worthwhile classifying accidents as unpreventable and preventable, that is, as whether or not workers could avoid a similar accident if they changed their behavior. The researcher should then discuss the actions that could prevent accidents with the on-site personnel. Using the results of this analysis, the researcher collects 10–20 safety practices which should be phrased positively (Komaki 1986).
The next step is to prepare the measurement of safety performance. Generally an observation method is used for this purpose because the object of measurement is the external behavior of the subjects. The researchers should select observation periods at random (Tarrants 1980). When the observation is done at different times of the day, the workers behave normally and do not avoid the most hazardous tasks. The observation can be done from a single observation point or by walking through the observation area; the latter method is more common.
The observation sheet includes at a minimum a list of the desired safety practices. Usually it is constructed with only a dichotomized classification. The behavior of the observed worker is either safe or unsafe, as defined by the criterion of behavior included on the observation sheet. The third possible category is ‘not observed,’ under which the practice does not occur (Komaki 1986).
One example of an observation method is ELMERI (Fig. 2), ELMERI being the Finnish acronym for a workplace safety and health observation method. It has been developed through cooperation with safety authorities, safety managers, and safety representatives from selected workplaces. The observation method consists of 26 items, divided into 7 groups: (a) safety behavior, (b) order and tidiness, (c) machine safety, (d) industrial hygiene, (e) ergonomics, (f ) walkways, and (g) first aid and fire safety. For each item, the observer makes a decision as to whether the item is correct according to the safety criteria defined in the handbook of the observation method. The alternatives for the observer are ‘correct,’ ‘not correct,’ or ‘not observed.’ The ‘not observed’ alternative is used, for example, when there are no machines with permanent means of access in the workplace. It takes about 15 minutes to observe one work station with the ELMERI method, and only a few hours of training are needed to reach an acceptable level of interobserver reliability. It has been shown that a high safety index from ELMERI is related to a low accident rate (Laitinen et al. 1998).
The walkthrough observation rounds should be repeated once a week during five to ten weeks. The suggested time for each round is 30–60 minutes. The minimum number of observations during one observation round is 100. The results of the observations are calculated as a safety score as follows:
safety score = correct/(correct + not correct) × 100. The higher the value of the safety score, the better the safety situation within the workplace (Komaki 1986, Tarrants 1980).
The reliability of the observation is based on inter-observer agreement. Therefore, two observers should independently assess the behavior of the same workers. It is desirable to conduct reliability checks when both the observers and the observed workers are unaware that checks are being conducted. The reliability is calculated by dividing the smaller frequency by the bigger frequency and multiplying by 100. The reliability should be at least 80 percent to be acceptable (Kazdin 1975).
4.4 Experimental Designs
The effect of the intervention is demonstrated by the experimental design. It has two tasks. First, it should show that the change in behavior is permanent. Second, it should prove that the change in behavior is due to the intervention. There are three main types of experimental designs.
4.4.1 Reversal Or ABAB Design. The reversal design demonstrates the effect of the intervention by alternating the presentation and removal of the program over time. The purpose of the design is to demonstrate a functional relationship between the target behavior and the intervention. The first task in a reversal design is to measure the baseline rate of behavior, which describes the behavior in a normal situation before the intervention. The baseline period (referred to as phase A) is continued until the rate of the response becomes stable.
Then, in the experimental phase (referred to as phase B), the intervention is carried out. This phase continues until the behavior reaches a stable level or diverges clearly from the baseline level. Now the change in behavior is evident, but the cause of change is unclear.
In the reversal phase (phase A) the intervention is withdrawn. The target behavior usually returns to or near the original baseline level. The purpose of the reversal phase is to determine whether the behavior would have remained unchanged if the intervention had not been introduced. When the behavior reverts to the baseline, it is possible to reinstate the intervention (phase B). The design is called the ABAB design because the phases A and B are alternated (Kazdin 1975).
4.4.2 Control Group Design. Another way to demonstrate the effect of intervention is the classical experimental design with experimental and control groups. The intervention is done with one group (the experimental group) and not done with the other group (the control group). Immediately before and after the intervention the behavior of the workers is assessed. The basic requirement of the study design is the similarity of the groups. The best procedure to control for systematic differences between the groups is to allocate the workers to groups at random (Kazdin 1975).

At the shopfloor level a random classification of workers is not always possible for production reasons. Then two departments, which are as similar as possible, are selected as experimental and control groups. In addition to nonrandomness, overlapping of the information between the departments may be a problem in the comparison of departments.
4.4.3 Multiple-Baseline Design. The third experimental design to show the effect of interventions is the multiple-baseline design. The aim of this design is to demonstrate that the change in behavior is associated with the introduction of the contingency at different time points. This design requires the use of two or more interventions. After the baseline reaches a stable rate, one of the interventions is introduced, while baseline conditions are continued for other interventions. When the rates are stable once again, the second intervention is introduced. The effects of each intervention are established only after it has been introduced.
One problem that can occur with the multiplebaseline design is that changes in behavior take place too early. If behavior changes before the intervention is introduced, it is not clear whether the intervention is responsible for the changes or not (Kazdin 1975). Another problem is that the effects of the different interventions could be confused.
4.5 Analysis Of Intervention Data
Intervention studies often require the use of statistical tests appropriate for single-case experimental designs. Conventional t and F tests can be used in the statistical analysis of intervention data if the data are not serially dependent. This practice requires that the autocorrelation (i.e., correlation between data points separated by different time intervals) not be significant (Kazdin 1984). The other statistical method is to use tests for time series. The best for a short time series (n 10) is Kendall’s tau, which analyses the mean trend.
It is possible to complement the quantitative data of the effects of the intervention study by qualitative data. Qualitative methods are the most useful for analysing the meanings and symbols of the culture or subculture. In an intervention study, the most useful qualitative method is perhaps a discourse analysis. With this method, a researcher can analyse the possible change in the attitudes of the workers participating in the intervention.
In the reports of behavior modification studies, graphs should be used to illustrate both the study design and the results. It is easy to show the development of a safety score with a line graph (Gillan et al. 1998). In some cases it is possible to use the same graph to give feedback to workers and to illustrate the results in the report, as the TUTTAVA curve does (Fig. 1).
High-quality intervention studies help to avoid the wasting of time, money, and effort. Shannon et al. (1999) have presented eight criteria for an intervention study of high quality. First, the objectives of the study or its underlying hypotheses are clearly presented. In the experimental design the subjects are randomly allocated to experimental and control groups. The study has external validity and therefore its results can be generalized to other workplaces. The outcome measurement with acceptable reliability and validity should be appropriate to the objective of the intervention. Qualitative data can be used to supplement quantitative data. Diffusion of intervention manipulation from the experimental group to the control group (overlapping) or improper randomization are the main threats to internal validity. Appropriate statistical analysis should be applied in the analysis of the data set. The conclusions should address the program objectives and the limitations of the study and be supported by the analysis. These criteria are useful both in the assessment of other studies and in the planning of one’s own study.
5. Future Recommendations For Workplace Safety And Health
The fatality rate in Finland has fallen from 7.2 to 3.2 deaths per 100,000 workers from 1975 to 1994 (Statistics Finland 1997). Most of this positive development is due to technical solutions to prevention and improved safety inspections. Nowadays most of the technical solutions are in use and simple accidents can be prevented. Only the more complex accidents need to be tackled nowadays; they are due to the interaction between technical failure and human error.
Occupational accidents cause disturbances in production. When a serious accident occurs, all workers stop their work and go to help. According to Finnish calculations of accident costs, this participation forms the highest costs to the employer. Some customers therefore demand that the number of occupational accidents should stay under the acceptable limit.
Traffic research in Sweden has produced an idea called Vision Zero. According to this idea, no one should be killed or sustain an injury resulting in permanent impairment (Tingvall 1997). Some workplaces, at least in Finland, have already accepted the idea of Vision Zero. In other words, they follow the principle that no accident is acceptable and that all accidents are preventable.
These trends increase the expectations for safety modification behavior. Workplaces require more effective ways of changing the attitudes of workers to a more positive direction and activating them towards work safety. Alternatively, a deeper understanding of human behavior based on the advances of social and behavioral sciences makes it possible to respond to these increased requirements.
Bibliography:
- Brown R L 1978 Adapting token economy systems in occupational safety. Accidient Analysis and Prevention 10: 51–60
- Figlio K 1985 What is an accident? In: Weindling P (ed.) The Social History of Occupational Health. Croom Helm, London, pp. 180–206
- Fraser T M 1989 The Worker at Taylor and Francis, London
- Gillan D J, Wickens C D, Hollands J G, Carswell C M 1998 Guidelines for presenting quantitative data in HFES Human Factors 40: 28–41
- Greenwood M, Woods H M 1919 The Incidence of Industrial Accidents upon Individuals with Special Reference to Multiple Accidents. Medical Research Committee, Industrial Fatigue Research Board, Report 4. Her Majesty’s Stationery Office, London
- Hunter D 1955 Diseases of Occupations. Hodder and Stoughton, London
- Kazdin A E 1975 Behavior Modification in Applied Dorsey Press, Homewood, IL
- Kazdin A E 1984 Statistical analyses for single-case experimental designs. In: Barlow D H, Hersey M (eds.) Single Case Experimental Pergamon, New York
- Komaki J L 1986 Promoting job safety and accident prevention. In: Cataldo M F, Coates T J (eds.) Health and A Behavioral Medicine Perspective. Wiley, New York
- Laitinen H, Rasa P-L, Rasanen T, Nykyri E 1998 An observation method as a tool for workplace risk Technology, Law and Insurance 3: 57–61
- Locke E A, Latham G P 1990 A Theory of Goal Setting & Task Performance. Prentice Hall, Englewood Cliffs, NJ
- McKenna F P 1983 Accident proneness: A conceptual Accidient Analysis and Prevention 15: 65–71
- Naatanen R, Summala H 1976 Road-user Behavior and Traffic Accidents. North-Holland, Amsterdam
- O’Neill B 1977 A decision-theory model of danger Accidient Analysis and Prevention 9: 157–65
- Saarela K L 1990 An intervention program utilizing small groups: A comparative study. Journal of Safety Research 21: 149–56
- Saarela K L, Saari J, Aaltonen M 1989 The effects of an informational safety campaign in the shipbuilding Journal of Occupational Accidents 10: 255–66
- Saari J 1984 Accidents, and disturbances in the flow of information. Journal of Occupational Accidents 6: 91–105
- Shannon H S, Robson L S, Guastello S J 1999 Methodological criteria for evaluating occupational safety intervention Safety Science 31: 161–79
- Shaw L, Sichel H S 1971 Accident Proneness. Pergamon Press, Oxford, UK
- Skiba R 1973 Die Gefahrentragertheorie. Forschungsbericht Nr. 106. Bundesanstalt fur Arbeitsschutz and Unfallforschung, Dortmund, Germany
- Statistics Finland 1997 Accidents at Work. 1994 SVT Labour market 1997:1. Tilastokeskus, Helsinki, Finland
- Sulzer-Azaroff B, Harris T C, McCann K B 1994 Beyond training: Organizational performance management techniques. Occupational Medicine: State of the Art Reviews 9: 321–39
- Tarrants W E 1980 The Measurement of Safety Garland STPM Press, New York
- Tingvall C 1997 The Zero Vision. A road transport system free from serious health losses. In: von Holst H, Nygren A, Thord R (eds.) Transportation, Traffic Safety and Health. Springer, Berlin
- Trimpop R M 1994 The Psychology of Risk Taking North-Holland, Amsterdam
- Wilde G J S 1982 The theory of risk homeostasis: Implications for safety and health. Risk Analysis 2: 209–25
ORDER HIGH QUALITY CUSTOM PAPER

Always on-time

Plagiarism-Free

100% Confidentiality