
View sample Wealth Distribution Research Paper. Browse other research paper examples and check the list of research paper topics for more inspiration. If you need a religion research paper written according to all the academic standards, you can always turn to our experienced writers for help. This is how your paper can get an A! Feel free to contact our custom writing service for professional assistance. We offer high-quality assignments for reasonable rates.
Wealth represents a stock of accumulated assets; income represents a flow of current output. Families not only receive income over the course of a year but also save part of their income in the form of housing, savings accounts, stocks, bonds, and the like. Such accumulated savings are referred to as wealth. The first part of this research paper explains why wealth, like income, has an important bearing on the well-being of families and individuals. The second part develops the concept of household wealth; the third discusses some of the problems inherent in its measurement; the fourth shows how the structure of household wealth has changed over time; and the fifth presents time trends in the inequality of wealth. Data drawn from the USA will be utilized to illustrate parts of the discussion in the text.
Academic Writing, Editing, Proofreading, And Problem Solving Services
Get 10% OFF with 24START discount code
1. Wealth And Well-Being
Why are we interested in household wealth? Most studies use income as a measure of family well-being. Though certain forms of income are derived from wealth, such as interest from savings accounts and bonds, dividends from stock shares, and rent from real estate, income and wealth are by no means identical. Many kinds of income, such as wages and salaries and transfer payments, are not derived from household wealth, and many forms of wealth, such as owner-occupied housing, produce no corresponding income flow.
Moreover, family wealth by itself is also a source of well-being, independent of the direct financial income it provides. There are four reasons for this. First, some assets, particularly owner-occupied housing, provide services directly to their owner. This is also true for consumer durables, such as automobiles. Such assets can substitute for money income in satisfying economic needs. Families with the same money income but differing amounts of housing and consumer durables will have different levels of welfare.
Second, wealth is a source of consumption, independent of the direct money income it provides. With the possible exception of consumer durables, assets can be converted directly into cash and thus provide for immediate consumption needs. This is also true for the equity in owner-occupied housing, because second mortgages and home equity loans are another source of credit.
Third, the availability of financial assets can provide liquidity to a family in times of economic stress (such as occasioned by unemployment, sickness, or family break-up). In this sense, wealth is a source of economic security for the family over and above the income that it directly provides.
Fourth, large fortunes can be a source of economic and social power that is not directly captured in annual income. Large accumulations of financial and business assets can confer special privileges to their holders. Such large fortunes are often transmitted to succeeding generations, thus creating family ‘dynasties.’ They can also enable individuals to influence the political process through large donations to candidates running for public office. Thus, wealth holdings provide another dimension to household welfare over and above income flows.
2. What Is Household Wealth?
The conventional definition of household wealth includes assets and liabilities that have a current market value and that are directly or indirectly marketable. A typical list of assets includes owner-occupied housing and other real estate; cash, checking and savings accounts; bonds and other financial instruments; corporate stock; equity in unincorporated businesses; and trust fund equity. This measure will be referred to as ‘marketable household wealth’ (or simply ‘household wealth’), since it represents those assets over which the family or individual has control. This notion corresponds to wealth as a store of value and is used in conjunction with a standard national accounting framework.
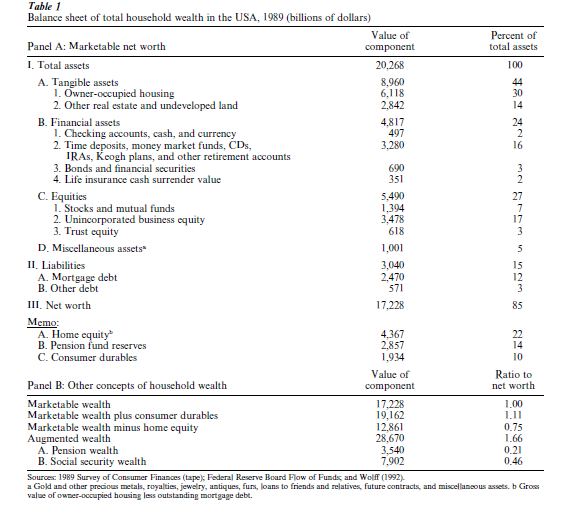
Table 1 presents the balance sheet for the US household sector in 1989. The wealth accounts are first divided into two major categories: assets and liabilities. Assets consist of items owned by households which have a positive value to them, while liabilities are debts, which by definition have a negative value. The difference between total assets and total liabilities is called net worth or, simply, wealth. In 1989, total household assets amounted to 20.3 trillion dollars, total liabilities were 3.0 trillion, and household net worth was 17.2 trillion.
Assets are divided into three main groups. The first, tangible assets, include stocks of real goods that are both ‘reproducible,’ such as houses, and ‘nonreproducible,’ such as land. In 1989, total tangible assets owned by households were worth 9.0 trillion dollars, which amounted to 44 percent of total household assets. The major tangible asset owned by households is owner-occupied housing (that is, houses that are lived in by their owner). This accounted for 30 percent of total household assets. The second component consists of land, apartment buildings, other rental property, and other real estate held by households. This group made up 14 percent of all assets.
The second major group is referred to as financial assets. These are assets which function as money or are readily convertible to money. They include cash, demand deposits (checking accounts), and time and savings deposits, which function directly as a means of exchange. They also include bonds, notes, and financial securities issued mainly by corporations and the government. Such securities are ‘promissory notes,’ by which the borrower agrees to pay back the lender a certain amount of money (the principal plus interest) at a certain date. The fourth component in this group is the ‘cash surrender value’ of life insurance funds. Certain life insurance plans (called ‘full life insurance’) allow individuals to contribute to a savings fund, and the amount the individual can withdraw from this savings fund is referred to as its cash surrender value.
In 1989, financial assets constituted 24 percent of household assets. Demand deposits and currency together amounted to only 2 percent of total assets, while time and savings deposits together with CDs, money market funds and pension accounts constituted 16 percent. Bonds and other securities amounted to 3 percent, while the cash surrender value of insurance plans was only 2 percent.
The third major group consists of equities or ownership rights. A corporate stock certificate issued by a company represents ownership of a certain percentage of the company’s assets. Unincorporated business equity refers to small businesses (such as a farm or a store) owned directly by individuals, in contrast to corporations which are owned through stock shares. A person’s equity in an unincorporated business is the value of the business. The third item, trust fund equity, refers to bank deposits, securities, corporate stock, and other financial instruments, which are held in a special legal arrangement called a trust fund. In a typical trust, the actual assets are managed by a specially named administrator (often a bank), and the income earned from the assets in the trust are remitted to individual beneficiaries. Trust funds held for individuals are counted as part of household wealth.
As a group, equities comprised 27 percent of total household assets in 1989. Corporate stock shares made up 7 percent of total household assets, unincorporated business equity 17 percent, and trust fund equity 3 percent.
On the liability side, the major form of household debt is home mortgages. A mortgage is a loan, issued normally by a bank and usually for a period from 15 to 30 years, that is used to finance the purchase of real property, particularly houses to live in. In 1989, mortgage debt comprised 81 percent of total household debt. The remaining 19 percent consisted of other household debt, including automobile and other consumer loans and credit card debt. Together, total household debt amounted to 15 percent of the value of total household assets.
Three other entries are shown in the bottom of Table 1. The first of these is home equity, defined as the gross value of owner-occupied housing less outstanding mortgage debt. This represents the amount of money a family could net from the sale of the house (after paying off its outstanding mortgage balance). Home mortgages amounted to 29 percent of the value of owner-occupied housing. As a result, home equity made up a smaller proportion of total assets than the gross value of owner-occupied housing—22 vs. 30 percent.
The second entry is the reserves (assets) of pension funds. These funds are accumulated mainly by corporations in order to pay pension benefits for their workers when they retire. In 1989, they amounted to 14 percent of total household assets. Technically speaking, these reserves are not part of marketable household wealth, since households have no control over the assets in these funds and cannot directly draw on these funds. However, these reserves are held for the benefit of individuals and therefore have some of the characteristics of a trust fund. The third category, called consumer durables, includes automobiles, washing machines and other appliances, furniture, and other long-lasting household equipment. Cars are the major component of household durables, and altogether durables amounted to 10 percent of total assets.
A theme that regularly emerges in the literature on household wealth is that there is no unique concept or definition of wealth that is satisfactory for all purposes. One alternative definition is the sum of marketable wealth and consumer durables. This concept is useful because consumer durables provide consumption services directly to the household, though they are not easily marketed and the resale value of these items typically far understates the value of their consumption services to the household. As shown in Panel B, the sum of marketable wealth and consumer durables amounted to 19.2 trillion dollars in 1989, which was 11 percent greater than marketable wealth.
A second is defined as marketable net worth minus net equity in owner-occupied housing. This definition represents a more ‘liquid’ concept than marketable wealth, since one’s home is difficult to convert into cash in the short term. It thus reflects the resources that may be directly available for consumption or various forms of investments in the short term. This concept totaled 12.9 trillion dollars in 1989, 75 percent of marketable wealth.
One of the major developments since the end of World War II has been the enormous growth in both public and private pension systems. Even though such pension funds are not under the direct control of individuals, they are a source of future income to families and thus may be perceived as a form of family wealth. Moreover, as Martin Feldstein (1974) has argued, insofar as families accumulate ‘traditional’ wealth to provide for future consumption needs, the growth of such pension funds may have offset private savings and hence traditional wealth accumulation.
A wider definition of household wealth will thus add some valuation of pension rights, from both public and private sources, to marketable wealth. Such a measure provides a better gauge of potential future consumption. Augmented household wealth is defined as the sum of household marketable wealth, social security wealth, and pension wealth. Social security wealth is defined as the present discounted value of the stream of future social security benefits, and pension wealth is defined as the present discounted value of future pension benefits (see Wolff 1992, for a discussion of measurement issues). As is apparent from the definitions, these two forms of wealth are not fungible or marketable, since individuals cannot convert these assets into cash.
What is the rationale for including these two forms of wealth? The main motivation is that, from the standpoint of an individual, a future guaranteed flow of income is in many ways like owning a financial asset. Indeed, there are marketable assets called ‘annuities’ which have precisely the characteristic of providing a steady stream of income after a certain time (or age) is reached. The anticipated social security (or pension) benefits that an individual will receive after retirement is comparable to such an annuity. From the individual’s point of view, then, a guaranteed stream of future pension or social security benefits may be as much a form of wealth as money put into a savings account that will be drawn on after retirement.
According to my estimates, total pension wealth in 1989 was 3.5 trillion dollars and total social security wealth was 7.9 trillion dollars (see Panel B). Together, they amounted to 66 percent of marketable net worth. Social security wealth by itself was thus larger than any other component of household wealth, including owner-occupied housing and total bank accounts.
3. Problems In Measuring Household Wealth
There have been four principal sources of data for developing household wealth estimates: (a) estate tax data; (b) household survey data; (c) wealth tax data; and (d) income capitalization techniques. Each has its characteristic advantages and disadvantages.
3.1 Estate Tax Data
Estate tax data was the first major source of data used for wealth analysis. When someone dies, that person’s assets are said to comprise his or her estate, and estate tax records are actual tax returns filed for probate. Such data have a great degree of reliability, since they are subject to scrutiny and audit by the state. Their main limitation in the USA, at least, is that the threshold for filing is relatively high, so that only a small proportion of estates (typically 1 percent or so) are required to file returns. In the UK the threshold is considerably lower, so that the majority of estates file tax returns. This is also true for some states in the USA, as well as Washington, DC, which have their own estate tax requirements.
Another difficulty with this data source is that the sample consists of decedents. Since most researchers are interested in distribution of wealth among the living population, a technique based on ‘mortality multipliers’ is used to infer the distribution of wealth among the actual population. If mortality rates were the same for each group, then the wealth of decedents would constitute a representative sample of the living population, and researchers could use the estate data directly. However, mortality rates are much greater for older people than younger people, so that different ‘weights’ must be given to the estates filed by decedents of different ages. Mortality rates are also higher for men than for women (that is, women, on average, live longer than men), and also higher for black individuals than whites. As a result, estates are assigned a weight based on the inverse of the group’s mortality rate, and these are then used to generate the size distribution of wealth in the living population.
Estimates of wealth inequality based on this technique are, as might be expected, quite sensitive to the precision of the mortality multipliers. The estimates can have a very large standard error, particularly for the young, since there are very few of them in the sample. This means that the results are very sensitive to who happens to die in a given year and may therefore not be very reliable for young adults. There are two other problems associated with this technique. First, insofar as mortality rates are inversely correlated with wealth (that is, the rich tend to live longer), the resulting multipliers can be biased (see Shorrocks 1975). Most studies do try to correct for this problem by using mortality rates for the wealthy that are lower than for the population as a whole, due to the longer expected life span of the wealthy.
Second, the distribution of wealth estimated by this technique is for individuals rather than for families. Changing ownership patterns within families (for example, joint ownership of the family’s house) can affect estimated wealth concentration. For example, marital customs and relations have changed over the century. Married women now inherit more wealth and have higher wealth levels than they did in 1900 or 1930. This reduces individual concentration even if household wealth inequality does not change. For example, between 1929 and 1953, Robert Lampman (1962) reported that the percentage of married women among top-wealth holders increased from 9 to 18 percent.
As a result, since most researchers are interested in the distribution of family wealth rather than individual wealth, additional imputations must be performed to infer family wealth from estimates of individual wealth holdings. These typically involve making assumptions about marriage patterns—in particular, the correlation between the wealth holdings of spouses (whether, for example, rich husbands tend to be married to rich wives or poor wives).
Another problem with this data source is underreporting and nonfiling for tax avoidance. Though the returns are subject to audit, the value of cash on hand, jewelry, housewares, and business assets are difficult to ascertain. Their value is typically understated in order to reduce the tax liability of the estate. Moreover, inter vivos transfers (that is, transfers of wealth between living individuals), particularly in anticipation of death, can bias estimates of household wealth among the living. If older people pass on wealth to their children just before they die, then their estates would tend to under-represent the wealth of comparably aged individuals still living.
Estate tax data have been used by Atkinson and Harrison (1978) for the UK, and Lampman (1962), Smith (1984), and Wolff (1996a) for the USA. The long-term time-series on wealth concentration for the UK and the USA are based on estate tax data.
3.2 Household Survey Data
Household surveys are questionnaires that are given to a sample of households in a population. Their primary advantage is to provide considerable discretion to the interviewer about the information requested of respondents. Their major drawbacks are that information provided by the respondent is often inaccurate (response error), and, in many cases, the information requested is not provided at all (nonresponse problems). Another problem is that, because household wealth is extremely skewed, the very rich (the so-called ‘upper tail’ of the distribution) are often considerably under-represented in random samples. An alternative is to use stratified samples, based typically on income tax returns, which oversample the rich. However, studies indicate that response error and nonresponse rates are considerably higher among the wealthy than among the middle-class. Moreover, there are problems in ‘weighting’ the sample in order to reflect the actual population distribution. Household surveys have been used extensively in many countries (see Wolff 1996b for a survey).
3.3 Income Capitalization Techniques
The third source of wealth data is based on the ‘income capitalization’ technique, which is usually applied to a sample of income tax returns. The earliest use of this technique on US data was a 1939 study by Stewart. In this procedure, certain income flows, such as dividends, rents, and interest, are converted into corresponding asset values based on the average asset yield. For example, dividends are capitalized into corporate stock holdings by dividing dividends reported in an income tax return by the average ratio of dividends to corporate stock in the economy as a whole. This technique when applied to a large sample of tax returns can provide an estimate of the size distribution of wealth.
This source also suffers from a number of problems. First, only assets with a corresponding income flow are covered in this procedure. Thus, owner-occupied housing, consumer durables, and idle land cannot be directly captured. Also, in the USA, state and local bonds cannot be estimated, because this source of interest income is exempt from federal income taxes. Second, the estimation procedure rests heavily on the assumption that asset yields are uncorrelated with asset levels (that is, for example, that large stock holders will receive the same average return on their stock holdings as small stock holders). Any nonzero correlation between asset holdings and yields can produce biased estimates. Third, the observational unit is the tax return. Various assumptions must be made in order to construct family wealth estimates from tax unit wealth.
3.4 Wealth Tax Data
A fourth source is wealth tax return data, which are available in a number of European countries such as Germany, Sweden, and Switzerland. These countries assess taxes not only on current income but also on the stock of household wealth. Though there is typically a threshold for paying wealth taxes, population coverage can be considerably greater than that of estate tax returns. However, the measurement problems are similar to those of estate tax data. The filer has a great incentive to understate the value of his or her assets, or even not to report them at all, for tax avoidance. Moreover, the assets subject to tax do not cover the full range of household assets (for example, consumer durables, pensions, and life insurance policies are often excluded). In addition, the observational unit is the tax return unit, which does not directly correspond to the family unit. Wealth tax data have been used extensively by Spant (1987) for an analysis of wealth trends in Sweden.
4. Changes In The Composition Of Household Wealth
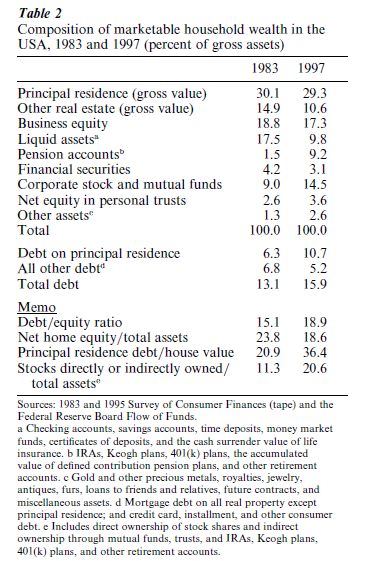
There have been some significant changes in the composition of marketable wealth in the USA over the last two decades. One of the most salient trends is the rising indebtedness of American families, with the debt–equity ratio leaping from 15.1 to 18.9 percent between 1983 and 1997. The principal source of these increases is not rising consumer debt, like credit card balances. In fact, nonmortgage debt as a fraction of total assets fell from 6.8 to 5.2 percent over the period from 1983 to 1997.
Rather, the primary source is rising mortgage debt, including home equity loans and second mortgages, which climbed from 6 to 11 percent of total assets. Indeed, mortgage debt as a share of the value of homeowner’s property increased from 21 to 36 percent. Whereas the total market value of homes remained almost constant as a share of total assets over this period, net home equity—the value of the house minus any outstanding mortgages—plummeted from 24 to 19 percent of total assets.
A second notable change is that pension accounts rose from 1.5 to 9.2 percent of total assets between 1983 and 1997. However, this increase almost exactly offset the decline in liquid assets, from 17.5 to 9.8 percent. As a result, the explosion in the use of various pension type accounts, like IRAs, 401(k) plans, and other thrift plans, rather than increasing overall family savings, appears, instead, to have allowed households to substitute tax-free pension accounts for taxable savings deposits.
A third important change is the sharp rise in the share of corporate equities in total assets, from 9.0 to 14.5 percent, reflecting the bull market in corporate stocks. However, this result does not reflect the full extent of the growth in corporate stock holdings, because stocks are also indirectly held in mutual funds, pensions accounts, and trust funds. If we include these, then corporate stocks, both directly and indirectly owned by households, almost doubled, from 11.3 to 20.6 percent of total assets.
5. The Recent Rise In Household Wealth Inequality
The final part of the analysis both highlights the sharp increase in wealth inequality in the USA since the early 1980s and illustrates the sensitivity of wealth inequality estimates to different definitions of household wealth.
The calculations shown in Table 3 indicate an extreme concentration of wealth in 1995. The top 1 percent of families (as ranked by marketable wealth) owned almost 39 percent of total household wealth. The figures also show that wealth inequality, after rising steeply between 1983 and 1989, increased at a slower pace from 1989 to 1995. The share of wealth held by the top 1 percent rose by 3.6 percentage points from 1983 to 1989. Between 1989 and 1995, the share of the top percentile grew by a more moderate 1.1 percentage points. Projections to 1997, on the basis of asset price movements between 1995 and 1997, suggest that wealth concentration may have risen sharply again over these two years, largely from the surge in stock prices (and the fact that stock shares are highly concentrated in the hands of the rich). The share of the top 1 percent appears to have grown by another 1.6 percentage point.
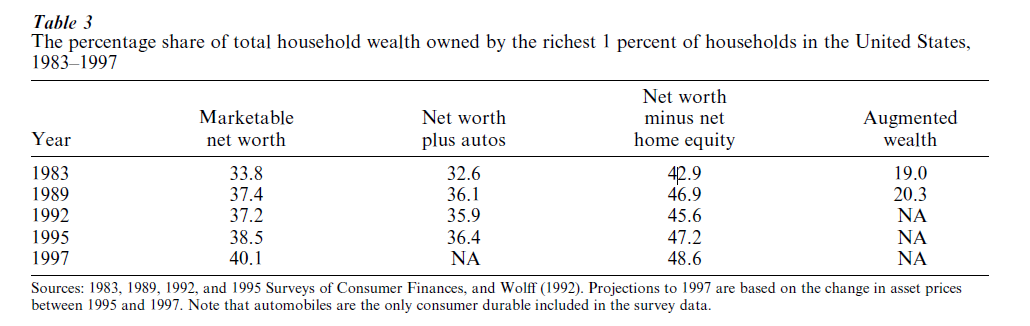
The inclusion of automobiles in household wealth (the only consumer durable available in the wealth survey data) lessens the estimated share of the richest 1 percent by about 1 percentage point in 1983 and by 2 percentage points in 1995. This reflects both the fact that automobiles are more widely distributed in the population than other assets and that the importance of vehicles in the portfolio of poorer and middle- income families has risen over time. However, the data also show similar time trends—a sharp rise in wealth inequality between 1983 and 1989 followed by a modest increase from 1989 to 1995.
Household wealth excluding home equity is even more concentrated than marketable wealth, with the richest 1 percent (as ranked by this concept of wealth) owning 47 percent of the total. The trend in inequality is similar, with the share of the top 1 percent gaining 4.0 percentage points between 1983 and 1989 and another 0.3 percentage points in the ensuing six years. Projections to 1997 suggest another rise in the share of the richest percentile, by 1.4 percentage points.
Table 3 also shows the trend in the share of augmented household wealth owned by the top 1 percent of wealth holders as ranked by augmented wealth from 1983 to 1989. The addition of pension and social security wealth has had a significant effect on measured wealth inequality because pension and social security wealth, particularly the latter, have grown much faster over time than marketable wealth and because social security wealth is more evenly distributed in the population than marketable assets. The gap in the share of the top 1 percent between marketable wealth and augmented wealth was almost 15 percentage points in 1983 (34 vs. 19 percent). However, wealth concentration based on augmented wealth still shows an increase between 1983 and 1989 (more current estimates are not available).
Future research might most appropriately be focused on understanding the factors behind changing wealth inequality both in the USA and other advanced nations (household wealth data are not currently available for less developed countries). How have relative wealth holdings changed among age groups, among income classes, across racial and ethnic lines within a country, between families with children and those without children, and across gender lines? How have wealth holdings changed among countries of the world? What are the respective roles of household savings and intergenerational wealth transfers in explaining wealth differences among individuals and between groups? What are the reasons for rising indebtedness among American families, and how does this compare to other countries? These are some of the salient research issues that occupy current researchers in the field.
Bibliography:
- Atkinson A B, Harrison A J 1978 Distribution of Personal Wealth in Britain. Cambridge University Press, Cambridge, UK
- Feldstein M 1974 Social security, induced retirement, and aggregate capital accumulation. Journal of Political Economy 82: 905–26
- Lampman R J 1962 The Share of Top Wealth-Holders in National Wealth, 1922–56. Princeton University Press, Princeton, NJ
- Lipsey R E, Tice H (eds.) 1989 The Measurement of Saving, Investment, and Wealth. Chicago University Press, Chicago
- Shorrocks A F 1975 The age–wealth relationship: a cross-section and cohort analysis. Review of Economics and Statistics 57: 155–63
- Shorrocks A F, Davies J B 1999 The distribution of wealth. In: Atkinson A B, Bourguignon F (eds.) Handbook of Income Distribution. North-Holland, Amsterdam
- Smith J D (ed.) 1975 The Personal Distribution of Income and Wealth, NBER, Studies in Income and Wealth. Columbia University Press, New York, No. 39
- Smith J D 1984 Trends in the concentration of personal wealth in the united states 1958–1976. Review of Income and Wealth Series 30(December): 419–28
- Spant R 1987 Wealth distribution in Sweden: 1920–1983. In: Wolff E N (ed.) International Comparisons of the Distribution of Household Wealth. Oxford University Press, Oxford, UK
- Stewart C 1939 Income capitalization as a method of estimating the distribution of wealth by size group. In: Studies in Income and Wealth. National Bureau of Economic Research, New York, Vol. 3
- Wolff E N (ed.) 1987 International Comparisons of the Distribution of Household Wealth. Oxford University Press, Oxford, UK
- Wolff E N 1992 Methodological issues in the estimation of retirement wealth. In: Slottje D J (ed.) Research in Economic Inequality. JAI Press, Greenwich, CT, Vol. 2, pp. 31–56
- Wolff E N 1996 a TOP HEAVY: A Study of Increasing Inequality of Wealth in America, Updated and expanded edition. The New Press, New York
- Wolff E N 1996 b International comparisons of wealth inequality. Review of Income and Wealth Series 42(4): 433–51
- Wolff E N 1998 Recent trends in the size distribution of household wealth. Journal of Economic Perspectives 12(3): 131–50
ORDER HIGH QUALITY CUSTOM PAPER

Always on-time

Plagiarism-Free

100% Confidentiality