
View sample Tropospheric Ozone Research Paper. Browse other research paper examples and check the list of research paper topics for more inspiration. If you need a religion research paper written according to all the academic standards, you can always turn to our experienced writers for help. This is how your paper can get an A! Feel free to contact our custom writing service for professional assistance. We offer high-quality assignments for reasonable rates.
While stratospheric O3 protects life by absorbing damaging solar UV radiation, ground-level O3 can harm life by oxidizing living tissue. Under appropriate meteorological conditions, anthropogenic emissions of nitrogen oxides, volatile organic compounds, and carbon monoxide can trigger O3 pollution episodes with ground-level concentrations enhanced by factors of 2 or more. One consequence of these enhancements can be a reduction in agricultural crop yields.
Academic Writing, Editing, Proofreading, And Problem Solving Services
Get 10% OFF with 24START discount code
1. Atmospheric Ozone
Ozone is a 3-atom allotrope of oxygen and thus has the chemical formula: O3. It is gas with a pungent odor and hence its name, which is derived from the Greek word ozien meaning smell. Christian Fredrick Schobein generally is credited with first identifying O3as a compound in the laboratory in 1840, and John Hartley is credited with demonstrating its ubiquitous presence in the atmosphere in 1881.
O3 is one of a myriad of atmospheric trace species, so called because their atmospheric abundances are of the order of one part per million (ppm) or less, where 1 ppm of a gas signifies an atmospheric abundance of 1 molecule for every million atmospheric molecules. In fact, in the case of O3 there are on average about 3.5 O3 molecules for every 100 million atmospheric molecules. If the entire atmosphere were compressed to a pressure of 1 atmosphere (i.e., the pressure at the earth’s surface), it would have a height of about 8.5 km. If the same were done to atmospheric ozone (O3 ), it would have a height of only 0.3 cm.
Despite its seemingly minute concentration, atmospheric O3 has an enormous environmental impact. As a constituent of the stratosphere, where about 90 percent of the atmosphere’s O3 resides, it protects life from harmful uv radiation from the sun. In the troposphere, O3 plays a key role in determining the oxidizing capacity of the atmosphere, facilitating the process by which the atmosphere is flushed of a wide range of pollutants. O3 at ground level represents a small but important component of the overall tropospheric O3 burden. Because of its properties as a powerful oxidant, ground-level O3 can have adverse effects on human health, agricultural crops, and forests
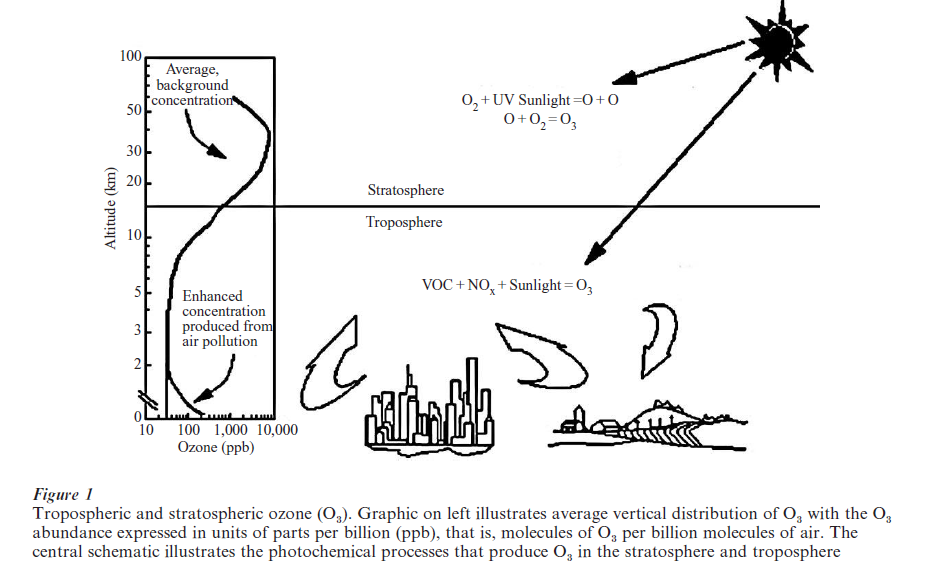
As illustrated in Fig. 1, O3 concentrations generally increase with increasing altitude throughout the troposphere (the lowest 10–15 km of the atmosphere) and much of the stratosphere. O3 concentrations typically range from about 30 ppb near the ground to about 100 ppb or more near the top of the troposphere, where 1 ppb O3 signifies an abundance of 1 molecule of O3 for every billion molecules of air. However, ground level O3 concentrations can exceed 100 ppb during air pollution episodes and especially in urban areas. The highest hourly-averaged O3 concentration on record in North America is apparently 680 ppb measured in downtown Los Angeles in 1955. When ground-level O3 concentrations reach these levels, they threaten rather than sustain life. In particular, they can damage agricultural crops, ultimately causing a reduction in the crop yields grown in affected regions.
2. The Generation Of Tropospheric O3
The basic chemical mechanism responsible for the generation of O3 in the stratosphere was first worked out by Sidney Chapman in the 1930s. However, it would take a few more decades before scientists began to understand the chemical reactions that produce tropospheric ozone.
Stratospheric O3 production involves two reactions (see Fig. 1). The first is the photolysis and dissociation of molecular oxygen (O2 ) by uv radiation from the sun. The second reaction involves the combination of an oxygen atom produced from the first reaction with another O2 molecule.
Because ultraviolet radiation from the sun capable of photolyzing O2 does not penetrate into the troposphere, it was believed for a number of decades following Chapman’s work that O3 is an inert constituent of the troposphere. It was argued that the downward transport of O -rich air from the stratosphere is the source of tropospheric O3 and reaction with material on the earth’s surface (a process referred to as dry deposition) removes O3 . However, the appearance of photochemical smog in Los Angeles in the 1950s, and the realization that O3 was a major product of this pollution forced a gradual reappraisal of this simple picture. Today, it is recognized widely that chemical production of O3 occurs throughout the troposphere, at relatively modest rates within the more pristine regions of the atmosphere and at significantly accelerated rates in polluted regions.
2.1 The Chemical Reactions That Produce Tropospheric Ozone
A scientist by the name of A. J. Haagen-Smit first unraveled the chemical mechanism that produces O3 in the lower atmosphere. Working in Los Angeles in the early 1950s, Haagen-Smit became interested in understanding how photochemical smog was formed and what was in the smog that made it noxious. He irradiated mixtures of volatile organic compounds (VOC) and nitrogen oxides (NOx) in a reaction chamber. (Both VOC and NOx are emitted into the atmosphere by automobiles and other industrial processes and NOx represents the sum of nitric oxide or NO and nitrogen dioxide or NO2.) After a few hours, Haagen-Smit observed the appearance of cracks in rubber bands stretched across the chamber. Knowing that ozone (O3) can harden and crack rubber, HaagenSmit correctly reasoned that photochemical smog was caused by photochemical reactions involving VOC and NOx, and that one of the major noxious constituents in this smog was O (see Fig. 1).
Since Hagen-Smit’s work, more sophisticated lab- oratory experiments, along with advanced chemical monitors and computer simulation models have made it possible to further elucidate the chemical reactions that form O in the troposphere. A typical reaction sequence might include:
(a) RH + OH → R + H2O
(b) R + O2 + M → RO2 + M
(c) RO2 +NO → RO + NO2
(d) RO + O2 → HO2 + carbonyl
(e) HO NO OH NO
(f) 2 × (NO2 + hν → NO + O)
(g) 2 × (O + O2 + M → O2 + M)
—————————————-
NET:RH + 4O2 + 2 hν → 2O + carbonyl + H2O
In the above, RH represents a hydrocarbon (i.e., a type of VOC), R is a hydrocarbon radical or compound fragment (e.g., CH2 CH2 for RH = ethane), hν represents a photon from the sun and M is a nonreactive, energy absorbing molecule referred to by chemists as a ‘third body.’ In the atmosphere, this third body is most often molecular nitrogen (N2 ) or molecular oxygen (O3 ). Carbon monoxide (CO) can replace the VOC. In this case the reaction sequence is initiated by
(h) CO + OH → CO + H
(i) H + O2 + M → HO2 + M
and then followed by Reactions (e), (f), and (g).
In the above reaction sequences, VOC and CO are oxidized and consumed, while NOx acts as a catalyst. Collectively these three compounds are often referred to as O3 precursors. The by-product labeled ‘carbonyl’ is itself a VOC and can react and produce more O3. The OH radical, which triggers the sequence by reacting with VOC or CO, is generated initially in the atmosphere from O3:
(j) O3 + hν → O* + O3
(k) O* + H2 O → 2OH
where O* is an electronically excited atom of oxy- gen. Because the OH consumed by Reaction (a) or (h) is regenerated by Reaction (e), and, because more OH can be generated during the breakdown of the carbonyl produced by Reaction (d), the reaction sequences listed above are net sources of O3 .
In clean regions of the troposphere, O3 is produced primarily by the oxidation of isoprene (C5 H8 ) and/or methane (CH4 ), hydrocarbons that are emitted into the atmosphere by biogenic processes, as well as CO. The catalyst NOx largely is supplied by lightning as well as soil emissions. In polluted regions, VOC from automobiles, solvents, and various industrial processes become important, and the NOx arises largely from automobiles and power-plant emissions.
2.2 Ozone Pollution Events
Ground-level O3 concentrations tend to be largest during specific periods or episodes when meteorological conditions favor the production and accumulation of pollutants within the atmospheric boundary layer. (The atmospheric boundary layer denotes the first 1–2 km of the atmosphere where winds are slowed by frictional resistance with the earth’s surface. The frictional resistance, in turn, creates turbulence within the layer that tends to keep pollutants and other chemical constituents uniformly mixed. For this reason the atmospheric boundary layer is also referred to as the mixed layer.) These conditions are often associated with summertime, slow-moving high-pressure systems that can extend over thousands of kilometers. Ground-level O3 concentrations during
these pollution episodes tend to be highest in and around urban areas. However, suburban sprawl, growing numbers of automobiles and expanding roadway networks coupled with the large spatial scale of the meteorological conditions that foster the pollution, can lead to enhanced O3 concentrations over thousands of kilometers, encompassing agricultural as well as urban areas. To distinguish this type of pollution from more localized or urban-scale pollution, it is often referred to as regional air pollution. The repetition of regional air pollution episodes in agricultural areas over a growing season can produce a pattern of chronic exposure that can, in principle, reduce crop yields. The extent of crop-yield reduction depends upon both the degree of exposure and the sensitivity of the crop to O3 , as discussed below.
3. Ozone Effects On Crops
The first documentation of O3 damage to crops arose out of studies of the effects of photochemical smog in Los Angeles in the 1940s and 1950s. Subsequent research by scientists throughout the world have provided a rudimentary understanding of the mechanisms by which O3 can affect vegetation and the development of semiquantitative relationships between exposure to O3 and crop yield.
O3 damage to vegetation most often occurs as a result of penetration into the leaf interior through the stomata and then reaction with the cell’s plasmalemma (i.e., cell membrane) and/or mesophyl (i.e., cell interior). Field studies using open-top chambers to control the O3 concentrations in contact with crops growing under otherwise ambient conditions have established that crop sensitivities to O3 vary from crop to crop and, within a given crop, from variety to variety. In general: (a) O3 damage to crops becomes observable when concentrations exceed a threshold of about 50–70 ppb; (b) the effects of repeated intermittent exposures above this threshold tend to accumulate over a growing season; and (c) the higher the O3 concentration above the threshold the greater the damage.
Because O3 damage to crops accumulates over a growing season, any metric used to quantify crop exposure to O3 must integrate over all pollution episodes occurring in that season. One such metric is the so-called ‘SUM06’ that represents the sum of all daytime, 1-hour-averaged O3 concentrations in excess of 60 ppb over a 3-month period. Analysis of data from the US National Crop Loss Assessment Network suggests that the average yields of crops grown in North America are reduced by about 10 percent when SUM06 exposures are about 15–25 ppm-hours, where 1 ppm-hour is equivalent to 1,000 ppb-hours. Exposures of this magnitude are not uncommon in rural areas of many industrialized and developing nations.
3.1 Implication For World Food Production
O3 damage to crops is likely to be most severe in those areas where there is an intermingling of the urban and industrial activities that lead to the emissions of VOC, CO, and NOx and agricultural activities on spatial scales of thousands of kilometers. It turns out that such an intermingling of the urban and industrial with the agricultural is quite common in the developed world and is most pronounced in three regions of the northern mid-latitudes: (a) Eastern North America (25–50°N 105–60°W); (b) Europe (36–70°N, 10°W– 90°E); and (c) eastern China and Japan (25–45°N, 100–146°E). Within each of these regions, urban– industrial and agricultural activities tend to cluster together into a single large network or plexus of human-impacted land-use categories. The term Metro-Agro-Plex (or MAP) is sometimes used as a shorthand to describe this intermingling of agricultural and urban-industrial activities within a developed or developing geographical area. The term Continental-Scale Metro-Agro-Plexes (or CS-MAPs) is in turn used to specifically refer to the three large MAPs of the northern mid-latitudes.
Collectively, the CS-MAPs represent a major force in the global economy and also in environmental change. Although they comprise only 23 percent of the earth’s land surface, the three CS-MAPs account for about 75 percent of world’s consumption of commercial energy and fertilizers and about 60 percent of the food crop production and food exports. They are also major source regions for atmospheric pollutants including the O3 precursors. Estimates using a global atmospheric chemistry model indicate that, because of these emissions, about 10–35 percent of the world’s cereal crops currently are exposed to potentially damaging O3 pollution within the CS-MAPs. The net effect of this exposure to the world’s total production of cereals and other food staples probably amounts to few percent decrease in total production. However, the presence of other pollutants that accompany O3 in photochemical smog most likely exacerbate the crop losses. For example, the haze associated with photochemical smog and O3 pollution reduces the amount of sunlight that reaches the earth’s surface and this likely also reduces crop yields. Moreover, as pollutant emissions increase in developing nations the impacts on agriculture within these areas will become more severe. The economic implications of such crop losses have yet to be assessed. However, in countries like China, where growing populations and rising standards of living may soon begin to strain food production capacities, the effect of O3 and related pollutants on agriculture could conceivably have adverse or even dire consequences.
4. Tropospheric Ozone And Global Change
The spread of O3 pollution may extend beyond the regional scale to the continental, and even hemispheric scale. Analyses of late nineteenth and early twentieth century O3 datasets indicate that tropospheric O3 in the northern hemisphere has undergone significant variations over the past century and continues to vary in some regions of the globe today. The evidence for long-term variations in free tropospheric O3 is strongest in Europe where measurements of O3 date back to the 1800s. For example, German scientists Volz and Kley (1988) used current techniques for measuring O3 to recalibrate O3 measurements made in Paris in the late nineteenth century. Their analysis indicates that tropospheric O3 concentrations at the end of the 1800s were about a factor of 2 less than current concentrations over Europe. Subsequent analyses have reached similar conclusions. The implications of such a long-term O3 trend for understanding O3 pollution effects on humans and ecosystems have yet to be fully explored but could be considerable.
Bibliography:
- Brasseur G P, Orlando J J, Tyndall G S 1999 Atmospheric Chemistry and Global Change. Oxford University Press, Oxford, UK
- Brown L R 1995 Who Will Feed China? Wake-up Call For a Small Planet. Norton, New York
- Chameides W L, Kasibhatla P S, Yienger J, Levy H II 1994 Growth of continental-scale metro-agro-plexes, regional ozone pollution, and world food production. Science 264: 74–7
- Chameides W L, Li X, Tang X, Zhou X, Luo C, Kiang C S, St. John J, Saylor R D, Liu S C, Lam K S, Wang T, Giorgi F 1999 Is ozone pollution affecting crop yields in China? Geophysical Research Letters 26: 867–70
- Crutzen P J, Zimmermann P H 1991 The changing photochemistry of the troposphere. Tellus 43AB: 136–51
- Fishman J, Kalish R 1990 Global Alert: The Ozone Pollution Crisis. Plenum, New York
- Finlayson-Pitts B J, Pitts J N 1997 Tropospheric air pollution: Ozone, airborne toxics, polyclic aromatic hydrocarbons, and particles. Science 276: 1045–51
- Haagen-Smit A J 1952 Chemistry and physiology of Los Angeles smog. Industrial and Engineering Chemistry 44: 1342–6
- Heck W W, Cowling E B 1997 The need for a long term cumulative secondary ozone standard—An ecological perspective. Environmental Management 23: 33
- Lefohn A S 1992 Surface Le el Ozone Exposures and Their Effects on Vegetation. Lewis, Chelsea, MI
- Levy H II, Kasibhatla P S, Moxim W J, Klonecki A A, Hirsch A I, Oltmans S J, Chameides W L 1997 The global impact of human activity on tropospheric ozone. Geophysical Research Letters 24: 791–4
- Logan J A 1989 Ozone in rural areas of the United States. Journal of Geophysical Research 94: 8511–32
- Seinfeld J H, Atkinson R, Berglund R I, Chameides W L, Cotton W R, Demerjian K I, Elston J C, Fehsenfeld F, Finlayson-Pitts B J, Harriss R C, Kolb C E, Lioy P J, Logan J A, Prather M J, Russell A, Steigerwald B 1991 Rethinking the Ozone Problem in Urban and Regional Air Pollution. National Academy Press, Washington, DC
- Seinfeld J H, Pandis S N 1998 Atmospheric Chemistry and Physics. Wiley Interscience, New York
- Turco R P 1997 Earth Under Siege: From Air Pollution to Global Change. Oxford University Press, Oxford, UK
- Volz A, Kley D 1988 Evaluation of the Montsouris series of ozone measurements in the nineteenth century. Nature 332: 240–2
ORDER HIGH QUALITY CUSTOM PAPER

Always on-time

Plagiarism-Free

100% Confidentiality