
View sample Transportation, Supply, And Congestion Research Paper. Browse other research paper examples and check the list of research paper topics for more inspiration. If you need a religion research paper written according to all the academic standards, you can always turn to our experienced writers for help. This is how your paper can get an A! Feel free to contact our custom writing services team for professional assistance. We offer high-quality assignments for reasonable rates.
1. Congestion
Transportation facilities are prone to congestion because of peaks in travel demand, inflexibility of supply and inability to store transport services. Urban road traffic congestion and congestion in air travel impose significant economic costs. Traditional policies to alleviate congestion such as building new roads have had at best, limited success. Congestion pricing has the greatest theoretical potential because it can affect all dimensions of travel behavior.
Academic Writing, Editing, Proofreading, And Problem Solving Services
Get 10% OFF with 24START discount code
2. Introduction
Technological advances in transportation since the industrial revolution have spurred the growth and spread of cities, enabled people to live far from where they work, and made long-distance business and recreational travel commonplace. Yet growth in travel has been accompanied by increasing adverse side effects: noise, air pollution, accidents, and congestion—the subject of this research paper. To be sure, congestion is not a recent phenomenon. Two thousand years ago chariot riding was banned in Rome during peak hours because of traffic jams (Gibbs 1997). But the automobile and other motorized forms of transportation have increased the prevalence of congestion in surface travel, and congestion in air travel has become a serious problem.
The most widespread and costly form of congestion is travel delay. Delay on the roads is manifest as reduced speeds, and queues at intersections and entrances to freeways. Air travelers suffer delay in checking in, passing through security, boarding an aircraft, waiting to take off and land, clearing customs and immigration, and retrieving baggage at the destination. A fishing vessel on busy waters endures delay in procuring the catch when other vessels get in its way (Walters 1987). These examples feature delay systems in which users experience delays but eventually complete their trips. Delay systems differ from loss systems, which have a finite capacity to accommodate users and reject further demand once their capacity is reached so that service becomes unavailable. For example, a flight cannot be booked if all seats have been reserved. A given transportation facility can sometimes be a delay system and sometimes a loss system. A bus is a delay system when it stops for passengers and waits for them to board and alight and a loss system at full occupancy. And an airport is a delay system if arriving aircraft have to queue prior to landing, and a loss system if aircraft get diverted to another airport.
Crowding is a third form of congestion that is commonly experienced on buses, subways and waiting platforms, in using luggage compartments on trains and aircraft, etc. Delay, unavailability of service, and crowding are problems not only in transportation but also in facilities associated with travel including hotels, restaurants, sports stadiums, recreational areas, and telecommunications. These facilities will however not be treated explicitly here.
3. Why Does Congestion Occur?
Transportation facilities are prone to congestion because of three characteristics of travel demand and supply: demand varies over time, supply is relatively fixed over long time periods, and output is not storable.
3.1 Temporal Variation In Demand
Travel demand has pronounced temporal fluctuations. Systematic daily and weekly variations are driven by work and school schedules, and by the operating hours of businesses, shopping, and entertainment establishments. Annual variations in travel are induced by the timing and length of school holidays and religious festivals, by sporting event schedules, and by the seasonal nature of outdoor recreational activities. Travel demand also fluctuates irregularly due to sporting meets, fairs, and other ‘special events.’
3.2 Rigidity Of Transportation Supply
Transportation supply consists of infrastructure and mobile plant. Infrastructure is generally long-lived and very costly and time-consuming to alter. Mobile plant comes in smaller and cheaper units than infrastructure, and has a shorter lifetime, but it still lasts much longer than the time scale of demand fluctuations. The scope to alter the supply of vehicle services is limited by the mobility of the plant itself (little or none for subways and trams) and by the degree to which differences between regions and traveler groups in the timing of peak demands can be exploited.
3.3 Output Is Not Storable
A traveler or freight shipment must be present to be transported. Thus, like other services such as haircuts and concerts, but unlike commodities such as grain and steel, production cannot be stored to smooth imbalances between supply and demand.
As a consequence of demand fluctuations, rigid supply and the impossibility of storage, the utilization rate of transportation facilities varies over time. Variations in utilization are magnified by intermittent reductions in capacity due to accidents, strikes, bad weather and so on. Because land is scarce and capacity is expensive, it would be prohibitively expensive to build enough capacity to prevent congestion at all times.
Congestion is exacerbated by two further considerations. First, travelers usually lack incentive to account for the congestion costs they impose on other users. Usage fees are not charged on most roads, and the costs of registration, licensing and insurance do not vary with distance traveled—let alone traffic volumes. Access fees are levied at facilities such as waterways and airports, but the fees are usually either fixed or vary at best crudely with usage. Thus, congestion is a negative externality because its adverse side effects are not priced in markets. Second, transportation supply tends to lag growth in population and travel. Many countries experienced substantial increases in vehicle use per kilometer of road from 1977 to 1987 (Small and Gomez-Ibanez 1999, Table 1). Air travel volume in passenger-kilometers grew at an average annual rate of 8.9 percent from 1960 to 1995 (ICAO 1999), spurred by airline deregulation in the US in the late 1970s and subsequently in Canada, Australia, New Zealand, and Europe. Airport planning authorities, meanwhile, failed to invest adequately in runway capacity and air traffic control, or to price usage of airports efficiently.
4. The Costs Of Congestion
Congestion imposes a range of costs on travelers: increased fuel consumption and vehicle wear and tear; extra travel time; the inconvenience of using an alternative travel mode or rescheduling, combining or canceling trips; disutility from crowding; and (in the longer run) the costs of relocating jobs and residences. Delays are also costly for freight shippers and unreliable deliveries can upset just-in-time manufacturing and increase the need for inventories.
Because delays in passenger travel are a dominant component of the total cost of congestion it is important to measure accurately the cost of travel time—known as the Value of Time (VOT). VOT depends on mode of travel, trip purpose, time of day, household time pressures, and other individual and trip-specific factors. As for as automobile commuting trips, Small (1992, p. 44) concludes from an extensive literature survey that: ‘… a reasonable average value of time for the journey to work is 50 percent of the gross wage rate, while recognizing that it varies among different industrialized cities from perhaps 20 to 100 percent of the gross wage rate, and among population subgroups by even more.’ Estimates of VOT for air travel are generally higher than for driving, in part because many air travelers are on business trips with tight schedules and in part because individuals with high VOT prefer to take fast modes of transport. There is limited evidence that VOT is higher for congested than uncongested travel (Calfee and Winston 1998).
Various estimates of the economy-wide costs of congestion have been compiled. For traffic congestion in the US Schrank and Lomax (1999) report a value of $72 billion for a set of 68 large urban areas in 1997. This figure includes time delay valued at $12 per hour (88 percent of the total) and extra fuel consumption. For Western Europe the European Commission in 1995 reported the costs of traffic congestion to be two percent of Gross Domestic Product (Prud’homme 1997)—more than double the equivalent US figure just mentioned. An extreme case is Bangkok, where congestion is alleged to consume 35 percent of gross annual output (Gibbs 1997). Aggregate statistics on the cost of air traffic congestion are patchy. In 1995, the US Federal Aviation Administration estimated that delays cost the industry approximately $2.5 billion per year in higher operating expenses. This excludes costs borne by passengers and freight shippers. In Europe a third of all flights are delayed by more than 15 minutes, at a cost to airlines and passengers of about $10 billion.
For several reasons aggregate statistics such as these should be interpreted with caution. First, they usually include only the more readily measured costs of congestion. Second, valuing time delay with a single number for VOT ignores differences across travelers as well as possible dependency on trip duration and the severity of the congestion encountered. Third, because eliminating congestion is not a practical option, measuring the total costs of congestion under actual travel conditions is not indicative of what might be gained from policies aimed at congestion relief (on this point see also Sect. 4).
These caveats notwithstanding it is instructive to compare the costs of congestion with the costs of other transportation externalities. Estimates from various countries reported in Greene et al. (1997) suggest that for road traffic, congestion costs are considerably smaller than accident costs, but at least as important as noise, air pollution and global warming costs. For air travel Levinson et al. (1998) estimate that noise is the largest cost, followed in order by congestion, air pollution, and accident costs. Thus, the costs of congestion appear to be appreciable both in absolute terms and relative to other externalities.
5. Modeling Congestion In Transportation Facilities
Transportation congestion modeling has been taken furthest for road traffic. Various approaches are described in Small (1992), Daganzo (1997), Hall (1999), and Lindsey and Verhoef (2000). Modeling the behavior of individual drivers is a daunting task not only because of their sheer number but also because drivers—being self-interested, fallible, and heterogeneous—do not behave like atoms according to universal and immutable physical laws. Computer simulation models have been developed that track the second-by-second motion of thousands of vehicles on complex traffic networks (Howard 1997). Useful insights into the economics of traffic congestion can nevertheless be obtained by using conventional supply–demand diagrams in which the dynamics of traffic are ignored and vehicles are treated as a homogeneous continuum.
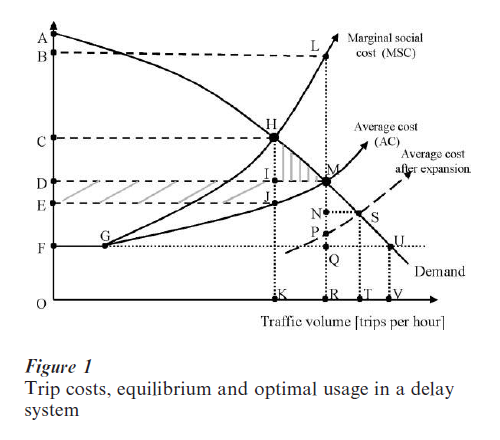
Consider Fig. 1, but ignore all its details for now—which will be covered later in Sects. 4 and 5. The Average Cost (AC) curve passing through points F, G, J and M depicts the cost borne by each driver to take a particular trip as a function of the traffic volume; i.e. the number of vehicles that make the trip per hour. Average cost includes vehicle operating cost plus travel time, which is assumed to be valued equally by all drivers. At low volumes vehicles are far enough apart that they can proceed under free-flow conditions, so that the trip cost curve is horizontal between F and G. At higher volumes drivers are forced to slow down to maintain a safe following distance. Travel time rises and AC slopes upwards. The shape of AC depends on road design, speed limits, vehicle size and handling characteristics, weather conditions, and driver reaction times and preferences for risk-taking. Due to changes in these factors over time, driving speeds have increased and following distances have decreased, thereby boosting effective road capacity and shifting the AC curve down.
The Marginal Social Cost (MSC) curve in Fig. 1, passing through F, G, H and L, is derived by adding to AC the cost of the congestion that each driver imposes on others. The MSC curve coincides with AC over the interval from F to G, and lies above AC elsewhere. To determine how many trips are taken, a demand curve can be added as shown by the downward-sloping curve passing through A, H, M, S and U. In the absence of traffic control or other means of regulation, equilibrium is established at point M where the marginal willingness to pay for a trip as measured by the demand curve matches the cost, AC. The unregulated equilibrium number of trips is OR. By contrast, the socially optimal number of trips, OK, is found at point H where the demand curve intersects MSC. Fewer trips per hour are taken than in the unregulated equilibrium, although travel is still congested because trip cost, JK, exceeds free-flow cost, OF. One way to support the optimum is to impose a toll equal to HJ: the difference between MSC and AC with traffic volume at OK. This is the basis behind congestion pricing, to be discussed in Sect. 5.2.
At the unregulated equilibrium the congestion cost imposed by each driver is LM. Various studies have estimated this quantity empirically. Some find it to be about equal to the average cost that drivers bear themselves: MR (Small and Gomez-Ibanez 1999 p. 1942). Other studies estimate LM to be several times as big as MR during peak periods in large cities. To get a figure for aggregate congestion costs it is tempting simply to multiply LM by the number of trips, OR, to get area LMDB. But this is inappropriate since the number of excessive trips taken in equilibrium relative to the social optimum is only KR. Similarly, it does not make sense to evaluate the congestion cost at the optimum, HJ, and multiply it by OK to get area HJEC. Yet as Prud’homme (1997) points out, some studies have identified either LMDB or HJEC as the total cost of congestion.
A more practically useful measure of congestion costs is the difference between the net social benefits of travel at the optimum (area AHJE) and at the unregulated equilibrium (area AMD). This difference can be decomposed into the reduction in costs on the OK trips that continue to be taken at the optimum (diagonally shaded area IJED) minus the loss of benefits on the KR trips that are no longer taken (vertically shaded area HMI). The difference in net social benefits can also be determined by computing the net social cost of the KR excessive trips taken in equilibrium. This quantity is equal to area HLM, which must therefore equal IJED–HMI.
Note that the cost of travel under free-flow conditions plays no role in the calculations. One could of course calculate the difference in cost between equilibrium and free-flow conditions, MQ, and multiply it by OR to get area MQFD. But this would be relevant only if it were somehow possible to maintain free-flow conditions at any traffic volume. Traffic volume would then increase from OR to OV, and a better measure of the gains would be the increase in net social benefits: area MUFD.
Supply–demand diagrams such as Fig. 1 are applicable not only to automobile traffic but also to other delay systems such as airport runways, bus service, waterways, and pedestrian walkways. In the case of loss systems the AC curve is approximately horizontal up to capacity flows and it is therefore optimal to use the facility to capacity while avoiding queuing or other wasteful forms of rationing access. In practice, demand cannot be predicted perfectly and a (probabilistic) tradeoff exists between unused capacity and congestion. Airlines deal with this tradeoff by using sophisticated yield management software that set fares according to the average fraction of seats that are occupied on a given flight.
Though useful, the simple supply–demand approach does abstract from various real-world features of transportation congestion. First, roads, airports and other facilities are components of transportation networks. Costs at one facility can depend on usage at other facilities because of conflicts between traffic flows, spillovers of queues and so on. Second, users differ in the congestion they create. Traffic engineers make allowance for differences between road vehicles in size, speed, and maneuverability by using passenger car equivalents that depend on grade and other road characteristics. Third, the static supply–demand approach ignores fluctuations in travel demand over time and does not address trip-timing decisions. Queuing theory is often useful for handling these aspects (Newell 1982).
6. Ways To Alleviate Congestion
Many policies have been adopted to relieve congestion. Some—such as land-use controls—have additional objectives, whereas policies such as road pricing are targeted at congestion. A comprehensive review of policies in urban transportation is found in Small and Gomez-Ibanez (1999, Sects. 2.2–2.5). Discussion will be limited here to three policy instruments: capacity investment, congestion pricing, and information technology.
6.1 Investment
The traditional approach to congestion relief is to expand capacity. Investment shifts the AC curve in Fig. 1 down, as shown by the dashed line passing through points P and vs. A new unregulated equilibrium is established at vs. Two benefits result: a reduction in travel costs for the OR pre-existing trips; and the benefit to travelers from the RT new trips. But because the new trips contribute to congestion, travel costs decline by only MN rather than by MP, and this partly undoes the cost savings to previous users. Generation of new trips is a manifestation of so-called latent (hidden) demand that was not apparent prior to the investment. Though the increase in usage can be appreciable if the demand curve is relatively flat, the effect of latent demand has frequently been overlooked in engineering and cost-benefit studies of investment. Even worse than latent demand, capacity expansion on one link of a transport network can induce shifts of demand to more congestion-prone routes or travel modes that actually raise overall travel costs (Arnott and Small 1994).
Unlike the unregulated equilibrium, investment always yields a positive gross benefit for the social optimum. The effects can be assessed by tracing the rightward shift of the MSC curve (not shown in Fig. 1). Depending on the strength of latent demand, the benefits may be greater or smaller than for the unregulated equilibrium. More generally, the benefits of investment, and hence optimal capacity too, depend on how traffic is regulated and priced.
6.2 Congestion Pricing
Economists have promoted congestion pricing since the 1950s. It makes use of the price mechanism, with all its advantages of decentralized decision-making. And, unlike other policies, congestion pricing restrains latent demand. The biggest potential gains from congestion pricing in transportation appear to be for road traffic and airport runways.
6.2.1 Road Pricing. Road pricing technology has come a long way since drivers were obliged to stop and pay cash at tollbooths. Thanks to advances in automatic vehicle identification and electronic toll collection, tolls can be levied anonymously using prepaid smartcards while vehicles maintain highway speeds. The biggest virtue of road pricing is that it can influence all dimensions of travelers’ choice. It is also consistent with the ‘user pay principal.’
The optimal toll in the static supply–demand framework of Fig. 1 is HJ. Imposition of this toll raises travel cost by HI relative to the no-toll unregulated equilibrium. That road pricing tends to make drivers worse off is one of the reasons for longstanding opposition to it. Another is that road pricing is often seen as ‘just another tax.’ There is growing recognition that to generate political support for road pricing, toll revenues must be used to benefit travelers without undoing incentives for them to curb their travel. Possibilities include improving public transit, reducing gasoline taxes, and investing in roads themselves. New self-financed private toll roads are showing promise as a market-oriented approach to alleviating congestion (Gomez-Ibanez and Meyer 1993).
The simple supply-demand approach of course abstracts from various real-world complications in the implementation of congestion pricing, including setting tolls on a network, varying tolls over time, charging for parking, and avoiding harm to lower-income drivers. These and other aspects are discussed in Button and Verhoef (1998) and McDonald et al. (1999).
6.2.2 Pricing Airport Runways. Traditional means of allocating runway space are a far cry from congestion pricing. Access to runways has been determined by scheduling committees that may be dominated by representatives of major airlines operating at the airport. And landing fees have been based on aircraft weight, which reflects congestion cost only crudely. Congestion pricing of runways would be administratively easier to implement than road pricing because takeoff and landings are recorded at airports anyway, and since the transactions costs for a flight are spread over many travelers.
The virtues of congestion pricing of runways were recognized in the late 1960s. Pricing encourages airlines to schedule flights off peak, to use lower-cost airports, and to deploy larger aircraft, which create less delay per passenger. The potential gains are large. Morrison and Winston (1989) estimate that optimal pricing at US airports would reduce delays by up to 50 percent, and yield nearly $4 billion in net benefits. An alternative to charging for every use of runways is to auction tradable take-off and landing slots. Slot trading was introduced in 1986 at Washington National, Chicago O’Hare, and New York’s La Guardia and Kennedy airports, and has worked well. Runway pricing and slot trading, as well as pricing of airport terminal services are described in Doganis (1992).
6.3 Information Technology
Development of Intelligent Transportation Systems (ITS) began in the 1970s, and expensive research programs are under way. One of the long-term goals of ITS is to assemble information about travel conditions and make it available to travelers at public places, by phone or Internet, or directly to vehicles equipped with on-board computers and Global Positioning Systems receivers. Computer simulations suggest that information can help drivers avoid hot spots of congestion by switching routes, changing departure times, and canceling trips. Travelers without access to information may also benefit from the adjustments made by informed travelers.
Despite these encouraging research findings, the potential of ITS is limited by the fact that they do not make drivers pay for the congestion they create. Indeed, provision of information can make congestion worse if it induces drivers to overreact; e.g. by switching en masse to Route 2 after learning about an accident on Route 1 (Ben-Akiva et al. 1991). And, similar to the effects of capacity expansion, congestion can be exacerbated if information induces people to travel more, or to concentrate their travel on congestion-prone routes and at peak times. These drawbacks can in principle be avoided by implementing road pricing in tandem with ITS.
6.4 General Policy Conclusions
From a theoretical perspective congestion pricing is the most effective means of controlling congestion because it influences all travel choices and also contains latent demand. But for various reasons—including the cost of pricing all links on travel networks, equity concerns and the need to maintain safety— nonprice constraints on travel such as air traffic control and regulations on the movement of heavy road vehicles will persist. The battle against traffic snarls, delays in the air, and congestion on other transport modes must continue to be waged on several fronts.
7. Looking Ahead
Despite the hazards of forecasting it is tempting to speculate about how congestion in transportation will evolve in the years to come. Consider first traffic congestion in the US, which is costly in an absolute sense and receives regular attention in the press. Aggregate congestion indexes suggest that congestion is getting worse in major urban areas. But average speeds and commuting times have remained fairly constant over the last 25 years. After growing for decades, auto ownership per capita is near saturation. And average commuter vehicle occupancy, which fell from 1.18 in 1970 to 1.09 in 1990, cannot fall much further (Schrank and Lomax 1999). These and other factors have led analysts such as Meyer (1999) to conclude that radical policies to affect sweeping changes in automobile travel patterns are not warranted.
Technological innovations such as air conditioning, car stereo systems, books on tape and cellular phones have made driving more pleasant and allow people to make productive use of time in the car. Similarly, laptops, cellular phones and executive lounges at airports make delays in air travel less onerous. And people can adapt to congestion by adjusting departure times, destinations, residential location and other choices. As a result, their tolerance for delay increases (Calfee and Winston 1998). Congestion costs are also held in check by the trend toward flexible work times, late night and weekend shopping, and extended hours of other services. And, most fundamentally, the costs of congestion are borne largely by travelers themselves. Congestion is a self-limiting phenomenon in the sense that the private cost of travel can never exceed the private benefit derived from it.
Travel is governed by resource constraints and other influences that vary greatly from region to region, and evolve over time. Two regularities in travel data have nevertheless been documented. One is that the amount of time spent traveling per person has remained relatively fixed at 1–1.5 hours per day. The second is that people spend a relatively constant fraction of their income on travel. These observations led to the constant travel time budget hypothesis and constant travel income budget hypothesis (for a summary see Schafer and Victor 1997). The two hypotheses are not logically inconsistent because as incomes rise people can switch to faster and more expensive modes of travel. To the extent that the hypotheses are valid they are useful for forecasting general trends in travel and congestion. Rising living standards will induce people to travel further each year. Faster economic growth in developing countries will mean faster expansion in travel there. Shifts toward faster modes of travel suggest that congestion in air travel will grow most quickly. Schafer and Victor (1997) forecast that by 2050 high-speed transport (air and high-speed rail) will account for about 50 percent of total distance traveled.
To what extent might new technology alleviate congestion by reducing travel demand? Attention has been focused on teleconferencing, teleshopping, FAX, electronic mail, the Internet and other telecommunications technology. Spread of computers into homes has made telecommuting perhaps the most promising application. Nevertheless, it has some limitations (Mokhtarian 1997). People may value the journey to work as a buffer between their home and work roles, desire interaction at the workplace, or fear being overlooked for promotion if they stay at home. The option of telecommuting may encourage people to live in more remote locations, so that when they do commute they have further to go. Part of the time freed up from commuting may be used to make other trips, as the constant travel time budget hypothesis predicts. And any reductions in travel by telecommuters may be partially offset by latent demand from the rest of the population. Still, by reducing peakperiod travel, telecommuting may alleviate congestion and permit savings in expenditure on infrastructure. And even if the increased use of telecommunications as a whole does not reduce travel, it may yield benefits in increased work productivity and greater personal flexibility. Perhaps the safest prediction is that congestion and efforts to alleviate it will persist for the foreseeable future.
Bibliography:
- Arnott R, Small K A 1994 The economics of traffic congestion. American Scientist 82 September–October: 446–55
- Ben-Akiva M, de Palma A, Kaysi I 1991 Dynamic network models and driver information systems. Transportation Research 25A(5): 251–66
- Button K J, Verhoef E T (eds.) 1998 Road Pricing, Traffic Congestion and the Environment: Issues of Efficiency and Social Feasibility. Edward Elgar, Cheltenham, UK
- Calfee J, Winston C 1998 The value of automobile travel time: Implications for congestion policy. Journal of Public Economics 69: 83–102
- Daganzo C F 1997 Fundamentals of Transportation and Traffic Operations. Pergamon, New York
- Doganis R 1992 The Airport Business. Routledge, London and New York
- Gibbs W W 1997 Transportation’s perennial problems. Scientific American 277(4): 54–7
- Gomez-Ibanez J A, Meyer J R 1993 Going Private: The International Experience with Transport Privatization. The Brookings Institution, Washington, C
- Greene D L, Jones D W, Delucchi M A (eds.) 1997 The Full Costs and Benefits of Transportation. Springer-Verlag, Berlin
- Hall W R (ed.) 1999 Handbook of Transportation Science. International Series in Operations Research and Management. Kluwer Academic Publishers, Boston, MA
- Howard K R 1997 Unjamming traffic with computers. Scientific American 277(4): 86–8
- International Civil Aviation Organization 1999 Outlook for air transport to the year 2005, Circular 270-AT 111. www. icao.org
- Levinson D M, Gillen D, Kanafani A 1998 The social costs of intercity transportation: a review and comparison of air and highway. Transport Reviews 18(3): 215–40
- Lindsey R, Verhoef E T 2000 Congestion modelling. In: Hensher D A, Button K J (eds.) Handbook of Transport Modelling. Elsevier Science, Oxford, UK, Vol. 1
- McDonald J F, d’Ouville E L, Liu L N 1999 Economics of Urban Highway Congestion and Pricing. Kluwer Academic Publishers, Boston, MA
- Meyer M D 1999 Demand management as an element of transportation policy: using carrots and sticks to influence travel behavior. Transportation Research 33: 575–99
- Mokhtarian P L 1997 Now that travel can be virtual, will congestion virtually disappear? Scientific American 277(4): 93
- Morrison S A, Winston C 1989 Enhancing the performance of the deregulated air transportation system. Brookings Papers on Economic Activity, Microeconomics : 61–123
- Newell G F 1982 Applications of Queuing Theory. Chapman and Hall, London
- Prud’homme R 1997 On transport-related externalities. Jornadas de Finanzas Publicas 30: 139–56
- Schafer A, Victor D 1997 The past and future of global mobility. Scientific American 277(4): 58–61
- Schrank D, Lomax T 1999 The 1999 Annual Mobility Report Information For Urban America, Texas Transportation Institute, Texas A&M University System, College Station, TX http: mobility.tamu.edu
- Small K A 1992 Urban transportation economics. In: Lesourne J, Sonnenschein H (eds.) Fundamentals of Pure and Applied Economics. Harwood Academic Publishers, Chur, Switzerland
- Small K A, Gomez-Ibanez J A 1999 Urban transportation. In: Cheshire P, Mills E S (eds.) Handbook of Regional and Urban Economics 3. North-Holland, Amsterdam, pp. 1937–99
- Walters A A 1987 Transportation. In: Eatwell J, Milgate M, Newman P (eds.) The New Palgrave: A Dictionary of Economics. Macmillan, New York, Vol. 4, pp. 695–701
ORDER HIGH QUALITY CUSTOM PAPER

Always on-time

Plagiarism-Free

100% Confidentiality