
View sample Test Bias Research Paper. Browse other research paper examples and check the list of research paper topics for more inspiration. If you need a religion research paper written according to all the academic standards, you can always turn to our experienced writers for help. This is how your paper can get an A! Feel free to contact our custom writing service for professional assistance. We offer high-quality assignments for reasonable rates.
Of all of the issues in modern testing and assessment, none generates more controversy and heated debate than the issue of ‘bias’ in testing. Tests are important instruments of public policy. They figure centrally in determining a child’s readiness for schooling, in placing children into classes for the educable mentally retarded and into classes for the academically gifted. They have been used for years in European countries and in Japan to determine the class of occupations that students will enter as adults. Tests have become important in the United States in determining who will graduate from high school. For almost a century, professionally developed measures of scholastic aptitude have played an important role in determining who will be admitted to what colleges and who will be employed in what jobs. In the past half-century, tests have played an increasingly determinative role in certifying individuals to practice their chosen profession.
Academic Writing, Editing, Proofreading, And Problem Solving Services
Get 10% OFF with 24START discount code
All of the above are serious test uses involving ‘high stakes’ decisions for individuals. Small wonder that when social, cultural, or ethnic minorities are assigned pejorative classifications or denied life opportunities on the basis of tests, the charge of unfairness and discrimination arises.
Although test bias is discussed generally in the context of bias against cultural and ethnic minorities in a given society, the concept (as well as the methodologies used to investigate it) is quite generic. Following conventional usage, in this research paper the group against whom a test is suspected of being biased will be referred to as the ‘focal group.’ The group with which test results of the focal group are compared will be called the ‘reference group.’ Thus, if a test is suspected of being biased against female examinees, they become the focal group, and males become the reference group. If the test is suspected of being biased against an ethnic minority (e.g., African-Americans), they become the focal group, and European-Americans become the reference group.
1. What Test Bias Is Not
It is sometimes useful and instructive, although somewhat inefficient, to begin the examination of a concept by describing what it is not. On a test of upper body strength, a random sample of men will almost surely have mean scores that are higher than a random sample of women. It would be foolish to label such a test ‘biased against women.’ In fact, such a difference in performance between the sexes so accords with what we know to be true, that were no such performance difference observed, we would hold the test suspect. A less obvious though equally apt example is the persistent finding in many societies of differences among cultural and ethnic groups on measures of cognitive functioning, scholastic ability, and academic achievement. The existence of such differences, some of which are substantial, is interpreted by many to indicate bias in the measures themselves.
To appreciate the fallacy of such an inference, one need only consider a random sample of, say, African-American and White students in the city of Chicago. When measures of academic achievement are administered to these two groups, the typical finding is that White students as a group score significantly above their African-American counterparts. Again, to conclude that the test itself is therefore biased against African-American students would be erroneous. One would have to systematically rule out a plethora of rival causes of mean score differences (and there are many) before it could be safely concluded that the test itself was in some way deficient.
2. Internal Sources Of Test Bias
There are many definitions of ‘test bias’ (cf., Flaugher 1978, Jensen 1980) and in the limited space available we will be able to discuss in some depth only the major sources of concern. We do not cover the extensive literature on possible sources of test bias emanating from individually administered tests of intelligence, such as administrator examinee differences in race or dialect, nor such factors as differences in motivation and test anxiety. We will restrict treatment here to sources of test bias that are traceable to aspects of the measuring instrument itself and to sources of bias resulting from the use of tests in selection and prediction.
2.1 Bias As Unintended Multidimensionality
Most paper and pencil, multiple-choice tests are intended to measure a more or less unidimensional construct. To be sure, this intention is rarely ever met. Few tests actually measure a single ability. Even a test of simple addition involves multiple abilities at some atomistic level. What is meant my ‘unidimensional’ is that only one ability contributes to score variance.
‘Reading comprehension,’ for example, entails a certain minimum vocabulary and the ability to decode words. But in most applications these abilities do not contribute significantly to score variance because the vast majority of examinees are sufficiently adept at lower-level skills that such differences as exist do not contribute to test score variance.
A familiar and common example of bias as multidimensionality, also known as construct bias, is a test of quantitative reasoning that contains word problems. For examinees whose first language is not the language in which the test is written, the test may well reflect differences in familiarity with the language of the test, rather than the intended construct, quantitative reasoning. Bond (1981) provides a vivid example of bias as unintended multidimensionality in the verbal domain. Imagine a teacher who wished to assess the verbal analogical reasoning of her class of 14and 15year-olds. She constructs an analogies test that contains an unusually large number of terms familiar to rural students, say, but relatively unfamiliar to urban students. A typical item on the test might be:
Because students raised on a farm are more likely to know the meanings of the words in a given analogy, they would be at a tremendous advantage over urban students on such a test. The typical urban student is penalized because of his or her unfamiliarity with the very words that make up the analogy. For these students, the test is as much a test of vocabulary as it is one of analogical reasoning. For rural students, the test is a ‘purer’ measure of analogical reasoning, uncontaminated by large differences in exposure to the words composing the analogies.
Bond noted that as a practical measurement matter, it is impossible to separate ‘vocabulary’ from ‘verbal analogical reasoning.’ Conceptually, however, the two constructs are different. Although there is no way to avoid this problem in constructing a test, there are ways to control statistically for such differences. The procedure involves giving a separate test of vocabulary, then comparing only those students on the analogies test who have the same vocabulary scores.
An often overlooked source of unintended multidimensionality arises from response processes that a test is intended to assess and those that are actually employed by examinees. For example, if a test is intended to assess mathematical reasoning, it is important to ascertain whether examinees are, in fact, reasoning about the material instead of following a standard, taught algorithm. Different groups may well be differentially exposed to solution routines, or they may systematically employ different strategies of unequal effectiveness. Laboratory studies of the response process by subgroups of the population can assist in determining the extent to which capacities irrelevant or ancillary to the construct may be differentially affecting performance.
Before turning to other conceptions of test bias, brief mention must be made of the continuing debate over the relationship between bias and what has come to be called the ‘IQ controversy.’ Many people believe that if tests of ‘intelligence’ are shown to be free of construct bias (i.e., they measure the same construct(s) in different groups), then there is strong evidence for the notion that mean differences on such tests have a substantial genetic component. This is an unfortunate and misguided notion. The demonstration that a test is measuring essentially the same or similar attributes in two groups has no a priori implication for the source of any group differences that emerge. The many possible reasons for such differences (including differences in exposure, opportunity to learn, motivation, and so on) must be investigated as a separate matter.
2.2 Bias As Differentially Functioning Items
Not all items on a test are of equal overall quality, reliability, and validity. As noted earlier, the wording of some items may systematically confuse examinees who do not speak, as their first language, the language in which the test is written. In multiple-choice tests, clues as to the correct choice may be inadvertently introduced, so that some items may put certain examinees at a relative advantage over others. In achievement tests, some examinees may have received specific instruction on a particular procedure, while others received no such instruction. Such items are said to exhibit differential item functioning, or DIF, a neutral term that the measurement profession now prefers over the more value-laden term, ‘item bias.’ (The astute reader will note that one source of DIF is unintended multidimensionality on a smaller scale.)
The methodological and statistical machinery to identify items that function differentially for different groups has reached a state of considerable sophistication over the past 20 years (see Holland and Wainer 1993). In this research paper, three of the more common approaches (chi-square, Mantel–Haenszel, and item response theory) will be described. Of historical interest, since it was the first attempt to formalize a procedure for identifying biased test items, is the method based on relative item difficulty known as the delta method of Angoff and Ford (1974). The logic underlying the method is that even if groups differ in their overall mean on a test, the rank order of item difficulties within the focal and reference group should be approximately the same. The method involves an inverse normal transformation of item difficulties within the two groups of interest. (The transformation is an inverse one because of the unfortunate historical practice of defining item difficulty, p, as the proportion of examinees who respond correctly to the item, rendering it an item ‘easiness’ index!). Specifically, the delta (∆) for the ith group for the jth item is ∆ij – 4πij + 13, where πij is the z score that cuts off pij in the unit normal distribution. The arbitrary constants, 4 and 13, are used to place the deltas on the difficulty scale of the Educational Testing Service, with a mean of 13 and a standard deviation of 4. The two sets of delta values can be plotted against each other and the swarm of points so formed should cluster tightly around a 45 line that passes through the origin. Biased items are indicated by points that are beyond some prespecified distance from the line.
A major shortcoming of the delta-plot method is that excellent items (in the sense of validly discriminating between high and low scorers on the test) will erroneously appear to be biased when the reference and focal groups differ on the trait being measured. A second problem with the Angoff and Ford approach to DIF is that it leaves unanswered the central question in any evaluation of differential item functioning: do individuals of equal proficiency, ability, or knowledge on the construct being measured (regardless of their group membership) have the same probability of answering the item correctly?
Two general methods for investigating the above question (one based on classical test theory principles, the other on item response theory) have evolved. The former uses the total score on the test itself to match members from each group on ability. The summed chi-square methods (Scheuneman 1979, Camilli 1979) first divide the distribution of raw scores into J ability levels. A 2 × 2 frequency table of right wrong responses is formed for each item with the groups constituting the rows of the table, say, and the item response (1, 0) constituting the columns. These are then combined in a 2 × 2 × J contingency table across the J ability levels. The test statistic used to determine the existence of item bias is the familiar chi-square test of association. Scheunamen’s χ2correct statistic takes into account only the correct responses. The more appropriate Camilli full information χ2full statistic considers both correct and incorrect responses.
By far the most popular method for investigating DIF using classical test theory principles is the measure of association developed by Mantel and Haenszel (1959) and adapted for DIF research by Holland and Thayer (1988). Like the chi-square methods, the Mantel–Haenszel (M–H) procedure divides the score scale into J levels. The procedure uses the odds of getting an item correct, p/q (where q = 1 – p), by members of each group. The ratio of these odds, αj, is combined across levels and weighted by cell frequency. For computational and interpretive convenience, the natural log of the odds-ratio, rather than the odds ratio itself, is used. The M–H log odds-ratio, βj, is a signed index, with positive values signifying DIF in favor of the reference group, and negative values indicating DIF in favor of the focal group. A chi-square test for the M–H index may also be calculated.
Differential item functioning has also been investigated extensively using item response theory (IRT), a powerful and elegant test model that attempts to model, in probabilistic terms, responses of examinees to individual items. Each item on a test can be represented by an item characteristic curve (ICC), an S-shaped item response curve, based upon the logistic function, that specifies the probability that persons of a given ability, θ, will answer the item correctly. The ICCs for each item may be estimated separately for each group. In IRT, ability matching is achieved as a by-product of the rather complex estimation procedures themselves. Once examinees are placed on the same θ scale, if no DIF is present, the two ICCs should overlap within measurement error.
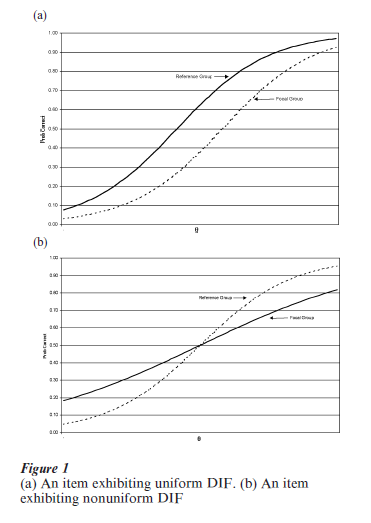
Figure 1 depicts two examples of differential item functioning using item response theory. In both cases, the ICCs are for the same item estimated separately for the two groups. In the first example, the item is biased against the focal group because, for fixed θ, members of that group have a substantially lower probability of getting the item right than members of the reference group. The second example depicts a relatively rare but real occurrence, ‘nonuniform’ DIF: the item is biased against high scoring members of the focal group, but biased in favor of low scoring focal group members. The opposite pattern occurs for reference group members. It should be noted that classically-based procedures cannot distinguish between these two forms of DIF.
3. Bias In Selection And Prediction
When a test is used to predict some future criterion such as success in school or performance on the job, the test may not do so equally well for different groups. For example, when the regression line for male candidates or the regression line from combined male and female candidates is used to predict the college performance of female students, the predictions tends to be systematically too low. That is, female students tend to perform better in college than would be expected from their SAT scores. To the extent that an institution’s admission policy adopts a ‘top-down’ strategy, the test would be systematically biased against women.
3.1 The Classical Or Regression Model
The definition of selection or prediction bias that has attained some measure of agreement among measurement specialists is that due to Cleary (1968). Known as the ‘classical’ or ‘regression’ model of selection bias, the model states that ‘a test is biased for members of a subgroup of the population if, in the prediction of a criterion for which the test is designed, consistent nonzero errors of prediction are made for members of the subgroup’ (p. 115). In this definition, if a given test score is associated with the same level of future criterion performance, regardless of group membership, then the test is ‘fair’ or unbiased, and to the extent that selection is based solely on predicted performance, the selection system is fair. Statistically, selection bias is indicated when, in the regression of criterion performance on test scores, either the regression lines or intercepts differ for focal and reference groups. When the regression lines coincide, or more precisely, when the regression lines do not differ to a statistically significant degree, the test is said to be unbiased.
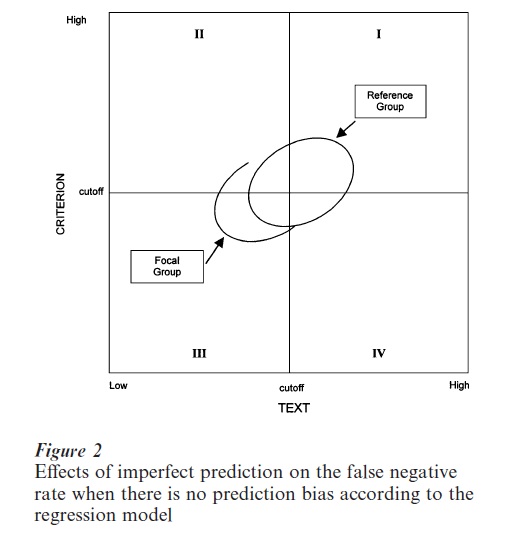
Thorndike (1971) was the first to point out an unfortunate difficulty with the regression model. In passing, we note that his reasoning figured prominently in the US National Academy of Science report on fairness in employment testing (Hartigan and Wigdor 1989). The situation is illustrated graphically in Fig. 2. In the figure, we make the usual assumption that there is a ‘cutoff’ score on the test (defining selection) and a cutoff score on the criterion (defining ‘success’ and ‘failure’). The quadrants of the resulting 2 × 2 table comprise four distinct groups of individuals. Those who are: True Positives: selected and successful (quadrant I); False Negatives: rejected but would have succeeded had they been accepted (quadrant II); True Negatives: rejected and would have ‘failed’ had they been accepted (quadrant III); False Positives: selected and unsuccessful (quadrant IV).
The regression lines for the focal and reference groups coincide, so that the test is fair according to the regression model. The difficulty with the model arises from two sources. First, the two groups differ in mean scores on the test (a typical finding). Second, the test is never perfectly reliable and is always imperfectly correlated with the criterion. These two conditions together result in the percentage of focal group members who were improperly rejected (quadrant II) being substantially larger than the comparable percentage of reference group members. Hartigan and Wigdor (1989) state the case succinctly, ‘The undoubted effect of imperfect prediction when social groups have different average test scores is to place the greater burden of prediction error on the shoulders of the lower-scoring group’ (p. 258).
Before turning to alternative selection models, it should be noted that the apparent unfairness of the regression model, when its conditions for fairness have been satisfied, result not necessarily from any inherent deficiency in the test itself. Nor are these effects inextricably bound up with race, ethnicity, social class, sex, or some other defining feature of the groups. Rather, the ‘unfairness’ results solely as a statistical result of the two groups having different means on the test. The effects would be as clearly in evidence within the focal or reference group were its members divided into high and low scoring subgroups.
3.2 Alternative Models Of Fair Selection
Alternatives to the classical model have been proposed by Cole (1973), Darlington (1971), Einhorn and Bass (1971), Gross and Su (1975), Jensen (1980), Linn (1973), and Thorndike (1971), among others. In a seminal and influential paper, Petersen and Novick (1976) analyzed and evaluated the models of Cleary, Cole, Einhorn and Bass, Gross and Su, Linn, and Thorndike in terms of the degree to which they were ‘internally consistent.’ Their analyses of the models will be briefly described here, but a thorough review of all of the models cannot be undertaken in the limited space available. The reader is advised to consult the original sources as well as other in-depth discussions found in Jensen (1980) and the special issue of the Journal of Educational Measurement (1976) edited by R. M. Jaeger.
Thorndike drew a distinction between fairness to individuals, which the regression model assures, and fairness to groups. According to Thorndike,
The qualifying scores on a test should be set at levels that will qualify applicants in the two groups in proportion to the fraction of the two groups reaching a specified level of criterion performance (1971, p. 63).
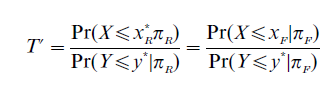
Fairness to the group consists of selecting equitable proportions of members from each group. Different cut scores, xi, are possible, in fact likely, for the two groups. Assuming a minimum level of acceptable performance on the criterion, y, a selection test is considered fair according to the Thorndike model if the cut-score x* for the two groups is such that
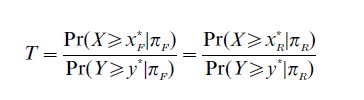
where T is a constant for the reference population (πR) and the focal population (πF) and x* and y* are cut scores for the test and criterion, respectively. Following Peterson and Novick, this model has come to be called the Constant Ratio Model.
Cole (1973) proposed a model of fair selection, the Conditional Probability Model, that assures to any individual, regardless of group membership, an equal chance of being selected, provided that he or she would have been successful if selected. That is, for anyone who can achieve a satisfactory criterion score (Y ≥ y*), there should be the same probability of selection regardless of group membership. The Cole model specifies that a test is fair when cut scores are set for the two groups such that
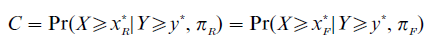
where C is a fixed constant for both populations.
It is noted that in most situations where the focal group mean on the selection test is below that of the reference group, both the Thorndike and Cole models will result in a greater proportion of focal group members being selected than would be the case with the regression model. The downside from the selecting institution’s point of view is a less than optimal mean overall performance of those selected.
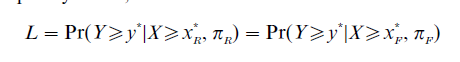
In the usual selection situation, the ‘given’ information for each applicant is not his or her future state of being (success or failure) in relation to the criterion variable, but rather his or her present observed standing on the selection test. That is, a fair selection test, it can be argued, should be based upon the conditional probability of success, given selection. Such a model has been suggested, though not necessarily advocated, by Linn (1973). The model essentially reverses the Cole model above. For a test to be fair, cut scores for the two groups are set so that the following equality holds, where the notation is as before:
Associated with each of these ostensibly fair and plausible alternatives to the regression model is a different index which must be constant across groups. Yet, in general, they all result in different cut scores and different proportions of individuals from the focal and the reference groups being selected.
In an influential paper, Petersen and Novick analyzed the competing and contradictory models by applying a test of ‘internal coherence.’ Briefly, the three models above focus attention on those who would be successful. Fairness is discussed in relation to these individuals only. But the same logic, the same perspective on fairness and bias, can be applied to individuals who were not selected and who would have been unsuccessful if selected. It turns out that when questions are phrased with these individuals in mind, the above models contain a logical contradiction. For example, the Thorndike model can be restated as follows: the qualifying scores on a test should be set at levels that will reject applicants in the two groups in proportion to the fraction of the two groups who fail to reach a specified level of criterion performance. The reformulated, converse model then becomes:
The models proposed by Cole and Linn may be similarly reformulated. Petersen and Novick prove that only in rare and unlikely circumstances will the three converse models result in the same cut scores as the original models. Different individuals will be selected depending on whether one formulates fairness with selected, successful individuals in mind, or whether one focuses on rejected, unsuccessful individuals. The three models are internally incoherent.
By contrast, the regression model and a model proposed by Einhorn and Bass (1971) are internally coherent. The Einhorn and Bass model sets the cut score for each group in such a way that the criterion score for persons with test scores greater than the cut score will be above the minimum acceptable criterion with probability at least equal to some specified value. It is then required that this probability (or conversely, risk) be the same for all groups of interest, hence its designation as the Equal Risk Model.
4. Conducting Remarks
Measurement specialists can contribute importantly to discussions about the technical adequacy of tests and the importance of adopting models that meet specific requirements. Of course, matters of test use in education and employment will not be decided by measurement specialists and statisticians. Matters of test use and testing policy will ultimately be decided in the public, legislative, and judicial arenas. It is nevertheless hoped that technical analyses of differential item functioning, of the various sources of internal test bias, and of the consequences of adopting a particular selection model will inform the public, legislative, and judicial debates.
Bibliography:
- Angoff W H, Ford S F 1977 Item-race interaction on a test of scholastic aptitude. Journal of Educational Measurement 10: 95–106
- Bond L 1981 Bias in mental tests. In: Green B F (ed.) New Directions for Testing and Measurement: Issues in Testing– Coaching, Disclosure, and Ethnic Bias, No. 11. Jossey-Bass. San Francisco
- Cleary T A 1968 Test bias: Prediction of grades for negro and white students in integrated colleges. Journal of Educational Measurement 5: 115–24
- Camilli G 1979 A Critique of the Chi-square Method for Detecting Item Bias. Unpublished manuscript. University of Colorado, Laboratory of Educational Research
- Cole N S 1973 Bias in selection. Journal of Educational Measurement 10: 237–55
- Darlington R B 1971 Another look at ‘cultural fairness. ’Journal of Educational Measurement 8: 71–82
- Einhorn H J, Bass A R 1971 Methodological considerations relevant to discrimination in employment testing. Psychological Bulletin 75: 261–9
- Fraugher R L 1978 The many definitions of test bias. American Psychologist 33(7): 671
- Gross A L, Su W 1975 Defining a ‘fair’ or ‘unbiased’ selection model: A question of utilities. Journal of Applied Psychology. 60: 345–51
- Hartigan J A, Wigdor A K 1989 Fairness in Employment Test: Validity, Generalization, Minority Issues, and General Aptitude Test Battery. National Academy Press, Washington, DC
- Holland P, Thayer D T 1988 Differential item functioning and the Mantel–Haenszel procedure. In: Wainer H, Braun H (eds.) Test Validity. Lawrence Erlbaum Associates, Hillsdale, NJ
- Holland P, Wainer H 1993 Differential Item Functioning. Lawrence Erlbaum Associates, Hillsdale, NJ
- Jensen A R 1980 Bias in Mental Testing. Free Press, New York
- Linn R L 1973 Fair test use in selection. Review of Educational Research 43: 139–61
- Mantel N, Haenszel W 1959 Statistical aspects of the analysis of data from retrospective studies of disease. Journal of the National Cancer Institute 22: 719–48
- Petersen N C 1976 An expected utility model for ‘optimal’ selection. Journal of Educational Statistics 1: 333–50
- Petersen N C, Novick M R 1976 Towards equalizing educational and employment opportunity selection. Journal of Educational Measurement 13: 77–88
- Scheuneman J D 1979 A method for assessing bias in test items. Journal of Educational Measurement 16: 142–3
- Thorndike R L 1971 Concepts of culture-fairness. Journal of Educational Measurement 8: 63–70
ORDER HIGH QUALITY CUSTOM PAPER

Always on-time

Plagiarism-Free

100% Confidentiality