
View sample Subjective Probability Judgments Research Paper. Browse other research paper examples and check the list of research paper topics for more inspiration. If you need a religion research paper written according to all the academic standards, you can always turn to our experienced writers for help. This is how your paper can get an A! Feel free to contact our custom writing service for professional assistance. We offer high-quality assignments for reasonable rates.
1. Introduction
Life is rife with uncertainty. Do our enemies have biological weapons? Will it rain next Sunday? How much oil can be found by drilling in this spot? Important decisions in areas as diverse as medicine, business, law, public policy, and one’s private life, must be made under uncertainty, hence hinge on odds and probabilities. ‘Probability,’ in the famous words of Bishop Butler (1736), indeed ‘is the very guide to life.’ Yet the theories of mathematical probability or of statistical inference cannot deliver the probabilities sought. So we have to make do with subjective probabilities—the probabilities that people generate in their own minds to express their uncertainty about the possibility of the occurrence of various events or outcomes. How do people generate these subjective probabilities? Since the 1970s, this question has attracted much research attention from cognitive psychologists. The present article will review this research.
Academic Writing, Editing, Proofreading, And Problem Solving Services
Get 10% OFF with 24START discount code
Although statistics and probability theory can seldom replace intuitive judgments, a favored paradigm in the study of subjective probabilities has been to use the norms and dictates these theories provide as yardsticks against which people’s intuitions can be compared, thereby illuminating the cognitive heuristics people use, and the biases to which they are subject. Appropriately, the dominant school in this line of research is called the heuristics and biases approach (Tversky and Kahneman 1974, Kahneman et al. 1982). At its core are two heuristics for judging probabilities—the representativeness heuristic, and the availability heuristic.
2. Representativeness
This is a heuristic for judging the probability that a certain target case, presented by some individuating information, belongs to a certain category (or comes from a certain source, or possesses a certain feature). This is a common type of probability judgment: a doctor judges the probability that a particular patient has pneumonia, a juror judges the probability that a particular defendant committed murder, or an employer judges the probability that a particular job candidate would be a good employee. Its essence is to base the probability judgment on the extent to which the target case’s relevant particulars (e.g., the patient’s symptoms, the defendant’s motives, or the job candidate’s background) match, resemble, or represent the attributes which the judge considers typical of, or central to, the category (Kahneman and Tversky 1972).
Similarity judgments, however, obey different rules than probability. For example, a person could well be more like a typical New Yorker than like a typical American—but a person can never be more likely to be a New Yorker than an American. This difference between resemblance and probability can bias judgments of the latter when they are based on the former. Consider, for instance, the following example.
Example 1: After graduating from college, Sarah took a trip around the world, writing frequent letters home. One contained the following description: ‘It is so clean here, you could eat off the streets. Snow- capped mountains frame picturesque log cabins, with geraniums in every window.’ Where do you think this letter was written?
Respondents given this question sensibly thought it was more likely that the letter was written from Switzerland than from Brazil. But they also thought it was more likely that the letter was written from Switzerland than from … Europe! When asked to select the most likely of several possibilities (which included Switzerland, Brazil, and Europe, among others), they ranked Switzerland—not Europe—first (Bar-Hillel and Neter 1993).
Probability theory does not provide an answer to the question: ‘What is the probability that this letter was written from Switzerland?’ But once this probability is assessed, it sets constraints on certain other probabilities. Thus, whatever the probability that the letter was written from Switzerland, it cannot possibly be higher than the probability that it was written from Europe. This is the extension principle, and people realize its validity. Those that rely on it when performing the experimental task do not rank Switzerland before Europe. Most, however, just compare the description in the letter with their idea of the places under consideration. The match between the description and Switzerland is the best—better even than the match between it and Europe. So, in accordance with the representativeness heuristic, Switzerland is ranked most likely.
Results such as this point out both what people often do (namely, base probability judgments on judgments of representativeness), and what they often fail to do (namely, rely on formal rules of probability). One factor, which plays an important role in formal probability calculations but is relatively neglected in subjective probability reasoning, is size—either category size, or sample size. This is shown in the following example.
Example 2: A certain town is served by two cab companies, the Blue Cab and the Green Cab, named after the color of cab they operate. The Blue Cab Company has many more cabs than the Green Cab Company. One dark and foggy night, a pedestrian was knocked down by a hit-and-run cab. She later testified that it was green. Her accuracy rate in distinguishing green from blue cabs under the conditions that existed that night was found to about 85 percent. What is the probability that the errant cab was a Green Cab?
This problem, and many variants thereof, has been studied in scores of studies (e.g., Tversky and Kahneman 1982a, Bar-Hillel 1980, 1983). Formatted like a high school math problem, it invites explicit numerical calculation. The modal response is to assign the witness’ testimony a probability that matches her accuracy, 85 percent. The same happens when the witness is said to have identified the cab as belonging to the larger company, Blue Cab. Indeed, the relevance of the relative size of the cab companies to the question eludes most people. After all, they argue, the pedestrian was run over by a single cab, not by the entire fleet. Nonetheless, when the witness is unable to identify the color at all, most people properly realize that the errant cab is probably from the larger company, simply because it is the larger company. Normatively, the witness’ testimony should be integrated with this base-rate consideration, rather than replacing it.
The inclination to neglect category size is known as the base-rate fallacy. Since Example 2. does not involve judgment by representativeness, it shows that baserate neglect is not merely a side effect of this heuristic, as it was in Example 1. Example 3. shows that size considerations are neglected not only when considering the source population, but also when considering the sample.
Example 3.: A game of squash can be played either to 9 or to 15 points. If you think you are a better player than your opponent, which game gives you a higher chance of winning, the short game, or the longer game? Suppose, instead, that you are the weaker player, which game gives you a higher chance now?
If you are inclined to favor the same length in either case, consider this theorem from probability theory: The larger the sample of rounds (i.e., 15 rather than 9), the likelier it is to yield the expected outcome, namely victory to the stronger player. So if you believe you are the stronger player, you should prefer the longer game, but if you believe you are weaker, your chances are better with a shorter game. Intuitively, though, winning a game seems equally representative of player strength whether it is a shorter or longer game (Kahneman and Tversky 1982b).
This is not to deny that people can—spontaneously or by mild prompting—appreciate that larger samples are better for estimating population parameters than smaller samples. But they erroneously think that the advantage lies in being relatively larger (in terms of the ratio of sample size to population size) rather than absolutely larger. Many, for example, indicate equal confidence in the accuracy of a survey of 1 in every 1,000 people in predicting election outcomes in a city of a million voters as in a survey of 1 in every 1,000 people in a town of 50,000—even though the former survey samples 20 times as many people (Bar-Hillel 1979).
Example 4., which follows, demonstrates another judgmental bias, which is related to size neglect and is known as failure to regress.
Example 4.: When Julie was 4, she was rather tall for her age—in the 80th percentile (i.e., taller than about 80 percent of her peers). She is now 10 years old. What would you guess is her present height percentile?
If you think that Julie may have moved up, or she may have moved down, but she probably is still taller than most of her peers, you are quite right. However, if you also think that Julie is as likely to be in a higher percentile as in a lower percentile, and that by and large she is probably still most likely to be approximately in the 80th percentile, then you are sharing a common, but erroneous, disregard for the phenomenon known as regression to the mean. This is the fact that the mean of a second sample from a population can always be expected to be closer to the population mean than was the first sample’s (unless the first sample’s mean happens to have coincided with the population mean to begin with). In the present example, this follows from the fact that a larger proportion of the population of children were shorter than Julie (80 percent) than were taller than her (20 percent).
Failure to recognize regression to the mean can result in inventing causal explanations for what may be mere statistical artifacts (Kahneman and Tversky 1973), such as for the observation that very bright women tend to have somewhat less bright husbands. The following example demonstrates some difficulties that people have with the concept of random-ness.
Example 5: Consider the two 12 × 12 matrices in Fig. 1. Each consists of 50 percent black cells and 50 percent white cells. In one, the colors are mixed in a manner typical of truly random mixing. In the other, the cells are not mixed randomly at all. Which do you think is the ‘random’ matrix?
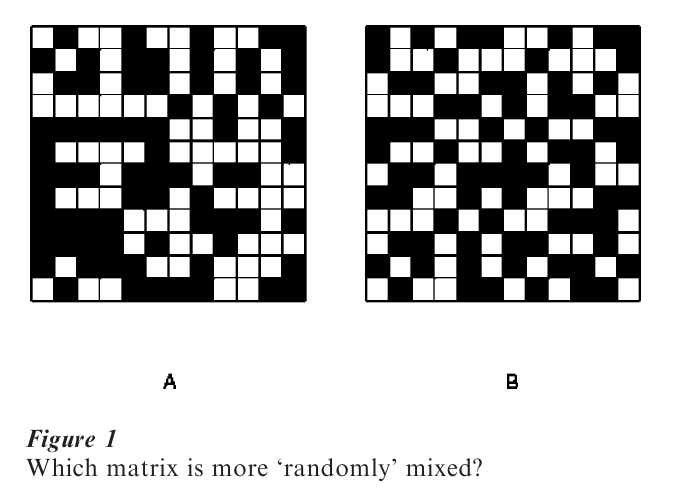
Most people perceive B as more ‘random’ (Falk 1975). A seems to them too ‘clumpy.’ But in fact, about half the pairs of adjacent cells in B are of the same color—exactly as much clumpiness as expected in a randomly mixed matrix. On the other hand, in A, almost two-thirds of neighboring cells are of different colors, which is more alternation than could be expected statistically. But people’s intuitions of randomness (see, e.g., Bar-Hillel and Wagenaar 1991) are characterized by ‘local representativeness’—the erroneous expectation that the short run should exhibit the properties which the law of large numbers promises only in the long run. Thus, local representativeness is like a law of small numbers (Tversky and Kahneman 1971).
3. Availability
If the representativeness heuristic tends to overlook category size, the availability heuristic is used primarily for judging category size—or rather, relative size. Category size relates to probability inasmuch as probability is sometimes taken to be the proportion, in the population as a whole, of instances that belong to some specific category, or possess some specific feature. A statistician who wants to estimate relative frequencies draws a random sample. The cognitive counterpart of the statistician’s procedure is to ‘sample in the mind’—namely, to bring to mind, either by active search or spontaneously, examples of the target population. Sampling in the mind, however, is hardly random. It is subject to many effects that determine the ease with which examples come to mind (Tversky and Kahneman 1973). Examples of such effects are salience, recency, imaginability, and—fortunately— even actual frequency.
Effects that determine the ease of calling to mind are known as availability effects. The availability heuristic is the judgmental procedure of reliance on mental sampling, and is demonstrated in the following example.
Example 6: Subjects were read a list of 39 names of celebrities. In List 1, the 19 women were rather more famous than the 20 men, and in List 2 it was the 19 men who were more famous than the 20 women. Each person heard a single list. They were then asked whether they had heard more female names or more male names. As predicted, when the men [women] were more famous, male [female] names were more frequently recalled. They were also judged, by independent respondents, to be more frequent.
It turns out to be unnecessary actually to bring examples to mind, as it is enough just to estimate how many could be brought to mind. People seem to have a pretty good notion of availability (Tversky and Kahneman 1973), and use it to estimate probabilities.
In Example 7., the availability heuristic leads to a violation of the aforementioned extension principle, mentioned before.
Example 7.: Imagine the following scenarios, and estimate their probability. (a) A massive flood some- where in America, in which more than 1,000 people die. (b) An earthquake in California, causing massive flooding in which more than 1,000 people die.
Respondents estimated the first event to be less likely than the second (Tversky and Kahneman 1983). As discussed earlier, the extension principle logically precludes this possibility: a flood with unspecified causes in a relatively unspecified location is necessarily more likely than one with a more specific cause and location. An earthquake in California, however, is a readily imaginable event which greatly increases the availability—hence the subjective probability—of the flood scenario.
A particularly prominent result from the availability heuristic is the unpacking effect, shown in Example 8.
Example 8.: A well-known 22-year-old Hollywood actress was admitted to a hospital emergency room with pains in the lower right abdomen, which had lasted over 12 hours. What could she be suffering from?
A group of general practitioners from the Stanford area were given this question. Half were asked to assign a probability to the following possibilities: (a) Indigestion (b) Extra-uterine pregnancy (c) Other. The list given to the other half was: (a) Indigestion (b) Extra-uterine pregnancy (c) Acute appendicitis. (d) Inflamed kidney. (e) Cervical inflammation (f ) Other. The first group assigned a probability of 50 percent to the ‘Other’ category. The second group assigned a probability of 69 percent to categories (c) to (f ), although of course these are but a more detailed breakdown (‘unpacking’) of ‘Other’ (Redelmeier et al. 1995). A similar effect is found even when it is hard to argue that the unpacking itself provides additional information. When the category of ‘homicide’ is broken down into ‘homicide by a stranger’ and ‘homicide by an acquaintance,’ the latter two are given a higher total probability as causes of death than the unbroken category (Tversky and Koehler 1994). Here, apparently, the different descriptions of the categories merely call attention to different aspects of the categories. Either by affecting memory or by affecting salience, enhancing the availability of subcategories through more detailed descriptions enhances their perceived probability.
4. Subjective Uncertainty
When judging probability, people can locate the source of the uncertainty either in the external world or in their own imperfect knowledge (Kahneman and Tversky 1982). The latter is what Bayesian theory means by the term subjective probability (whereas in this research paper, recall, the adjective refers to the mode of assessment, rather than to the locus of the uncertainty). When assessing their own uncertainty, people tend to underestimate it. The two major manifestations of this tendency are called overconfidence, and hindsight bias.
Overconfidence concerns the fact that people overestimate how much they actually know: when they are p percent sure that they have answered a question correctly or predicted correctly, they are in fact right on average less than p percent of the time (e.g., Lichtenstein et al. 1982, Keren 1991). Hindsight bias concerns the fact that people overestimate how much they would have known had they not possessed the correct answer or prediction: events which are given an average probability of p percent before they are known to have occurred, are given, in hindsight, probabilities higher than p percent (Fischhoff 1975)—a phenomenon sometimes known as ‘I knew it all along.’
Both these biases can result from biased availability. After all, what we know is almost by definition more available to us than what we do not know. Regarding hindsight, it is enough to note that once something (such as the final outcome) has been brought to mind, it is nearly impossible to ignore (try to ‘not think of a white elephant’).
Regarding overconfidence, it has been shown that it can be dampened by instructing people to ‘think of reasons you might be wrong’ prior to asking them to assess their own confidence (Koriat et al. 1980)—a direct manipulation to increase the availiability of the complementary event, the one competing for a share of the total 100 percent probability. In addition, overconfidence turns to underconfidence in very hard questions (e.g., May 1986). Perhaps in answering easy questions, one’s best guess is mentally prefaced by: ‘I’m not sure I know, but I think that …’ which focuses on the available. In answering hard questions, on the other hand, one’s best guess might be mentally prefaced by: ‘I don’t think I know, but I guess that …’ which focuses on the unavailable.
5. Conclusion
The survey of heuristics and biases involved in people’s judgments under uncertainty shows that subjective probabilities (in the sense of judged probabilities) are not just imperfect or inaccurate versions of objective probabilities, but rather are governed by cognitive principles of their own. These may often lead to good judgments—but in many circumstances entail violations of normative dictates, and hence systematic departures from more rational judgments. This view stands in contrast to earlier views, which saw ‘Man as an intuitive statistician,’ (Peterson and Beach 1967). It also contrasts with recent views (e.g., Cosmides and Tooby 1996, Gigerenzer 1998), which challenge the very appropriateness of a research program that asks people to make probability judgments. This school of thought insists that we evolved to judge frequencies, not probabilities, so we are not to be faulted for the biases in our subjective probabilities. But as long as people are called upon, as in modern life they so often are, to make probability judgments, awareness of the phenomena this research paper described would benefit them greatly.
Bibliography:
- Bar-Hillel M 1979 The role of sample size in sample evaluation. Organizational Behavior and Human Performance 24: 245–57
- Bar-Hillel M 1980 The base-rate fallacy in probability judgments. Acta Psychologica 44: 211–33
- Bar-Hillel M, Neter E 1993 How alike is it versus how likely is it: A disjunction fallacy in stereotype judgments. Journal of Personality and Social Psychology 65(6): 1119–32
- Bar-Hillel M, Wagenaar W A 1991 The perception of random-ness. Advances in Applied Mathematics 12: 428–54 [also in Keren G, Lewis C (eds) 1993 A Handbook for Data Analysis in the Behavioral Sciences Lawrence Erlbaum, Hillsdale, NJ, 369–93]
- Butler J 1736 The Analogy of Religion [‘Introduction’ cited in The Oxford Book of Quotations, 3rd edn. (1979), Oxford University Press, Oxford, UK, p. 117 : 9]
- Cosmides L, Tooby J 1996 Are humans good intuitive statisticians after all? Rethinking some conclusions from the literature on judgment under uncertainty. Cognition 58: 1–73
- Falk R 1975 The perception of randomness. Ph D dissertation [in Hebrew], The Hebrew University, Jerusalem, Israel
- Fischhoff B 1975 Hindsight foresight: The effect of outcome knowledge on judgment under uncertainty. Journal of Experimental Psychology: Human Perception and Performance 1: 288–99
- Gigerenzer G 1998 Ecological intelligence: An adaptation for frequencies. In: Dellarosa Cummins D, Allen C (eds.) The Evolution of Mind. Oxford University Press, New York
- Kahneman D, Tvesky A 1982a Evidential impact of base rates. In: Kahneman D, Slovic P, Tvesky A (eds.) 1982 Judgement Under Uncertainty: Heuristics and Biases. Cambridge University Press, Cambridge, UK
- Kahneman D, Slovic P, Tversky A (eds.) 1982b Judgment under Uncertainty: Heuristics and Biases. Cambridge University Press, Cambridge, UK
- Kahneman D, Tversky A 1972 Subjective probability: A judgment of representativeness. Cognitive Psychology 3: 430–54
- Kahneman D, Tversky A 1973 On the psychology of prediction. Psychological Review 80: 237–51
- Kahneman D, Tversky A 1982 On the study of statistical intuitions. Cognition 11: 123–41
- Keren G 1991 Calibration and probability judgments: Conceptual and methodological issues. Acta Psychologica 77: 217–73
- Koriat A, Lichtenstein S, Fischhoff B 1980 Reasons for confidence. Journal of Experimental Psychology: Human Learning and Memory 6: 107–18
- Lichtenstein S, Fischhoff B, Phillips L 1982 Calibration of probabilities: The state of the art to 1980. In: Kahneman D, Slovic P, Tversky A (eds.) Judgment Under Uncertainty: Heuristics and Biases. Cambridge University Press, Cambridge, UK, pp. 306–34
- May R 1986 Inferences, subjective probability and frequency of correct answers: A cognitive approach to the overconfidence phenomenon. In: Brehmer B, Jungermann H, Lourens P, Sevoaan A (eds.) New Directions in Research on Decision Making. North Holland, Amsterdam, pp. 174–89
- Peterson C R, Beach L R 1967 Man as an intuitive statistician. Psychological Bulletin 68(1): 29–46
- Redelmeier D, Koehler D J, Liberman V, Tversky A 1995 Probability judgment in medicine: Discounting unspecified alternatives. Medical Decision Making 15: 227–30
- Tversky A, Kahneman D 1971 The belief in the ‘law of small numbers. ’Psychological Bulletin 76: 105–10
- Tversky A, Kahneman D 1973 Availability: A heuristic for judging frequency and probability. Cognitive Psychology 5: 207–32
- Tversky A, Kahneman D 1974 Judgment under uncertainty: Heuristics and biases. Science 185: 1124–31
- Tversky A, Kahneman D 1983 Extensional versus intuitive reasoning: The conjunction fallacy in probability judgment. Psychological Review 90: 293–315
- Tversky A, Koehler D J 1994 Support theory: A nonextensional representation of subjective probability. Psychological Review 101: 547–67
ORDER HIGH QUALITY CUSTOM PAPER

Always on-time

Plagiarism-Free

100% Confidentiality