
View sample Signal Detection Theory Research Paper. Browse other research paper examples and check the list of research paper topics for more inspiration. If you need a religion research paper written according to all the academic standards, you can always turn to our experienced writers for help. This is how your paper can get an A! Feel free to contact our custom writing services for professional assistance. We offer high-quality assignments for reasonable rates.
Signal detection theory (SDT) is a framework for interpreting data from experiments in which accuracy is measured. It was developed in a military context, then applied to sensory studies of auditory and visual detection, and is now widely used in cognitive science, diagnostic medicine, and many other fields. The key tenets of SDT are that the internal representations of stimulus events include variability, and that perception (in an experiment, or in everyday life) incorporates a decision process. The theory characterizes both the representation and the decision rule.
Academic Writing, Editing, Proofreading, And Problem Solving Services
Get 10% OFF with 24START discount code
1. Detection And Discrimination Experiments
Consider an auditory experiment to determine the ability of a listener to detect a weak sound. On some trials, the sound is presented, and the listener is instructed to say ‘yes’ (I heard it) or ‘no’ (I did not hear it). On other trials, there is no sound, discouraging the observer from responding ‘yes’ indiscriminately. The presence of variability in sensory systems leads us to call these latter presentations noise (N ) trials, and the former signal plus noise (S + N ) trials. Responses of ‘yes’ on signal trials are called hits, and on no-signal trials are called false alarms. The observer’s performance can be summarized by a hit rate (here 0.84) and a false-alarm rate (here 0.30).
The variability principle implies that repeated presentation of the signal leads to a distribution of internal effect, as does repeated presentation of no signal. In the most common SDT model, these distributions are assumed to be normal, and to differ only in mean, as shown in Fig. 1.
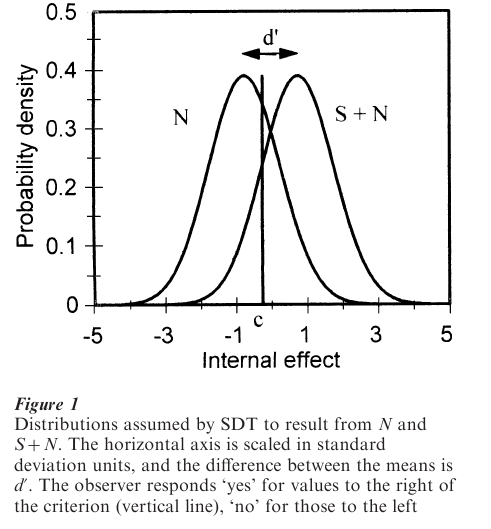
How does the observer reach a decision in this experiment, when any observation on the ‘internal effect’ axis is ambiguous with regard to source? The best decision rule is to establish a criterion value c on the axis, and respond ‘yes’ for values to the right of c, ‘no’ for values to the left. The location of the criterion can be determined from the data, for the area above it under the S + N distribution must equal the hit rate. Consulting a table of the normal distribution reveals that in the example above the criterion must therefore be about one standard deviation below the mean of that distribution. Similarly, the area above the criterion under the N distribution must equal the false- alarm rate, so the criterion is about 0.5 standard deviations above the mean of that distribution.
2. Sensitivity And Response Bias
Figure 1 offers natural interpretations of the sensitivity of the observer in the task and of the decision rule. Sensitivity, usually denoted d´, is reflected by the difference between the two distribution means; this characteristic of the representation is unaffected by the location of the criterion, and is thus free of response bias. The magnitude of d´ is found easily by computing the distances between each mean and the criterion, found in the last section:
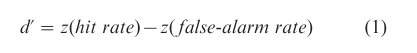
where z( p) is the point on a unit-normal distribution above which the area p can be found. The function z is negative for arguments less than 0.5 and positive for arguments above that value. In the example,
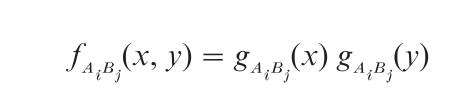
Criterion location is one natural measure of response bias. If evaluated relative to the point at which the two distributions cross, it can be calculated by a formula analogous to Eqn. 1:
![]()
In the example above
![]()
that is, the criterion is slightly to the left of the crossover point, as in fact is shown in Fig. 1.
3. Receiver Operating Characteristic (ROC) Curves
If sensitivity truly is unaffected by the location of the response criterion, then a shift in that criterion should leave d unchanged. An observer’s decision rule can be manipulated between experimental runs through instructions or payoffs. In the more efficient rating method, a rating response is required; the analysis assumes that each distinct rating corresponds to a different region along the axis of Fig. 1, and that each region is defined by a different criterion. The data are analyzed by calculating a hit and false-alarm rate for each criterion separately. A plot of hit rate vs. false alarm rate is called a receiver-operating characteristic, or ROC; the ROC that would be produced from the representation in Fig. 1 is shown in Fig. 2. Points at the lower end of the curve correspond to high criteria, and the curve is traced out from left to right as the criterion moves from right to left in Fig. 1.
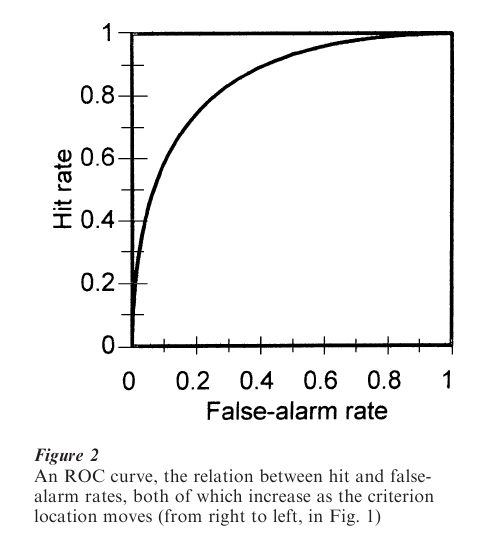
The shape of the ROC is determined by the form of the distributions in the representation, and data largely support the normality assumption. However, the assumption that the S + N and N distributions have the same variance is often incorrect (Swets 1986). In such cases, the area under the ROC is a good measure of accuracy (Swets and Pickett 1982); this index ranges from 0.5 for chance performance to 1.0 for perfect discrimination. An entire ROC (from a rating experiment, for example) is needed to estimate this area.
4. Alternative Assumptions About Representation
The essence of signal detection theory is the distinction between the representation and the decision rule, not the shape of the underlying distributions, and two types of nonnormal distributions have been important. One such distribution is the logistic, which has a shape very similar to the normal but is computationally more tractable. Logistic models have been used for complex experimental designs, and for statistical analysis. Another family of distributions, whose shape is rectangular, leads to rectilinear ROCs and can be interpreted as support for ‘thresholds’ that divide discrete perceptual states. Such curves are unusual, experimentally, but have been found in studies of recognition memory (Yonelinas and Jacoby 1994). Models using threshold assumptions have been developed for complex experimental situations, such as source monitoring in memory; in this context, they are called multinomial models.
5. Identification And Classification Along A Single Dimension
Detection theory is extended easily to experiments with multiple stimuli differing on a single dimension. For example, a set of tones differing only in intensity may be presented one at a time for identification (the observer must identify the exact stimulus presented) or classification (the observer must sort the set into two or more categories). The representation is assumed to be a set of distributions along a decision axis, with m 1 criteria used to assign responses to m categories.
SDT analysis allows the calculation of d´ (or a related measure, if equal variances are not assumed) for any stimulus pair, and an interesting question concerns the relation between this value and that found in a discrimination task using just those two stimuli. According to a theory of Braida and Durlach (1988), identification d will be lower than discrimination d´ by an amount that reflects memory constraints in the former task. The predicted relation is qualitatively correct for many stimulus dimensions, and can be quantitatively predicted for tones differing in intensity.
6. Complex Discrimination Designs And Multidimensional Detection Theory
The one-interval design for measuring discrimination is appropriate for some applications (it seems quite natural in recognition memory, for example, where the S N trials are studied items and the N trials are foils), but other methods are often preferred. One popular technique is two-alternative forced-choice (2AFC), in which both stimuli are presented on every trial and the observer must say whether N or S + N occurred first. Another method is same-different, in which there are again two intervals, but each interval can contain either of the two stimuli and the observer must say whether the two stimuli are the same or different.
These and many other designs can be analyzed by assuming that each interval is represented by a value on a separate, independent perceptual dimension. Although d is a characteristic of the stimuli and the observer, and therefore constant across paradigms, performance as measured by percent correct [ p(c)] varies widely (Macmillan and Creelman 1991). For example, Sect. 2 showed that if d´ = 1.5, p(c) = 0.77 in the one-interval task; but in 2AFC the same observer would be expected to score p(c) = 0.86, and in the same-different task as low as p(c) = 0.61. The relation between one-interval and 2AFC was one of the first predictions of SDT to be tested (Green and Swets 1966), whereas that between same-different and other paradigms is a more recent topic of investigation. An interesting aspect of same-different performance is that two distinct decision strategies are available, and their use depends on aspects of the experimental design and stimulus set (Irwin and Francis 1995)
Many identification and classification experiments use stimulus sets that themselves vary in multiple dimensions perceptually, and SDT analysis can be extended to this more general case. Multidimensional detection theory has been particularly helpful in clarifying questions about independence (see Ashby 1992).
7. Comparing Observed With Ideal Or Theoretically-Derived Performance
Detection theory has provided a forum for asking a slate of questions about the optimality of performance. One set of issues concerns the degree to which human behavior falls below the ideal level set by stimulus variability. Early auditory experiments using external noise revealed that human ‘efficiency’ was often quite high, though never perfect. A different type of application concerns the theoretical prediction of the ratio between the S + N and N standard deviations, which can be derived from the shape of the ROC shape. For example, this ratio should be less than unity for detection experiments in which signal parameters are not known by the observer (Graham 1989). Ratcliff et al. (1994) showed that for an important class of recognition memory models, the ratio should be approximately 0.8, as it is empirically.
Some strong assumptions about the decision process that is at the heart of SDT have been tested. In general, these are well supported for one-dimensional representations, but complications sometimes arise for higher dimensionality. Do observers establish fixed criteria? Experiments requiring discrimination between distributions of stimuli have shown that they do when the variability is in one dimension and with adequate experience in two dimensions as well. Do observers set ‘optimal’ criteria? Actual criterion settings are often conservative compared to ideal ones predicted by Bayes’s Theorem. In a multidimensional task, observers appear to adopt appropriate decision boundaries when those are simple in form (e.g., linear), but fall short of optimality when more complex rules are required. Does the representation remain fixed in the face of task variation? In one dimension, this amounts to the original, often-replicated datum that d´ (or some sensitivity measure) is unchanged when criterion changes. In more than one dimension, attentional effects can alter the representation (Nosofsky 1986), and the question of what is invariant in these cases is still unresolved.
Bibliography:
- Ashby F G (ed.) 1992 Multidimensional Models of Perception and Cognition. Erlbaum, Hillsdale, NJ
- Braida L D, Durlach N I 1988 Peripheral and central factors in intensity perception. In: Edelman G M, Gall W E, Cowan W M (eds.) Auditory Function. Wiley, New York, pp. 559–83
- Graham N V 1989 Visual Pattern Analyzers. Oxford University Press, Oxford, UK
- Green D M, Swets J A 1966 Signal Detection Theory and Psychophysics. Wiley, New York
- Irwin R J, Francis M A 1995 Perception of simple and complex visual stimuli: Decision strategies and hemispheric differences in same-different judgments. Perception 24: 787–809
- Macmillan N A, Creelman C D 1991 Detection Theory: A User’s Guide. Cambridge University Press, New York
- Nosofsky R M 1986 Attention, similarity, and the identification-categorization relationship. Journal of Experimental Psychology: General 115: 39–57
- Ratcliff R, McKoon G, Tindall M 1994 Empirical generality of data from recognition memory receiver-operating characteristic functions and implications for the global memory models. Journal of Experimental Psychology: Learning, Memory, and Cognition 20: 763–85
- Swets J A 1986 Form of empirical ROCs in discrimination and diagnostic tasks. Psychological Bulletin 99: 181–98
- Swets J A, Pickett R M 1982 Evaluation of Diagnostic Systems: Methods from Signal Detection Theory. Academic Press, New York
- Yonelinas A P, Jacoby L L 1994 Dissociations of processes in recognition memory: Effects of interference and of response speed. Canadian Journal of Experimental Psychology 48: 516–34
ORDER HIGH QUALITY CUSTOM PAPER

Always on-time

Plagiarism-Free

100% Confidentiality