
View sample cancer research paper on cancer economics. Browse other research paper examples for more inspiration. If you need a thorough research paper written according to all the academic standards, you can always turn to our experienced writers for help. This is how your paper can get an A! Feel free to contact our writing service for professional assistance. We offer high-quality assignments for reasonable rates.
Cancer economics may be defined as a nascent field of applied research focusing on the resource implications of all forms of malignant disease. The field has been forged by the rapid growth in cancer incidence and prevalence worldwide, by continuing technological advances in detection and treatment of the disease, and reimbursement and pricing issues facing virtually all medical care financing systems. Empirical methods dominate work in the field, with hypotheses generated typically by simple economic precepts and tested with secondary data such as administrative claims records. As a result, the nature and scope of cancer economics vary over time and place, and the growth of its cumulative knowledge base is both slow and uneven. Any attempt to delineate the field will perforce be time-dependent, restricted in scope, and limited in the depth of coverage. The aim of this research paper is to present key features of the field as it has developed in the English language literature in the more advanced economies of North America, Western Europe, and Australia over the past decade, 1995–2005. These limitations in focus make the task at hand more manageable, while still providing a meaningful basis for describing the central characteristics of this emerging field.
Academic Writing, Editing, Proofreading, And Problem Solving Services
Get 10% OFF with 24START discount code
Conceptual Overview
A fundamental premise of economics is that resources are always scarce relative to the wants they may satisfy, so they must be used as efficiently as possible. Economists have developed an elaborate theory that posits that scarce resources will be used most efficiently under the conditions prevailing in well-functioning market systems. Market allocations to cancer detection, treatment, and research, however, may not yield fully efficient outcomes because cancer markets are thought to function imperfectly, if they exist at all. Public policy actions targeting cancer markets are then needed to shift, arrange, and/or attract resources to ensure better outcomes. Cancer economics contributes policy-relevant knowledge to decision makers charged with the responsibility of designing and evaluating these policies. In recent years, these contributions have focused mostly on the opportunity costs of cancer, that is, the value of resources given up (foregone) for alternative uses when they are committed to fight cancer in various ways. Opportunity costs of cancer have been investigated at two levels: (1) the full costs to patients, their families, and society in detecting and treating the disease itself, and (2) the opportunity costs of alternative interventions for detecting, diagnosing, and treating cancer to patients, payers, and society.
The most visible costs of the disease are the amounts spent on all cancer-related health-care services – conventionally referred to as the direct costs of cancer. Direct costs are computed as Si ci qi, where q represents service units, c represents mean cost, and i indexes all relevant services used in detecting and treating cancer during a given period. The ci in the cancer field are invariably observed amounts paid to health-care providers, which differ by how the payer group is defined. The literature often takes the limited perspective of third-party payers, so the costs are valued only for reimbursable services (inpatient hospital care, physician services, skilled nursing, and the like) and the types of providers covered by the insurance plan. From a broader societal perspective, the costs incurred by patients and their families (deductibles and coinsurance payments, expenditures for special diets, durable medical equipment, outpatient drugs, etc.) are also included in the tally. In either case, the key research question is what determines the level and distribution of direct costs. This question has assumed increasing policy significance because of the widespread assumption that cancer costs are bloated by inefficiencies in the delivery system. These inefficiencies stem from demand distortions introduced by extensive insurance coverage and imperfect rate-setting policies, among others; they also stem from the high degree of uncertainty surrounding the effectiveness of cancer treatment and the corresponding wide variation in what is considered best-practice care.
Opportunity costs of the disease are also incurred even if cancer is never detected or treated, and these costs add cumulatively to overall direct costs when it is. Individuals with undetected disease, as well as treated survivors, may experience periods when they are unable to fulfill major role responsibilities and, regrettably, they may die prematurely. The time away from major responsibilities such as market work or home making can be valued (by human capital methods) as the lost market earnings of workers and the replacement value of homemaking services. When they refer to cancer patients or survivors themselves, these losses are called morbidity or disability costs. They are typically calculated for n prevalent cases as Sn wn Tn, where T represents time away from work and w average earnings loss per time unit. Family or household members may also lose time away from market work to assist cancer patients and/or provide valuable in-home services to those patients that substitute for formal health-care services. The imputed value of household-produced care is often referred to as the informal costs of cancer, and they are estimated in a way analogous to morbidity costs. For decedents, economists compute the number of years an individual might be expected to live with and without cancer, and then use the difference to gauge how many years the cancer death was premature. The stream of foregone income (market earnings) over these lost years is then estimated and discounted back to its present value, which adjusts for the fact that income received sooner is valued more highly than income received later. These computations are called mortality costs. Because morbidity, disability, informal, and mortality costs are not valued directly in the market, they are referred to as the indirect costs of the disease. Research has focused mostly on the determinants and distribution of the morbidity and informal components of indirect costs.
Opportunity costs at the level of interventions are the central focus of cost-effectiveness analyses (CEAs) of alternative means of detecting and treating cancer, such as alternative types of surgery, chemotherapy regimens, screening and diagnostic tests, supportive care protocols, and so forth. CEAs appraise the extent to which the incremental difference in costs (C) between any substitutable pair of interventions (a and b) is commensurate with the incremental change in outcomes (E) that each yields, that is, (Ca -Cb)/(Ea-Eb ). (We refer hereafter to this as the incremental cost-effectiveness ratio or ICER.) Estimated ICERs typically encompass elements of the opportunity costs of the disease: Direct costs of care figure prominently in the cost numerator term and effectiveness denominators use many of the same disease parameters as indirect cost estimates. However they are measured, ICERs are ultimately judged in terms of the commensurability between extra costs and outcome gains. (How commensurability is judged depends on the metric of the denominator term, a matter taken up below.) The issue of commensurability creates tension between economic and clinical decision processes. The clinicians’ decision rule is, above all, do no harm. In contrast, economists believe that even an intervention that does a small amount of good can be economically inefficient if it can do this good only at incommensurately higher costs. This conclusion depends crucially on whether the perspective of the analysis is society at large, a payer group, or an individual patient.
For expository purposes, applied research on the opportunity costs of cancer may be divided three ways: aggregate studies of the economic burden of cancer; microlevel studies of direct and indirect costs of cancer, and cancer-related CEAs. The next three sections discuss each of these aspects of the field in turn.
Aggregate Estimates Of The Economic Burden Of Cancer
The sum of total direct, morbidity, and mortality costs in a given year is referred to as the economic burden of cancer in that year. In any given country and point in time, aggregate burden estimates provide a convenient, though imprecise, measure of the size and structural characteristics of the cancer economy. The United States, for instance, now routinely produces estimates of these costs, cross classified by the most common cancers and by type of provider. The total economic burden for 2005 was put at $US214 billion, up from an estimated $US72 billion (current dollars) in 1985 (Brown, 1990; ACS, 2006). When general and medical care inflationary trends are taken into account, the 1985 value is roughly equivalent to 152 billion in 2005 constant U.S. dollars. (Note: unless otherwise indicated, all cost figures reported in this research paper have been adjusted by the author to year 2005 U.S. dollars; see Tables 1 and 3). The present discounted value of mortality losses is the largest component, accounting for about 56% of the total in 2005, whereas direct costs accounted for slightly more than 35%, and indirect morbidity costs the remaining 9%. Direct costs differed substantially by type of cancer and provider. For example, more than half of total direct costs in 2005 was accounted for by the four most prevalent cancers: lung, breast, colorectal, and prostate; and roughly 90% of total direct costs was accounted for by hospital and physician services. Over the period 1985–2005, constant dollar aggregate costs rose at an annual rate of approximately 1.7% per annum, though the indirect and direct components increased at different rates, roughly 2.2 and 1.1% per year, respectively. While direct costs grew at approximately twice the rate of annual new cancer cases, they grew at the same general pace as all health-care spending in the United States over the same period. The percentage of total spending accounted for by cancer, therefore, is roughly the same now (4.7%) as it was 20 (and, indeed, 40) years ago (Brown et al., 2001).
Countless methodological problems mar aggregate burden estimates. To illustrate, estimates of direct and indirect morbidity costs are usually based on annual cancer prevalence data, whereas mortality costs are, by definition, incidence-based. The admixture tends to gauge only short-term, as opposed to lifetime, effects of a cancer diagnosis, especially morbidity/disability consequences. Human capital accounting probably overstates indirect costs relative to newer methods, for example, the friction cost approach. Top-down procedures used to allocate health-care utilization to cancer on the basis of principal diagnostic codes often omit significant interactions between cancer and major comorbidities. The policy uses of these aggregate burden estimates have also been questioned. There is a line of economic reasoning that interprets them as the present value of annual economic yields realized in perpetuity of investments that (hypothetically) prevent all cancers this year. This interpretation assumes, among many other assumptions, cause-independence in the disease data, which overstates economic benefits relative to those that might be yielded in a competing risk framework. The aggregate figures thus tend to be presented without much theoretical justification, and they are used simply as guidelines for research investments and as background data for budget deliberations in the legislative process.
Methodological differences also render international comparisons of aggregate cancer burdens difficult, if not impossible, to make. For example, computed real changes in total direct and indirect costs over the period 1986–1998 in Canada grew at an annual rate of 0.9% per year, or only about one-half that of the United States (Health Canada, author’s calculations). However, the policy relevance of this comparison is quite limited, because the methods used to compute indirect costs, among others, differ significantly between the two nations. As a result, international comparisons are often just restricted to direct cancer costs. But even these estimates differ widely, not only because of variations in medical practice patterns, but also because of the methods used to allocate national health expenditures to disease categories and to differences in the items, for example, patient copayments, included in the expenditure data. Polder and colleagues (2005) recently demonstrated that the published percentages of total health expenditures attributable to cancer in Australia, Canada, Germany, the Netherlands, United Kingdom, and Sweden are much higher than they are in the United States, averaging 6.1% (SD = 1.5) across the six nations versus the 4.7% in the United States. But when adjustments are made that account for the differences in methodology, the mean of the six nations is 4.5% (SD = 0.5), or 0.2 percentage points lower than in the United States. Of course, absolute cost differentials are much greater, because the United States spent in 2005 about 15% of its GDP on the health sector, whereas the six countries just mentioned averaged only 9.5% (SD = 1.5) of GDP.
Microlevel Studies Of Direct Cancer Costs
Given the methodological limitations of aggregate estimates, attention has shifted recently to microlevel studies of direct costs, in some cases to build economic burden estimates from the bottom up rather than top down and, simultaneously, to shift from prevalence to incidence-based estimates of the cumulative costs of cancer episodes. Microlevel studies have also been designed to advance our understanding of cost drivers for reimbursement and cost containment purposes. Although there is increasing interest in payments to medical care providers beyond those covered by third-party insurance, especially out-of-pocket spending by cancer patients themselves, most microlevel studies take a payer perspective. This focus is not surprising because these studies have been based on newly generated administrative claims data sets.
One such data set, constructed by researchers at the U.S. National Cancer Institute, links cancer registry cases in 11 surveillance epidemiology and end results (SEER) regions to Medicare claims records at the individual patient/beneficiary level. In contrast to prevalence-based studies, these linked data permit samples of patients with confirmed cancer diagnoses to be followed analytically over the entire course of the disease episode. Direct costs (program reimbursements) can be cumulated over the disease episode, both in total and for various subcategories built up from available diagnosis and provider service codes. These cost profiles only encompass the set of services reimbursable under the insurance plan. (Medicare coverage excludes, for instance, nursing home care and, until quite recently, outpatient drugs.) A methodological limitation of most linked data sets such as SEER-Medicare is that cost profiles are often truncated or censored, on the right-side for patients still alive at the end of the observation period, and sometimes also on the left for individuals who may have been diagnosed before they became Medicare-eligible. Incomplete cost profiles have led researchers to divide the cancer episode into various phases or treatment-related periods. The most common set of phases is three-fold: the initial 6-month period following cancer diagnosis, the 6-month period immediately prior to death for
decedents, and the annual costs between the initial phase and death for decedents or the end of the observation period for survivors. Differing numbers of patients thus contribute complete data for computing cumulative cost totals for each treatment phase. With the aid of projected annual survival probabilities, these phase-specific estimates can then be assembled serially to compute the lifetime costs of the cancer in question.
Linked registry/claims data at the level of individual beneficiaries can also be used to analyze the myriad factors that shape the cost distributions of cancer care. Common points of departure in such analyses are differentials in costs across the stages at which various malignancies are diagnosed, as well as across the phases of treatment. The general expectation is that treatment costs of virtually all cancers rise systematically with the stage at which the cancer is diagnosed. With respect to the phase of treatment, the expectation is that costs will be higher in the initial and terminal phases of treatment, but lower in between. Table 1 sets out stage and phase related data as percentages of initial phase, early stage cumulative cost amounts for three common malignancies in the United States; two different results are presented for female breast cancer to illustrate the potential confounding effects of age and type of provider. Costs of the initial treatment phase do generally differ by stage, though late-stage disease often costs less if physicians choose not to treat aggressively. Note that the longer stream of follow-up costs that attend longer periods of survivorship may offset lower initial treatment costs.
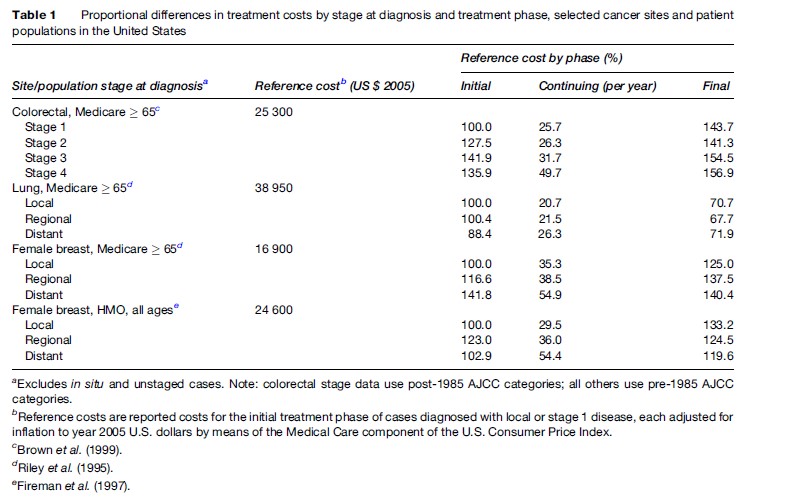
Stage at diagnosis, of course, is only one of a large number of variables that help explain cost variations across patients. Unless these other explanatory variables are also included in the analysis, measured effects of stage are probably overstated. Other significant predictors include the sociodemographic characteristics of patients, especially age and income status, and medical comorbidities. In some U.S. studies, the economic characteristics of providers such as the supply of specialist physicians and the volume of procedures at specific hospitals, are also significant predictors. Yet the predictors included in multivariate statistical models of cancer treatment costs do not ordinarily account fully for the dispersion (variance) in cumulative cost distributions, even those for the most common cancers. Statistical noise in cost data suggests the presence of economic inefficiencies. Second-generation studies are needed to explain a greater fraction of the variance in costs across subgroups of cancer patients, as well as pinpoint areas of likely inefficiency requiring policy action. These studies will require additional and better-measured covariates, as well as more robust multivariate statistical techniques, for dealing with the complexities of cancer cost data.
Microlevel Studies Of Indirect Costs
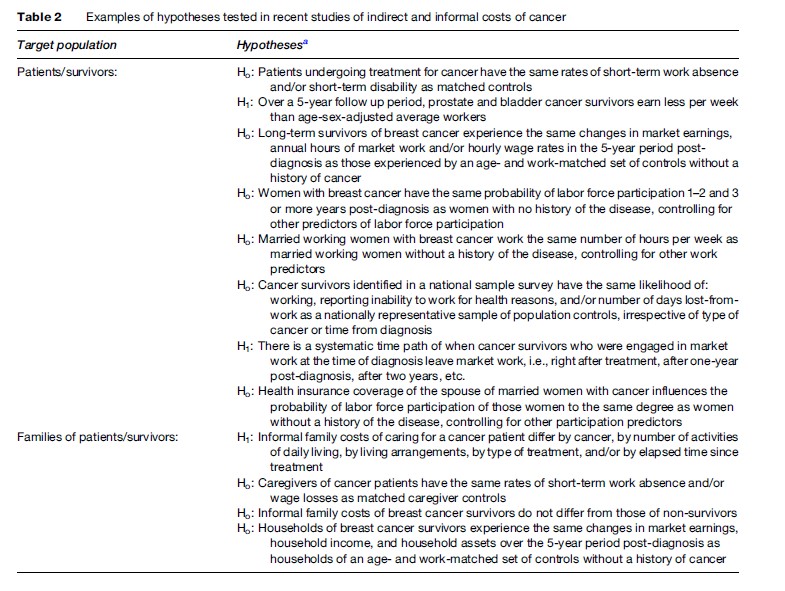
These microlevel studies focus mainly on morbidity/disability effects on the economic fortunes of individuals diagnosed and treated for malignant disease; many also focus on informal costs, the economic impact of that cancer on family or household members. Table 2 lists some basic hypotheses tested in recent studies (most, but not all, conducted in the United States) as a means of summarizing a disparate, though growing, literature on indirect/informal costs. Many studies test hypotheses about the work activity of cancer survivors. An earlier literature on this topic probed simply whether individuals treated for various cancers returned to market work after treatment, if working before diagnosis. The more recent literature examines a broader set of questions, including whether survivors work progressively fewer hours and/or earn less per hour worked so as to experience diminutions in economic welfare the longer they survive their cancer. There is convincing evidence that do reduce their own work effort after diagnosis and initial treatment, though this evidence refers to only several of the most common cancers and has been based mostly on small convenience samples. These short-term effects are easy to understand, given the rigor of many cancer treatments, especially chemotherapy. Longer-run changes are more challenging to explain. Evidence of residual functional impairment is often implicated, for example, the impaired use of arms and shoulders of women developing lymphedema after axillary surgery for breast cancer. Yet there is also evidence that family income and availability of pensions predict work reductions, suggesting that preferences for more leisure also play a role in the economic behavior of long-term survivors. Whether cancer shifts these preferences warrants further study.
Whatever the impact on the survivor herself, research suggests that the economic behavior of household members also changes when an individual is diagnosed and treated for cancer. In the immediate period of treatment, family members change their work schedules in order to accommodate the cancer patient. A more important issue from an economic perspective is what happens over the longer run. On the one hand, there is fragmentary evidence that household members change their own commitment to market work in the aftermath of a family member’s cancer treatment, though the direction of this change is ambiguous. Some individuals work less, perhaps as a means of sharing the additional leisure time sought by the cancer patient herself, whereas others engage in more market work to compensate for the losses to family income by reduced work effort of the patient. On the other hand, family members may spend more time producing informal care and home services, both in caring for the patient and substituting for the patient’s historical role in running the household.
Second-generation studies should focus on the growing policy importance of indirect cancer costs. Rising prevalence rates are one reason; the advent of novel therapies are another. Consider, for example, that targeted therapies based on recent advances in genomics and molecular biology are expected to have high direct costs, in part because the number of patients that can benefit from any one of them is expected to be small. Yet if these therapies lessen side effects and/or shift some therapy away from highly invasive procedures performed in formal settings, there may be highly significant, compensatory effects on indirect costs. Cancer economists should be preparing now to analyze the net effect of the shift from provider to patients and families on the costs of these new therapies.
Cancer-Related Cost-Effectiveness Analyses
Cost-effectiveness analysis (CEA) is used in the cancer field in virtually the same way it is used elsewhere. The boundaries of this part of the field thus overlap with cognate areas such as pharmacoeconomics. Yet cancer-related CEAs warrant discussion here because they rely algebraically on direct and indirect cost estimates in ICER numerator terms, and many ICER denominators are disease-specific.
With respect to denominators, some studies use cancerspecific process measures, for example, the number of mammographies performed or the number of polyps detected in breast or colon cancer screening interventions, which permit within-class comparisons of cost per process unit. These comparisons, however, are conditioned on the assumption that the entire class of interventions itself is cost-effective, often a doubtful assumption. Thus, many studies use more broadly conceived denominator terms, the two most common being changes in life years (LYs) and quality-adjusted life years (QALYs). LY denominators gauge changes in life expectancy, and thus can be compared across an extensive set of life-saving health interventions. QALY denominators may be described as composite measures that reflect functional capacities or quality of life during, as well as the length of, cancer survivorship. Although LYs are only disease-specific to the extent that changes in cancer deaths are translated into differences in life expectancy, many cancer-related QALYs are constructed in terms of health states unique to cancer treatment. Some illustrations from a recent review by Earle and colleagues (2000) include recurrence of disease, adverse events attending therapy, advanced cancer but responding to hormonal therapy, partial impotence from prostate cancer surgery, and terminal metastatic breast cancer, among others. These health states are then assigned preference or utility weights by various means to reflect their relative value. (Utilities here have the same conceptual meaning as those described in economic textbooks; their role in calculating QALYs explains why studies using these denominators are now referred to as cost-utility analysis.) In cancer-related analyses, utility weights have been elicited mostly from oncology specialists and cancer patients. QALY denominators admit to comparisons across a broad range of health-saving interventions.
There are two primary analytic frameworks within which incremental cost per LY or cost per QALY ratios have been estimated. One is the modeling approach, which relies on decision-analytic (or equivalent) techniques to project under conditions of uncertainty differences in disease outcomes and the cumulative use of cancer-related services of synthetic cohorts undergoing a specific intervention versus, say, standard care. The expected values of the temporal outcome and cost streams are then used to construct the ICER for the intervention. Parameter estimates needed to estimate the model such as likelihood of death or probability of recurrence at each time point are retrieved from literature reviews, metaanalyses of clinical trial results, and so forth. Since the true values of many parameters are unknown, modeling studies typically conduct sensitivity analyses based on small changes in the values of critical parameters, either alone or in combination, to assess their impact on the estimated ICER.
Since the gold standard for determining the true effect of an intervention is a randomized control trial, the second framework is thus a cancer clinical trial that adds cost endpoints. Perhaps surprisingly, there has been continuing controversy about the desirability of adding CEAs to trials. One reason is that trial CEAs may not generalize well. Trials enroll comparatively homogeneous, but not always representative, patient populations, whereas CEAs attempt to gauge the costs and outcomes that obtain in the community at large. Another is that the cost of conducting a trial increases substantially because sample size and the length of the observation period for cost endpoints are much greater than clinical endpoints. When CEAs are just tacked on to trials, questions of statistical power and heavily censored cost endpoints arise. Finally, cost comparisons run into problems in international trials enrolling patients across national borders because of variations in practice patterns, as well as in relative and absolute price differences across nations.
Although they are often combined, the recent cancerrelated CEA literature nonetheless divides naturally between trial-based and modeling efforts. CEA studies built into trials tend to focus on cancer therapies, especially new drugs or drug combinations, and they are usually conducted from a payer perspective. Although straightforward, these CEAs often yield divergent results, especially across time and place. Nonetheless, this class of CEAs has found a ready group of decision makers interested in using the results for reimbursement and pricing policies, practice guideline development, and other actions influencing how scarce cancer resources are allocated. The development of institutional decision mechanisms has fostered this use. The creation of NICE (National Institute for Health and Clinical Excellence) in the United Kingdom and the threshold levels of cost per QALY that they have set to appraise new medical technologies is a case in point.
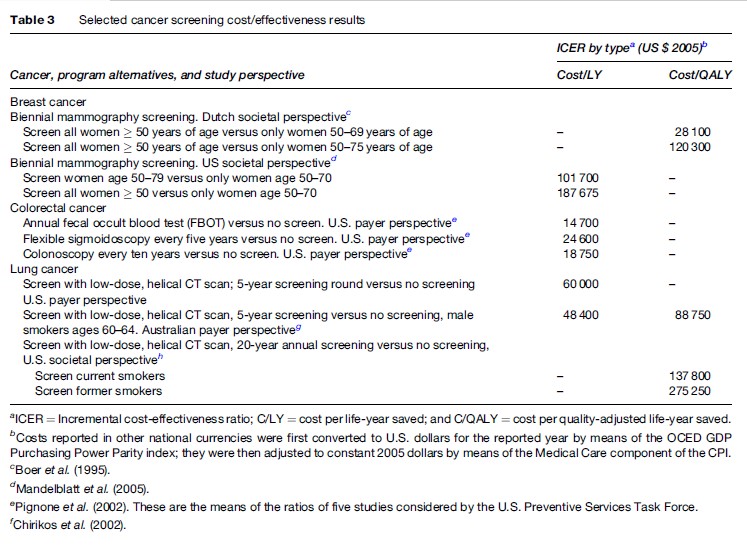
Modeling-related CEAs tend to appraise ICERs from a societal as well as payer viewpoint. They often compare a given intervention to no intervention and/or assess whether an intervention thought to be economically efficient when targeting a particular population subgroup is also cost-effective when targeting another subgroup. Cancer-related CEA studies of adjuvant therapy are cases in point. They have focused on the economic implications of adding adjuvant therapy to the treatment regimens of patients who have typically not received it, such as older patients or those with less severe disease. A related area of interest in modeling studies is cancer screening interventions. Table 3 summarizes some recent findings of screening CEAs testing age limits in breast cancer, different detection methods in colorectal cancer, and the use of expensive CT scanning to detect lung cancer. As might be expected, there are wide variations in these results, particularly for screening at different ages or by means of an expensive technology for which there are yet no trial data determining actual efficacy. The differences often stem from analytic assumptions about the discount, attrition, and/or recurrence rates, among others; they also stem from how uncertainty is treated in the model. Yet the results are useful in showing the range of potential opportunity costs of such screening, thereby providing a point of reference for conducting screening trials.
These results, however, illustrate a more fundamental limitation of CEAs that is not always appreciated by cancer specialists. These results can only be interpreted in relative or ordinal terms and few, if any, computed CEA ratios can ever be completely ruled out. To be sure, the maintained hypothesis is that viable ICERs do not exceed some rule of thumb or cut point – $50 000 per QALY is one. From the viewpoint of economic theory, however, this cut point is completely arbitrary, so caution must be exercised when using it to judge the commensurability of costs and outcomes. Furthermore, in theory, all CEA results are rank-ordered from low to high, and interventions are then funded seriatim until the overall budget is exhausted. This rank-ordering should encompass all interventions with identical denominator terms, not necessarily just cancer interventions. More important is the fact that the budget is determined exogenously by the political or payer authorities. There is nothing in cost-effectiveness analyses that provides guidance to the determination of the overall amount of resources to be allocated to the cancer sector. In contrast, cost–benefit analysis, wherein both numerator and denominator terms are measured in monetary units, can be used, at least in principle, to determine the optimal budget for cancer interventions by equalizing the rate of return across all competing interventions. Similarly, willingness to pay or contingent valuation methods may also provide usable economic results for decisions about the cancer budget. There is growing sentiment in the field that cost–benefit analysis should be used more extensively, despite ethical concerns arising from the need to value life in monetary terms.
Bibliography:
- American Cancer Society (ACS) (2006) Cancer Facts and Figures. Atlanta, GA: ACS.
- Boer R, de Koning HJ, van Oortmarssen GJ, et al. (1995) In search of the best upper age limit for breast cancer screening. European Journal of Cancer 31A: 2040–2043.
- Brown ML (1990) The national economic burden of cancer: an update. Journal of the National Cancer Institute 82: 1811–1814.
- Brown ML, Riley GF, Potosky AL, et al. (1999) Obtaining long-term disease specific costs of care, application to Medicare enrollees diagnosed with colorectal cancer. Medical Care 37: 1249–1259.
- Brown ML, Lipscomb J, and Snyder C (2001) The burden of illness of cancer: economic cost and quality of life. Annual Review of Public Health 22: 91–113.
- Chirikos TN, Hazelton T, Tockman M, et al. (2002) Screening for lung cancer with CT: a preliminary cost-effectiveness analysis. Chest 121: 1507–1514.
- Earle CC, Chapman RH, Baker CS, et al. (2000) Systematic overview of cost-utility assessments in oncology. Journal of Clinical Oncology 18: 3302–3317.
- Fireman BH, Quesenberry CP, Somkin CP, et al. (1997) Cost of care for cancer in a health maintenance organization. Health Care Financing Review 18: 51–76.
- Health Canada (1998) Economic Burden of Illness in Canada. Ottawa, Canada: Policy Research Division, Population and Public Health Branch, Health Canada.
- Mahadevia PJ, Fleisher LA, Frick KD, et al. (2003) Lung cancer screening with helical computed tomography in older adult smokers, a decision and cost-effectiveness analysis. Journal of the American Medical Association 289: 313–322.
- Mandelblatt JS, Schechter CB, Yabroff KR, et al. (2005) Toward optimal screening strategies for older women, costs, benefits, and harms of breast cancer screening by age, biology, and health status. Journal of General Internal Medicine 20: 487–496.
- Manser R, Dalton A, Carter R, et al. (2004) Cost-effectiveness analysis of screening for lung cancer with low dose spiral CT (computed tomography) in the Australian setting. Lung Cancer 48: 171–185.
- Pignone M, Saha S, Hoerger T, et al. (2002) Cost-effectiveness analysis of colorectal cancer screening: a systematic review for the U.S. preventive services task force. Annals of Internal Medicine 137: 96–104.
- Polder JJ, Meerding WJ, Bonneux L, et al. (2005) A cross-national perspective on cost of illness: a comparison of studies from The Netherlands, Australia, Canada, Germany, United Kingdom, and Sweden. European Journal of Health Economics 6: 223–232.
- Riley GF, Potosky AL, Lubitz JD, et al. (1995) Medicare payments from diagnosis to death for elderly cancer patients by stage of diagnosis. Medical Care 33: 828–841.
- Brown ML, Riley GF, Schussler N, et al. (2002) Estimating health care costs related to cancer treatment from SEER-Medicare data. Medical Care 40(suppl.): IV-104–IV-117.
- Etizioni R, Riley GF, Ramsey SD, et al. (2002) Measuring costs, administrative claims data, clinical trials, and beyond. Medical Care 40(suppl): III-63–III-72.
- Frew E, Wolstenholme JL, and Whynes DK (2001) Willingness-to-pay for colorectal cancer screening. European Journal of Cancer 37: 1746–1751.
- Fryback DG and Craig BM (2004) Measuring economic outcomes of cancer. Journal of the National Cancer Institute Monographs 33: 134–141.
- Hayman JA, Langa KM, Kabeto MU, et al. (2001) Estimating the cost of informal care giving for elderly patients with cancer. Journal of Clinical Oncology 19: 3219–3225.
- Howard DH (2005) Life expectancy and the value of early detection. Journal of Health Economics 24: 891–906.
- Krahn MD, Mahoney JE, Eckman MH, et al. (1999) Screening for prostate cancer, a decision analytic view. Journal of the American Medical Association 272: 773–780.
- Koopmanschap MA, Touw KC, and Rutten FFH (2001) Analysis of costs and cost-effectiveness in multinational trials. Health Policy 58: 175–186.
- Oliva J, Lobo F, Lopez-Bastida J, et al. (2005) Indirect costs of cervical and breast cancers in Spain. European Journal of Health Economics 6: 309–313.
- Penberthy L, Retchin SM, McDonald MK, et al. (1999) Predictors of Medicare costs in elderly beneficiaries with breast, colorectal, lung, or prostate cancer. Health Care Management Review 2: 149–160.
- Steiner JF, Cavender TA, Main DS, et al. (2004) Assessing the impact of cancer on work outcomes, what are the research needs? Cancer 101: 1703–1711.
- Yabroff KR, Warren JL, Knopf K, et al. (2005) Estimating patient time costs associated with colorectal cancer care. Medical Care 43: 640–648.
- https://www.cancer.org/ – American Cancer Institute.
- https://healthcaredelivery.cancer.gov/seermedicare/ – National Cancer Institute, SEER-Medicare Linked Database.
- http://www.oecd.org/ – Organisation for Economic Co-operation and Development.
- https://www.who.int/en/ – World Health Organization.
More Cancer Research Paper Examples:
ORDER HIGH QUALITY CUSTOM PAPER

Always on-time

Plagiarism-Free

100% Confidentiality