
View sample visual processing in the primate brain research paper. Browse research paper examples for more inspiration. If you need a psychology research paper written according to all the academic standards, you can always turn to our experienced writers for help. This is how your paper can get an A! Feel free to contact our writing service for professional assistance. We offer high-quality assignments for reasonable rates.
The visual system is the most widely studied and perhaps the best understood mammalian sensory system. Not only have the details of its anatomical features been well described, but the behavior of its neurons have also been characterized at many stages of the neural pathway. For this reason, the visual system has also become the system of choice for the study of sensory coding and of such higher cognitive processes as memory and attention. In this research paper we focus on the visual system of nonhuman primates, because in the past 10–15 years it has been extensively studied and because nonhuman primates provide an excellent animal model for understanding human vision.
Academic Writing, Editing, Proofreading, And Problem Solving Services
Get 10% OFF with 24START discount code
The Retina
Our visual world is complex and dynamic. To successfully interpret this world the visual system performs the analysis of various attributes of the visual image and then integrates these attributes into a percept of a visual scene. The most fundamental characteristic of our visual world is that it is not uniform in time and space, and the visual system is well designed to analyze these nonuniformities. Such fundamental dimensionsofvisualstimuliasspatialandtemporalvariations in luminance and chromaticity are encoded at the level of the retina, whereas the encoding of other more complex stimulus features such as motion, complex forms, and depth emerge at the level of the visual cortex.
The Retinal Image
The retina is the sheet of neural tissue—some 0.3–0.4 mm thick (300–400 m) and about 520 mm2 in area—that lines the back portion of the eye where the image of light rays focused through the cornea and lens is formed. Because the eye is first and foremost an optical system, this image on the retina is measured in terms of visual angle, which is the angle formed by rays emanating from an object to their point of focus near the back surface of the lens (the so-called nodal point; for review, see Rodieck, 1998; Wandell, 1995). Rays diverging from the nodal point form the same angle as they impinge on the retina. Thus, the length and height of the retinal image formed by objects of different size and distance in the physical world will be the same if the visual angles formed by those objects are the same. These dimensions depend critically on the size of the eye. The macaque eye is roughly 67% of the size of the human eye, and the distance on the retina that corresponds to one degree of visual angle is therefore about 67% of that for the human retina—200 m versus 290 m (Drasdo & Fowler, 1974). Thus, how far eccentric an object on the retina is from the point of central fixation can be described using this simple conversion either by the angle in visual degrees that object makes with the fixation point or by its distance from this point in m (or mm). The point of central fixation on the retina corresponds to the fovea, an area about 1.5 mm (or 7°) in diameter, specialized for the best possible optical path and high acuity (discussed later in this research paper). Eccentricity on the retina is therefore measured with respect to the center point of the fovea. The conversion between linear distance and visual angle depends somewhat on eccentricity due to changes in the eye’s optics, especially for eccentricities greater than 50° or so (Drasdo & Fowler, 1974).
Retinal Design
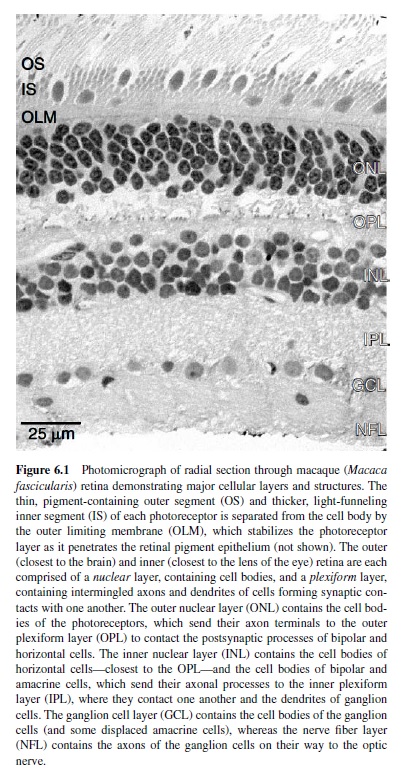
Because of its location in the eye, the retina is often misconstrued as a peripheral structure—more a part of the eye than of the brain. In fact, the retina is an extension of the central nervous system, much like the olfactory bulb. Like the rest of the brain, the retina comprises a great diversity of neuronal cell types (approximately 60–70) distributed across five classes of neuron within six primary layers (Figure 6.1). A tremendous degree of specialization for functional circuitry is therefore obtained by permuting these types in different combinations (reviewed in Masland & Raviola, 2000).
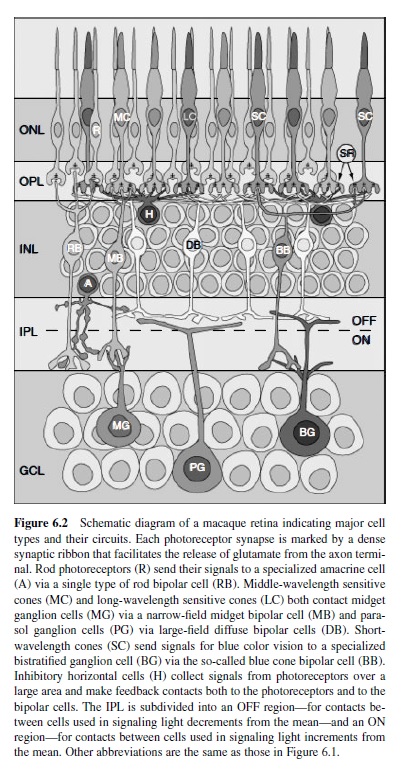
The basic architecture of the vertebrate retina includes (a) an array of photoreceptors (the input element) that transduces absorbed light into electrical activity and (b) an array of ganglion cells that encodes this activity as a train of action potentials carried along axonal fibers of the optic nerve. The macaque retina contains about 50 million photoreceptors that converge through layers of retinal circuitry upon some 1.5 million ganglion cells (Curcio, Packer, & Hendrickson, 1989; Rodieck, 1988). The output of the photoreceptor mosaic is carried to the ganglion cells via parallel and iterative circuits composed of serial connections between a variety of both excitatory and inhibitory interneurons (Figure 6.2). The activity of a ganglion cell at a particular moment in its physiological history is therefore the confluence of all excitation and inhibition in its presynaptic circuitry. Excitation in and from the retina is conveyed primarily through the so-called feed-forward circuit from photoreceptors to ganglion cells via a class of intermediate neurons called bipolar cells. In mammalian retina, this circuit is entirely glutamatergic—each element transmits information from its axon terminal to the next level of processing by the release of glutamate (Massey, 1990). Inhibition within the retina, in contrast, is conveyed primarily through two levels of so-called feedback circuits. In the outer retina,horizontal cellscollect excitation from a large number of photoreceptors (discussed later in this research paper) and provide inhibition proportionally back to the photoreceptors themselves and to the dendritic trees of bipolar cells (Dacey et al., 2000). This inhibition modulates the release of glutamate by the photoreceptor and its excitatory effect on bipolar cells. In the inner retina, amacrine cells collect more localized excitation from bipolar cells and provide inhibition back to the bipolar cell axon and to the dendritic trees of ganglion cells (Sterling, 1998). The role of inhibition in the retina is therefore to modulate the degree of excitation both at the release sites for glutamate and at its postsynaptic targets.
Certain fundamental properties of retinal cell populations have bearing on the organization of higher levels of visual processing. Cells within a type form a continuous mosaic that determines the spacing between cells and their sampling density (typically expressed as cells mm2 or as cells deg2) as a function of eccentricity. With increasing eccentricity, the density of the mosaics for most retinal neurons decreases (with some notable exceptions) as the spacing between neurons increases. For example, ganglion cell density peaks in the fovea at about 60,000 cells mm2 and falls to 10,000 cells mm2 at 20° and to 1,000 cells mm2 at 40° (Wässle, Grünert, Röhrenbeck, & Boycott, 1990). Cells within a particular mosaic cover the retina so that signals from each location in the photoreceptor mosaic are represented at least once within that mosaic; this implies that as the density of a particular cell type decreases with increasing eccentricity, the area covered by that cell’s processes (the so-called collecting aperture) becomes larger to accommodate the greater spacing between photoreceptors. For example, as the density of horizontal cells decreases from 20,000 cells mm2 in the fovea to 2,000 cells mm2 at 30° eccentricity, the area of the photoreceptor mosaic from which their processes collect increases by a factor of 25 (Wässle, Grünert, Röhrenbeck, & Boycott, 1989). Generally, the anatomical area covered by an individual retinal neuron increases at a rate greater than the rate of decrease in density of any retinal mosaic. This implies that the convergence of presynaptic neurons to a particular cell increases with increasing eccentricity (Calkins & Sterling, 1999). Consequently, in moving from the fovea to the periphery, both the spatial tuning of any single retinal neuron and the spatial resolution of that neuron’s mosaic decrease dramatically. From a functional perspective, this natural property of retinal cell types establishes the first limit for the well-known decrease in spatial resolution for psychophysical channels with increasing retinal eccentricity.
Retinal Cell Types
Each of the five classes of neurons in the retina is specialized for a broad function in encoding visual information, loosely delineated between excitation and inhibition. However, our visual world contains a diverse spectrum of spatial, temporal, andspectralvariations,spanningalargerangeofcontrastsand frequencies. The most efficient means to encode such diverse informationwiththehighestpossiblefidelityistopartitionthe task among different circuits, each specialized for serving a particular portion of the visual dynamic range (Sterling, 1998). To accommodate this need for specialization, each class of retinal neuron is comprised of several cell types, each type demonstrating a unique combination of morphology, connectivity, neurochemistry, and physiology (Masland & Raviola,2000).Itisthepreciseconnectivitybetweendifferent types that render each retinal circuit uniquely tuned to different aspects of visual information.
Photoreceptors
About 94% of the photoreceptors are rods, each sufficiently sensitive to signal the absorption of even a single photon at the absolute threshold of vision. Rods dominate the photoreceptor population over most of the retina, with a peak density of 170,000 rods mm2 at 15° eccentricity, which drops to 50,000–70,000 rods mm2 at 45°. The fovea contains a small region, about 150 m in diameter, that is rod-free, completely avascular, and devoid of all postphotoreceptor elements of the retina, which are displaced laterally to form the foveal wall. This region contains the highest density of cone photoreceptors, which comprise the remaining 6%; each is capable of operating at light levels eliciting as many as 10 million photon absorptions per cone each second. The cone density peaks at about 210,000 cones mm2 and drops precipitously to about 5000 cones mm2 at 20° (Curcio et al., 1989; Wässle et al., 1990). For both rods and cones, the lightfunneling inner segment of the photoreceptor increases in diameter the further it is from the fovea, with a fivefold increase for cones and a threefold increase for rods; thus, the collecting aperture of each photoreceptor increases with eccentricity as it does for other retinal neurons.
Light funneled through the photoreceptor inner segment enters the outer segment where—if it is absorbed by the lightsensitive photopigment—it elicits a biochemical cascade called phototransduction. The two classes of photoreceptors, rods and cones, show both similarities and differences in their response to light. In the dark, rods and cones are relatively depolarized to a resting potential of about 40 mV due to the net influx of positive ions through cyclic-G-gated channels in the outer segment (for review, see chapter 6 in Rodieck, 1998). When photons are absorbed, a G-protein coupled cascade is initiated that ultimately results in the closure of these ion channels, thus hyperpolarizing the photoreceptor. Despite these similarities, there are notable differences between this cascade for rods and cones that render several distinctions in their physiological responses to light. Key among these differences is the more rapid activity of an enzyme in the outer segment of the cone to maintain a steady concentration of cyclic-G. This enhanced activity is likely to underlie the faster response of the cone to light and its faster recovery; thus, the pathways collecting signals from cones will be faster than are those collecting from rods. Furthermore, unlike rods, cones will not saturate in bright lights, and they demonstrate different rates of adaptation to light (for review, see Baylor, Nunn, & Schnapf, 1987).
The proportion of cyclic-G-gated channels that close for a particular photoreceptor, and the amplitude of this hyperpolarization depends upon the rate of photon absorption. The number of photons funneled through the inner segment and the wavelength of these photons determines this rate; therefore, the key variable in phototransduction is the spectral sensitivity of the photopigment. Rods all contain a single photopigment called rhodopsin with a peak sensitivity near 500 nm. Cones, on the other hand, distribute into three types defined by differences in the photopigments they express. Cones sensitive to short (S) wavelengths contain a pigment that peaks in sensitivity around 430 nm, near the region of the spectrum where we perceive violet and blue. These cones comprise on average only about 5% of all cones (revie wed in Calkins, 2001). Cones sensitive to middle (M) wavelengths contain a pigment that peaks at 535 nm, near where we perceive green, and cones sensitive to long (L) wavelengths contain a pigment peaks at 567 nm, near where we perceive orange (Baylor et al., 1987). Together, M and L cones comprise the remaining fraction of cones and in macaque retinas are present in about equal numbers (Packer, Williams, & Bensinger, 1996).
The expression of different types of cones in the photoreceptor mosaic allows primates to discriminate surfaces based on differences in spectral reflectance. The difference between signals from M and L cones is fed to a mechanism underlying discrimination between red and green (red-green), whereas thedifferencebetweenSconesandthesummedsignalfromM and Lcones is fed to a mechanism providing the basis for discriminating blue from yellow (blue-yellow). The combined activity within the red-green and the blue-yellow channels ultimately provides the wide range of colors we experience (Wandell, 1995).
Horizontal Cells
In the dark, the relative depolarization of the photoreceptor— like depolarization in other neurons—promotes an influx of Ca2 ions into the axon terminal and a release of glutamate from the photoreceptor synapse. Retinal neurons—with the exception of ganglion cells—are unmyelinated and do not produce action potentials. Instead, voltage fluctuations are conveyed through the electrotonic spread of ions in grades of current flow. Thus, the release of glutamate from the photoreceptor synapse is correspondingly graded from its highest release rate in the dark to lower rates with increasing light absorption and hyperpolarization of the photoreceptor. Each cone photoreceptor is coupled electrically to its neighbors and to neighboring rods via small junctions of shared membrane of the axon terminal called gap junctions (Tsukamoto, Masarachia, Schein, & Sterling, 1992). These junctions are essentially electrical resistors and are thought to allow a limited degree of spread of current from one cone to another or from cone to rod (and vice versa). Gap junctions probably serve to average or electrotonically smooth the conjoint activity of the photoreceptor mosaic (Sterling, 1998). Therefore, the release of glutamate from a photoreceptor reflects mostly the rate of light absorption not only within its own outer segment, but also (to a lesser extent) the level of light activity in its neighbors.
Closest to the point of glutamate release from the photoreceptor synapse are the processes of horizontal cells (Figure 6.2), which are thought to collect excitation from the synapse and provide inhibitory (GABAergic; from gammaaminobutyric acid) feedback to the photoreceptor axon terminal (Sterling, Smith, Rao, & Vardi, 1995; Vardi, Kaufman, & Sterling, 1994; Vardi, Masarachia, & Sterling, 1992). This feedback is thought to drive the photoreceptor membrane potential towards its resting or dark value, thereby reducing the release of glutamate (Kamermans & Spekreijse, 1999). There are two types of horizontal cells in the primate retina, named simply “HI” and “HII” and generally designated as such (Wässle & Boycott, 1991). The HI cell has one arbor that collects from (and feeds back to) M and L cones, but not S cones, and a second arbor that is separated from the main arbor by a long axon-like process that contacts rods. The HII cell has a main arbor and a smaller arbor that both collect from all cone types but not from rods; therefore, the spectral sensitivity of both HI and HII cells is broadband (Dacey, 2000). Each horizontal cell collects from multiple photoreceptors. For example, the HI cell collects from some 15–25 cones in the fovea and from 10–15 further in the periphery as the spacing between cones increases (calculated from Wässle et al., 1989). However, HI cells couple electrotonically to one another via gap junctions, and HII cells are likewise interconnected. This connectivity produces a large network of horizontal cells that effectively enlarges laterally the photoreceptor input to any one cell. Consequently, the feedback to any single photoreceptor reflects not only its own activity, but also the average activity pooled across two independent networks of horizontal cells. Because of the intercell coupling between horizontal cells, the feedback is not only spatially but also temporally low-pass: The inhibition is broad and slow (V. C. Smith, Pokorny, Lee, & Dacey, 2001).
Bipolar Cells
The release of glutamate at the photoreceptor axon terminal fluctuates up and down from some baseline rate set by the average activity in the outer retina (for review, see Rodieck, 1998).These fluctuations constitute information, so ultimately both directions of change in glutamate release need to be encoded as excitation at the photoreceptor to bipolar cell synapse. Roughly half of the 10–12 types of bipolar cell respond with excitation (depolarization) to increments in local light activity (on cells), whereas the remainder responds to decrements in activity (off cells; Boycott & Hopkins, 1991). This division of labor is accomplished by a simple molecular trick at the bipolar cell dendritic tree. On bipolar cells express metabotropic glutamate receptors that gate cation channels with decreasing glutamate (i.e., increasing light), whereas off bipolar cells express ionotropic receptors that gate cation channels with increasing glutamate (decreasing light; Morigiwa & Vardi, 1999). In this way, only a single neurotransmitter (glutamate) is required to encode both increments and decrements from the average photoreceptor activity. The physiological division into on and off also correlates with a morphological division. On bipolar cells send long axons into the proximal half of the inner plexiform layer, closest to the ganglion cell layer, whereas off bipolar cells have shorter axons that stratify in the distal half of the inner plexiform layer (Boycott & Hopkins, 1991; also see Figure 6.2).
Rod Bipolar Cells. Each rod diverges to two to three representatives of a single type of on bipolar cell. Each of these so-called rod bipolar cells collects signals from 12–15 rods in the central retina, increasing gradually to 50–60 rods in the periphery (Grünert & Martin, 1991). At night, both the absolute level of light and the contrast from a reflective surface are far less. Thus, the retinal circuit for rod or scotopic vision—like the rod itself—is designed to transmit with the highest possible sensitivity. The convergence of so many rods to the rod bipolar cell increases this sensitivity so that the signal from the absorption of even a single photon of light is preserved and transmitted with great fidelity (Makous, 1990). We find it interesting that the collected excitatory signal from this pool of rods is conveyed indirectly to different types of ganglion cells via a specialized amacrine cell (the AII amacrine) that contacts both on and off bipolar cells (Strettoi, Dacheux, & Raviola, 1990). The functional significance of this divergence is not known, but it probably serves to send copies of the signal from rare photon events in the dark to the multiple types of ganglion cells.
Cone Bipolar Cells. Cones diverge to the remaining 9–11 types of bipolar cell. Each of thesetypes has a unique expressionofparticularsubunitsofglutamatereceptor(DeVries, 2000). This pattern bestows upon each type a unique physiology that in turn contributes to the particular spectral, spatial, and temporal properties of the ganglion cells to which they connect.Toafirstapproximation,foraparticularontypethere is an analogous off bipolar cell type. Because in the mammalian retina bipolar cells are likely to only use glutamate as their neurotransmitter (Massey, 1990), their response polarity (on or off) is conserved in the synapse to the ganglion cell. Thus, some 85–90% of the ganglion cells are either on or off, while the rest are both (Dacey & Lee, 1994; Watanabe & Rodieck, 1989). Most morphological types of ganglion cells therefore also distribute into separate on and off mosaics that respond, respectively, to light increments or light decrements (Famiglietti & Kolb, 1976). Cone bipolar cells distribute into two main categories, midget and diffuse, defined by differences in the morphology of their dendritic trees and the number of cones contacting them (for a review, see Boycott & Hopkins, 1997). These subsystems have distinct roles in early visual processing.
The primate retina is highly specialized for supporting the highest possible spatial acuity. In the fovea, discrimination of spatial patterns is limited in resolution only by the spacing of the cone photoreceptors (Williams, 1986). This corresponds to about 40 cycles deg1 spatially in the macaque monkey retina and at 60 cycles deg1 in the human retina (Samy & Hirsch, 1989).To support this acuity, each cone contacts a single on and a single off midget bipolar cell and—over most of the retina—each midget cell collects from only a single cone (Calkins & Sterling, 1999; see Figure 6.2). Far in the periphery, beyond about 45°, up to three to five cones may contact each midget bipolar cell (Wässle, Grünert, Martin, & Boycott, 1994). In contrast, each of the six or so types of diffuse bipolar cells (named simply DB1–DB6 for “diffuse bipolar”) collect from 8–12 cones over the entire retina, with cell types named DB1–DB3 providing off signals to the inner retina and the types named DB4–DB6 providing on signals (Boycott & Hopkins, 1991). We know very little about the separate mosaics and physiology of these diffuse cells. With so many cones converging on each, however, the diffuse system appears to have sacrificed spatial resolution for higher contrast sensitivity, and with higher sensitivity comes a sharper temporal response (DeVries, 2000). These differences between the midget and diffuse bipolar cells are apparent in the responses of ganglion cells to which they provide input (discussed in the next part of this research paper). Thus, the first segregation of functional pathways in vision occurs where the cone synapse diverges to different types of bipolar cell.
Ganglion Cells
Receptive Fields. The response of a particular retinal neuron to a given pattern of light impinging on the photoreceptor array depends on the distribution of spectral, spatial, and temporal energy within that pattern. The quality and degree of tuning to this energy depends upon the structure of the receptive field of the neuron—consisting of (a) an excitatory center arising from the photoreceptor to the bipolar cell to the ganglion cell circuitry and (b) an inhibitory surround arising from the lateral circuitry of horizontal and amacrine cells (reviewed in Sterling, 1998). A neuron responds, therefore, with increased activity to an appropriate stimulus imaged upon its receptive field center and with decreased activity when that same stimulus is imaged upon the surround.
The precise physiology of the center and surround for a particular retinal neuron depends on the circuitry providing its presynaptic input and on where that neuron is in the retinal hierarchy. For example, the center of the receptive field of a photoreceptor is formed primarily by that photoreceptor plus the excitation pooled from its neighbors via gap junctions (R. G. Smith & Sterling, 1990). On the other hand, the center for a bipolar cell is comprised of the contributions from overlying photoreceptors (Dacey et al., 2000). Similarly, the excitatory center of a ganglion cell arises from the convergence within the photoreceptor to the bipolar cell circuitry that contacts its dendritic tree, whereas much (but probably not all) of the inhibitory surround arises in the lateral connections from horizontal cells to photoreceptors (and bipolar cell dendrites; Freed, Smith, & Sterling, 1992; Vardi et al., 1994). Thus, spatially the center and surround are quantified in reference to the area of the photoreceptor mosaic contributing to each.
The response amplitudes of the center and surround are spatially nonuniform; each is roughly Gaussian in shape and depends upon the spatial distribution of the synaptic contributions from the cells contributing to each (Croner & Kaplan, 1995). Also, because of anatomical and physiological differences between the cells that comprise them, the center of the receptive field is spatially narrower, temporally quicker, and spectrally sharper (i.e., more wavelength dependent) than the surround is. The center also tends to be greater in amplitude than the surround is, generally by 35–40% for ganglion cells (Croner & Kaplan, 1995); thus, when a stimulus fills the entire receptive field, the center response dominates. In this sense, the surround can be considered as a spatial and temporal filter for subtracting the redundancy that inevitably is present in a typical natural scene, while the center conveys the signal for whatever spatial and temporal contrast remains. In other words, the surround essentially filters the background activity, and what is transmitted at the photoreceptor axon is the contrast or edge provided by modulation of light activity above or below this background.
Because each retinal neuron derives its input from overlying photoreceptors, most often the receptive field is quantified spatially with reference to the region of the photoreceptor mosaic that elicits a modulation of the cell’s activity. However, because stimuli are multidimensional, it is equally important to understand the spectral and temporal characteristics of the receptive field. Because receptive fields of retinal neurons are tuned to different types of information receptive field function as a filter, passing certain bandwidths of information while filtering out others. For example, the horizontal cell contribution to the surround is often referred to as a low-pass spatiotemporal filter because it is broad spatially, slow temporally, and therefore tuned to low spatial and temporal signals (Srinivasan, Laughlin, & Dubs, 1982).
Ganglion Cell Mosaics. Even though the fovea only comprises 1–2% of the retinal surface area, it contains more than 35% of all retinal ganglion cells (calculated from Wässle et al., 1989). Although the peak density of ganglion cells (about 60,000 cells mm2) is less than the peak cone density by more than a factor of three, the tight packing of cells within the fovea renders the effective sampling of the ganglion cell mosaic much higher, with three to four ganglion cells per cone (Wässle et al., 1989). This is sufficient to provide each cone access to several parallel ganglion cell circuits serving different visual functions; it also explains—at least in part— the expansion of the foveal representation in the primary visual cortex (V1; discussed later in this research paper). The functionality of these circuits correlates strongly with ganglion cell morphology, which in turn reflects the nature of its presynaptic inputs. The number of these types depends critically upon species. For the primate retina, the number is probably 15–20, each with a distinct pattern of presynaptic input, physiology, and central projection into the thalamus (Leventhal, Rodieck, & Dreher, 1981; Rodieck & Watanabe, 1993). The circuits for most of these and their role in visual information processing are unknown. Nevertheless, there are a few circuits in the primate retina about whose function we can say a great deal, although it is probably imprudent to call them solved. These divide broadly first into on and off, following the pairing of on and off bipolar cell types, and this is reflected by the level of stratification of the ganglion cell dendritic tree in the inner retina (see Figure 6.2; Dacey & Lee, 1994). These circuits also divide broadly according to whether the bipolar cell input is midget or diffuse; this determines the spatiotemporal and spectral responses of the ganglion cell.
What the cortex ultimately reads as retinal output are spectral, spatial, and temporal signals filtered through the receptive fields of individual ganglion cells. Because the filter properties of ganglion cells are determined by their presynaptic circuitry, this circuitry determines what specific types of visual information are filtered at the first stage of visual processing.
Midget or P Ganglion Cells. Midget bipolar cells collect from a single cone over most of the retina, and each cone diverges to a single on and single off midget bipolar cell (Wässle et al., 1994). In and around the fovea, each on and off midget bipolar cell contacts a single on or off midget ganglion cell, and no midget ganglion cell collects from more than one midget bipolar cell (Calkins & Sterling, 1999). In this way, the greatest possible spatial resolution—that of a single cone—is afforded to the receptive field center of the midget pathway for both light increments and decrements. Midget ganglion cells comprise about 80% of the ganglion cells in the foveal region (Perry, Oehler, & Cowey, 1984), so the expansion of the foveal representation in V1 is in large part due to the presence of the midget system (Wässle et al., 1989). Outside the fovea, as the optics of the eye worsen and the spacing between cones increases (Hirsch, 1984), the dendritic tree of the midget ganglion cell expands considerably, and each cell collects from increasing numbers of midget bipolar cells and cones (Calkins & Sterling, 1999). Even so, these ganglion cells remain the smallest and most numerous, with the least convergence of cones.
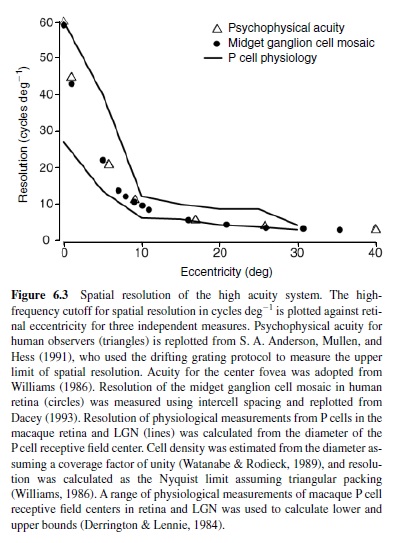
Midget ganglion cells provide the dominant retinal input to the parvocellular region of the lateral geniculate nucleus (LGN; discussed later in this research paper). For this reason, midget cells are often referred to as P cells, as are the parvocellular relay neurons to which they connect. For the most part, the physiological properties of P cells in the LGN mimic those of the midget/P cell in the retina. Thus, the LGN P cell also demonstrates a small receptive field center that corresponds to the small dendritic tree of the midget ganglion cell. In fact, despite inevitable variation between different sets of experiments, the physiological measurements of the spatial extent of the P cell center match very well the anatomical convergence of cones to the midget ganglion cell across retinal eccentricities (Figure 6.3). Thus, for this circuit, the anatomy reasonably predicts the spatial properties of the receptive field center.
Over the entire retina, the receptive field center of the midget cell is the most narrow of all ganglion cell receptive fields and the sampling density of the midget cell mosaic establishes the limit of spatial acuity (Croner & Kaplan, 1995; Dacey, 1993). However, because the convergence of cones to the midget cell is minimal, its spatial contrast sensitivity is relatively poor (Croner & Kaplan, 1995). For reasons we do not yet understand—but no doubt arising in part from the small number of cones converging upon it—the midget ganglion cell is also temporally sluggish and responds to light in a sustained fashion. Thus, the spatiotemporal contrast sensitivity of the midget cell is distributed across high spatial but lower temporal frequencies (see Figure 6.5 later in this research paper for the equivalent properties in the LGN).
The mosaic of M and L cones in the primate retina is patchy, with cones of like type distributing into small clusters. Because each midget ganglion cell collects from only a single cone in and near the fovea, their excitatory connections are by definition finely tuned spectrally, conferring upon the midget cell high chromatic contrast sensitivity. As the number of cones increases, some cells remain finely tuned to M and L cone modulation (Martin, Lee, White, Solomon, & Ruttiger, 2001), while others begin to respond preferentially to luminance (M + L) modulation. Whether the cortex uses whatever chromatic sensitivity is present in the midget mosaic as the basis for red-green color discrimination across the retina is a matter of debate (Calkins & Sterling, 1999). What is undeniable is that midget cells—because of their fine spatial apertures (discussed previously)—are highly specialized and probably evolved primarily as a system to support foveal acuity limited only by the spacing of the cones.
Parasol or M Ganglion Cells. Like the midget ganglion cell, the parasol ganglion cell comes in both on and off types, both of which have a broad, circularly symmetric dendritic tree that resembles a parasol one might carry to keep the rain off. At a given retinal eccentricity, the area covered by the dendritic tree of the parasol cell is some 20 times the area covered by a midget cell (Watanabe & Rodieck, 1989), and the parasolmosaicisaccordinglysparser,comprisingsome5–8% of all ganglion cells (Grünert, Greferath, Boycott, & Wässle, 1993).As a consequence of its size, the convergence of cones to the parasol cell is also a factor of 20 greater. For example, in the fovea, the parasol cell collects from 20–25 cones via four to five diffuse bipolar cells (Calkins, 1999). Physiologically, this contributes to a broader receptive field center with higher contrast sensitivity, about six times greater on average thanthatofthemidgetganglioncell(Croner&Kaplan,1995). It is likely that the nature of its bipolar cell input, diffuse versus midget, also contributes to its characteristic transient response to light—the response fades for stationary stimuli and is optimal for stimuli moving across the photoreceptor mosaic (Kaplan et al., 1990; Kaplan, Purpura, & Shapley, 1988; Kaplan & Shapley, 1986).Thus, the parasol cell responds best to lower spatial frequencies, higher temporal frequencies, and differences in retinal luminance. In terms of their projections to the brain, parasol ganglion cells provide the dominant retinal input to the magnocellular region of the LGN (Perry et al., 1984). Thus, they are generally called M cells. Like their retinal counterparts, M cells in the LGN have a receptive field center that is much broader than that of Pcells, corresponding to the larger dendritic tree of the parasol ganglion cell. Some evidence also suggests that some parasol cells may send axon collaterals to the superior colliculus (for review, see Rodieck & Watanabe, 1993).
The retinal image is constantly in motion, due to small eye movements (for review, see Rodieck, 1998). Superposed upon this inherent movement is the actual translation of objects in a natural scene, or stimulus motion. This movement of stimuli across the photoreceptor mosaic at once blurs the spatial information contained in those stimuli while introducing light contrast at higher temporal frequencies. Some mammalian retinas (e.g., rabbit retinas; see Vaney, 1994; Vaney, Peichl, & Boycott, 1981) have ganglion cells tuned to specific directions of moving stimuli. The primate retina (to our knowledge) does not have this type of directional selectivity. However, what ultimately becomes a motion signal higher in the cortical streams is likely to originate at least in part from the transient responses propagating through the mosaic of the parasol cells as a stimulus moves across the photoreceptor array.
Other Ganglion Cells and Their Circuits. The primary ganglion cell input to the LGN, in terms of numbers of cells, is provided jointly by the midget (P) and parasol (M) mosaics (Perry et al., 1984). Nevertheless, it is incorrect to associate only retinal midget cells with the parvocellular LGN and only parasol cells with the magnocellular LGN. Despite the convenience of this simplification, it remains just that—a simplification. Retrograde labeling of ganglion cells following injections of markers into the LGN reveal a diverse array of more sparsely populating ganglion cells, each with a unique morphology and (presumably) retinal circuitry (Rodieck & Watanabe,1993).Although we know little about the function of these cells, we now appreciate that some of them are likely to project not to the primary Pand Mlayers of the LGN, butrather to the intercalated or koniocellular layers in between (discussed later in this research paper). One of these is the small bistratified ganglion cell that is implicated in color vision used to discriminate blues from yellows. The receptive field of this cell is such that signals from S cones oppose those from Mand L cones in anantagonistic fashion.This antagonism isspatially overlapping, so the small bistratified cell is tuned sharply to spectral (chromatic) differences and very little to spatial edges (Calkins, Tsukamoto,&Sterling,1998;Dacey,1996).
What the Retina Responds To
In laying out a basic understanding of the retina, it is important to point out that there is a difference between a perceptual attribute and the physical stimulus that elicited it; the latter has very much to do with the retina, which interfaces the brain with the external visual world, whereas the former is something more ambiguous—ascribed to the stimulus by a host of (we presume) physiological interactions working in concert through higher visual areas of the brain. The former has to fit into our internal representation of the visual world that is built upon an earlier, more rudimentary representation in the output of the retina. For example, color is an attribute of the internal representation of a surface that arises from the retinal representation of the spectral reflectance of that surface. Similarly, motion is an attribute our internal representation provides for the displacement of an object in space and time that arises from local differences in the activity of ganglion cells as the image of that object steps across the retinal array. Motion is—in simple terms—something that is computed by the cortex based on changes in retinal firing patterns in response to the changing image upon the photoreceptor array.Certainganglion cells in the primate retina may indeed respond favorably to a moving stimulus, but this does not imply that motion is encoded within the retina—the stage for what will become the perceptionofmotionismerelysetintheretina.Othercellswill respond to a stimulus that to the human observer appears colored, but color is not itself assigned by retinal activity; thus, the complexity of the retinal wiring has less to do with perception and more to do with encoding the critical events that the cortex interprets as vision.
It is also critical to emphasize that although each of the circuits shown in Figure 6.2 underlies tuning of ganglion cell receptive fields for particular spatial, temporal, or spectral frequencies, most types of ganglion cells respond in some measure to more than one attribute of a visual stimulus. For example,amidgetganglioncellwillrespondtoalightmoving across its receptive field, provided that movement is within the temporal sensitivity profile of the receptive field (see Figure 6.5 later in this research paper). Also, a parasol cell will respond to a fine spatial pattern, even though its broad receptive field is not necessarily specialized to convey the highest frequencies within that pattern. The point is that what we ultimately experience as vision arises from the confluence of activity across the mosaic of each type of ganglion cell, and rarely is any one type completely silent in that mass contribution.
Parallel Visual Pathways From the Retina
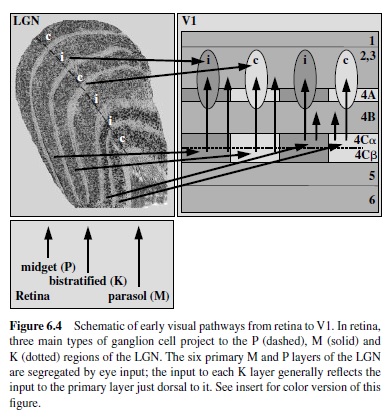
Visual pathways comprise a massive sensory component that involves about 90% of the retinal ganglion cells, those that project into the LGN of the thalamus and from there to the primary visual cortex (Figure 6.4; Hendrickson, Wilson, & Ogren, 1978; Rodieck & Watanabe, 1993). Another component involves the remaining 10% or so, mostly large ganglion cells that sample the photoreceptor mosaic more sparsely than do the major types involved in acquiring sensory information (Rodieck & Watanabe, 1993). Relatively little is known about the circuitry and receptive fields of these ganglion cells in primates. Most involve complex dendritic trees that integrate both on and off information about light contrast, and their central projections are similar to those of other mammalian species. No fewer than nine subcortical nuclei are distributed within six major regions that provide recipient zones for axon collaterals leaving the retina (reviewed in Leventhal et al., 1981; also see Rodieck & Watanabe, 1993). Some of these ganglion cells may send collaterals to multiple nuclei, many of which provide projections back to the muscles of the eye for a variety of functions, including the coordination of eye movements and the setting of the circadian rhythm that contributes to the modulation of retinal physiology. In this section we focus on the retino-geniculate-cortical pathway. For comprehensive information concerning areas outside this pathway, the reader is referred to more specialized reviews (Kaas & Huerta, 1988; Rodieck, 1979; Rodieck, 1998).
Lateral Geniculate Nucleus (Lgn)
Anatomy
The LGN is about the size and shape of large peanut, situated in the posterior-most quarter of the thalamus. The LGN on each side of the thalamus receives input about the contralateral visual hemifield from the retina of both eyes, ipsilaterally from the temporal retina and contralaterally from the nasal retina (for general overview, seeWurtz & Kandel, 2000).This input is anatomically segregated into six primary layers, each about 500 m thick, with Layers 1, 4, and 6 (numbered ventral to dorsal) receiving contralateral input and Layers 2, 3, and 5 receiving (Spear, Kim, Ahmad, & Tom, 1996) ipsilateral input. The number of LGN neurons that receive retinal input and project to striate cortex is 1.0–1.5 million (Blasco, Avendano, & Cavada, 1999; Hendry & Reid, 2000), about the same number of retinal ganglion cells that project to the LGN. Thus, a 1:1 relationship between retinal ganglion cell and LGN relay neuron is usually presumed, although this is difficult to assess due to large variability in the numbers of ganglion cells and LGN cells between animals (Spear et al., 1996). Layers 1–2 comprise the ventral one third of the LGN and contain about 10% of the cortical-projecting neurons to striate cortex. Because the bodies of these neurons are large, Layers 1–2 are called magnocellular (or simply M). In contrast, Layers 3–6 comprise the dorsal two thirds of the LGN and contain about 80% of the LGN relay neurons. The bodies of these neurons are small by comparison, and Layers 3–6 are termed parvocellular (or P). The remaining 10% of the LGN relay neurons distribute nonuniformly, mostly within the intercalated layers sandwiched just ventral to each of the six primary M and P layers but also within small clusters within the primary layers. These cells can be visualized by neurochemical means (Hendry & Yoshioka, 1994) and are termed koniocellular (or K) because of their small size (Casagrande & Kaas, 1994; Hendry & Reid, 2000).
The relative number of M, P, and K cells in the LGN reflects the nature of their retinal inputs. The population of P cells is the most numerous because most of these receive input from a midget ganglion cell, whereas the population of M cells is more sparse because many (but probably not all) receive input from a parasol ganglion cell (Perry et al., 1984). The small number of K cells, probably 3–5% (Calkins & Sterling, 1999), receives input from the small bistratified ganglion cell (Martin, White, Goodchild, Wilder, & Sefton, 1997). Other types of ganglion cell project to each of the M, P, and K populations, each with a unique morphology and presynaptic circuitry (Rodieck & Watanabe, 1993).
Functional Properties
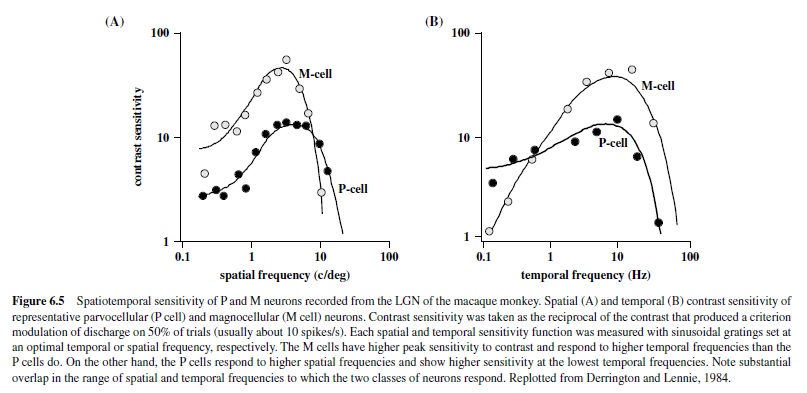
The receptive fields of LGN neurons have center-surround organization reflecting the characteristics of the ganglion receptive fields providing its input (Hubel, 1960; Kaplan et al., 1990). Thus, neurons in the magnocellular layers of the LGN differ from those in the parvocellular layers; the neurons in the magnocellular layers have faster conduction velocities, greater luminance contrast sensitivity, and greater contrast gain control (Derrington & Lennie, 1984). Furthermore, the parvocellular neurons show high spatial resolution, prefer lower temporal frequencies (Derrington & Lennie, 1984; Levitt, Schumer, Sherman, Spear, & Movshon, 2001), and have concentric color-opponent receptive fields, whereas the magnocellular neurons respond better to higher temporal and lower spatial frequencies, and their responses are spectrally broadband and not affected by chromatic stimulus modulations (Derrington, Krauskopf, & Lennie, 1984; Schiller & Colby, 1983; Schiller & Malpeli, 1978; Wiesel & Hubel, 1966). Thus, the main distinguishing characteristics between these neurons are chromatic opponency and differences in the spatiotemporal range of response properties (Figure 6.5). It should be pointed out that there is a large degree of overlap in spatiotemporal properties of the two subdivisions of the LGN, and under many conditions the two classes of neurons give very similar responses to the same stimuli (Levitt et al., 2001; Spear, Moore, Kim, & Xue, 1994).
For years, similarities between the properties of retinal and LGN receptive fields have been used to categorize LGN as a passive relay station for signals on their way to cortex. However, recent physiological studies suggest that LGN is not a simple,passiverelay of information to cortex but instead is involved in many dynamic processes that could affect the nature of the information relayed to cortex (Sherman & Guillery, 1996). They showed that LGN and other thalamic relay neurons exhibit two response modes: tonic and burst (Sherman, 1996). Basing his ideas on the properties of the two response modes, Sherman proposed that the burst mode is better suited for stimulus detection, whereas the tonic mode is suited for faithful transmission of visual stimuli (Sherman, 2001). He also proposed that the mechanism for switching between the two modes is under the control of afferents from the visual cortex, the brain stem, or both, and that the LGN contains the necessary intrinsic circuitry to accomplish this switch. This circuitry consists of a large number of inhibitory interneurons (Wilson, 1993), excitatory inputs from Layer 6 of striate cortex (Casagrande & Kaas, 1994), as well as inputs from the parabrachial region of the brain stem and the thalamic reticular nucleus (Erisir, Van Horn, & Sherman, 1997). This organization allows LGN to play a more active role in transmitting and gating the information reaching the visual cortex.
Effects of Selective Lesions
Effects of lesions restricted to the Por M layers in the LGN reflect the spatiotemporal properties of the affected regions. For example, lesions restricted to the magnocellular zone produce dramatic deficits in luminance contrast sensitivity for higher temporal and lower spatial frequencies (Merigan, Byrne, & Maunsell, 1991; Schiller, Logothetis, & Charles, 1990) measured with flickering or moving gratings (Figure 6.6) but do not produce any loss in sensitivity for chromatic stimuli (Merigan, Byrne, et al., 1991; Merigan & Maunsell, 1990) or for luminance contrast sensitivity when measured with stationary stimuli (see Figure 6.6). These results correlate with the physiological studies of individual parasol cells in the retina and M cells in the LGN that show high contrast sensitivity for high temporal and low spatial frequencies. AlthoughtheeffectsofMlesionsdidnotappeartohaveaspecific effect on motion perception (Merigan, Byrne, et al., 1991), the spatiotemporal characteristics of the deficit support a role for the magnocellular pathway in feeding signals to cortical streams for motion processing (Merigan & Maunsell, 1993).
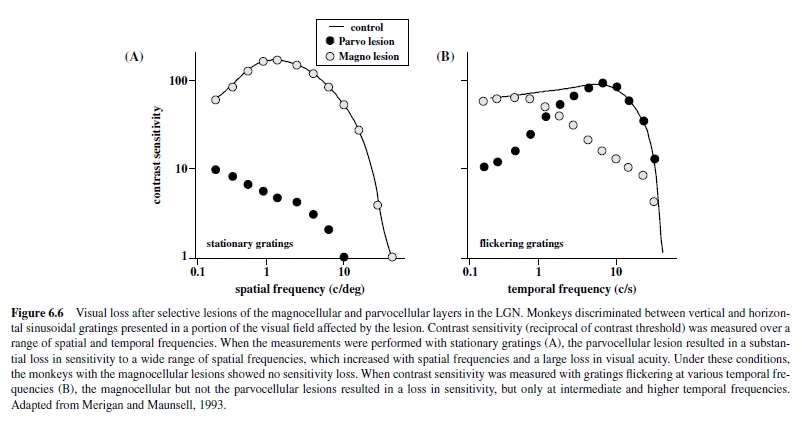
In contrast, selective lesions of the parvocellular zone produce a fourfold decrease in visual acuity, cutting off sensitivity to higher spatial frequencies (Merigan, Katz, & Maunsell, 1991). Furthermore, the parvocellular lesion also results in a dramatic loss of both red-green and blue-yellow chromatic sensitivity (Merigan, 1989; Schiller et al., 1990) confirming the unique role of parvocellular neurons in carrying chromatic signals to cortex. However, one must keep in mind that the lesions included the population of K cells embedded within the dorsal two thirds of the LGN, some of which are likely to receive inputs from the small bistratified ganglion cell implicated in processing of blue-yellow signals (Calkins & Sterling, 1999). The loss of these neurons could have contributed to the profound loss of chromatic contrast sensitivity reported by Merigan (1989).
Cortical Processing
The information provided by the three major types of ganglion cells arrives in the visual cortex largely segregated. The functionally distinct magnocellular and parvocellular fibers from the LGN project to different sublamina of Layer 4 in striate cortex and this anatomical segregation of processing of different aspects of visual information continues to a greater or lesser extent throughout the visual cortex. Neocortex contains at least 32 distinct areas identified as areas involved in processing of visual information (Felleman & Van Essen, 1991). A subset of these areas and a simplified diagram of major visual cortical pathways are shown in Figure 6.7.
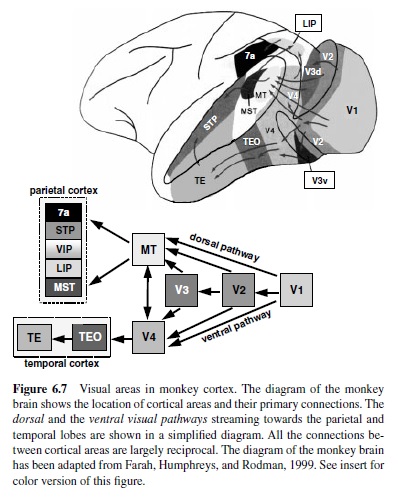
The information about visual motion and spatial location generated at the earliest stages of cortical processing is directed for further elaboration into the dorsal visual stream, whereas shape, color, and texture information flow into the ventral visual stream. The two visual pathways originate in segregated subregions of primary visual cortex (V1) and continue to be largely distinct at the next stage of processing, in Area V2, until they separate into the pathway streaming dorsally toward the parietal cortex and the pathway streaming ventrally towards the temporal lobe. The former has been termed the motion or where pathway; the latter is called the color and form or what pathway (Ungerleider & Mishkin, 1982). In the following discussion we outline the functional organization and properties of the most important and best understood components of the two pathways.
Primary Visual Cortex (Striate Cortex; V1)
Anatomy
The first stage of cortical processing of visual signals takes placeintheareacalledV1 alsocalledstriatecortex becauseof the prominent stripe of white matter (stria Gennari or the line of Gennari) running through Layer 4. It is a large region that in the macaque monkey occupies an area of 1,200 mm2 in the occipital lobe or about 12% of entire neocortex (Felleman &Van Essen, 1991). The three types of inputs from the LGN to V1 (parvocellular, magnocellular, and koniocellular) terminate in separate subdivisions within Layer 4 (see Figure 6.4). The magnocellular and parvocellular fibers project to separate sublamina within Layer 4C, Layers 4C and 4C respectively (Blasdel & Lund, 1983; Hendrickson et al., 1978), thus maintaining their anatomical segregation. The koniocellular neurons from the intercalated laminae in the LGN terminate in Layers 2/3 in regions with characteristic pattern of labeling for enzyme cytochrome oxydase, termed blobs (Horton, 1984; Livingstone & Hubel, 1984), as well as in Layer 1 (Hendry & Reid, 2000).
Most of V1 output is directed to the adjacent area, V2 (Livingstone & Hubel, 1983; Rockland & Pandya, 1979), although it also sends direct projections to MT (the middle temporal area; Boyd & Casagrande, 1999; Maunsell & Van Essen, 1983a), an area specialized for processing visual motion (discussed later in this research paper). V1 sends projections back to the LGN, to the pulvinar (a visual thalamic region implicated in control of attention), and to the superior colliculus (Casagrande & Kaas, 1994; Ungerleider, Galkin, & Mishkin, 1983). In addition, V1 maintains connections with a wide range of other cortical and subcortical regions (Kennedy & Bullier, 1985).
Functional Properties
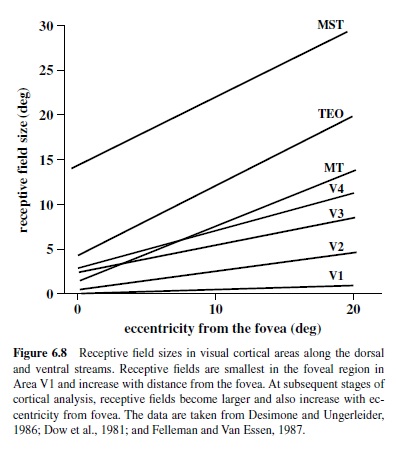
V1 contains a retinotopic representation of the entire contralateral visual field with a disproportionately large number of neurons devoted to processing of information provided by the foveal region of the retina (Azzopardi & Cowey, 1993; Dow, Snyder, Vautin, & Bauer, 1981). Thus, six to nine cones located near the fovea are represented by 1 mm of cortex, whereas the same number of cones located 20° from the fovea are represented by a region of cortex that is about five times smaller (Dow et al., 1981; Van Essen, Newsome, & Maunsell, 1984). This expansion of the foveal representation, referred to as cortical magnification, is characteristic of many cortical visual areas and indicates allocation of additional neural circuitry for processing of information in the central portion of the visual field. This magnification may in part be a reflection of the great number of ganglion cells serving foveal cones (Wässle et al., 1989).
Receptive fields in V1 representing the fovea are quite small and increase with eccentricity in a manner that is roughlyinverselyproportionaltocorticalmagnification(Dow et al., 1981; Hawken & Parker, 1991). Thus, foveal receptive fields can be as small as 1–2 min of arc, about the diameter of a single cone, and as large as 60 min of arc at 20° eccentricity (Figure 6.8).
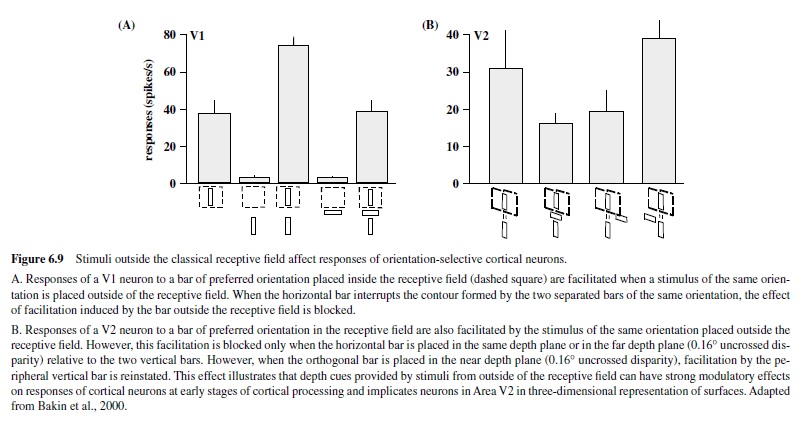
Although the size of a cortical receptive field has always been considered one of its most stable features, recent studies have revealed that it can be modulated by some properties of its optimal stimulus (e.g., contrast), as well as by the visual and behavioral context in which this stimulus is presented (e.g., Bakin, Nakayama, & Gilbert, 2000; Ito & Gilbert, 1999; Sceniak, Ringach, Hawken, & Shapley, 1999; Figure 6.9). Such effects demonstrate the dynamic nature of cortical neurons, a phenomenon most likely mediated by the feedback projections arriving in V1 from subsequent levels of cortical analysis (Ito & Gilbert, 1999).
A number of features not seen in the preceding stages of analysis emerge in striate cortex. These features include selectivity for stimulus orientation, size, depth, and the direction of stimulus motion; they represent the first stage of processing leading to the perception of form and motion.
Sensitivity to Contrast and Spatiotemporal Filtering
One of the fundamental properties of retinal ganglion cells is center-surround organization, a feature that allows the detection of variations in luminance or chromatic contrast across space. Neurons in the magnocellular pathway are exquisitely sensitive and show reliable responses to contrasts as low as 1%, whereas parvocellular neurons require higher contrasts (Derrington & Lennie, 1984; see Figure 6.5). These properties are reflected in the cortical layers receiving inputs from the two pathways, with neurons in 4C receiving inputs from the magnocelluar neurons showing higher sensitivity to contrast than neurons in 4C. This segregation of regions of low and high sensitivity to contrast is also present in neurons located in more superficial layers, projecting outside of striate cortex. Thus, although most neurons in Layers 2/3 have relatively low contrast sensitivity, there is a small population of cells clustering near the centers of the blobs (discussed later in this research paper) with high contrast sensitivity, reminiscent of magnocellular LGN neurons (Edwards, Purpura, & Kaplan, 1995).These cells are likely to receive inputs from the K cells, which have been shown to have contrast sensitivity close to that of M cells (Xu et al., 2000). This larger dynamic range in the population of neurons within the blobs suggests that these regions are well equipped for signaling stimulus contrast.
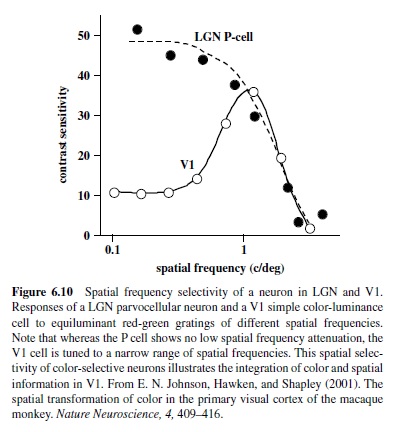
Measurements of contrast response are usually performed with drifting or flickering sinusoidal gratings presented at spatial and temporal frequencies that are optimal for a given neuron. Careful selection of spatial and temporal stimulus parameters is necessary because visual neurons in the cortex respond to a limited range of spatial and temporal frequencies—that is, they behave like spatiotemporal filters. With respect to the spatial parameters, V1 neurons show sharp attenuation at both low and high frequencies (see Figure 6.10; De Valois,Albrecht, & Thorell, 1982)—unlike LGN neurons, which show high-frequency cutoff but more modest attenuation at low frequencies (Derrington & Lennie, 1984).
There is a correlation between the eccentricity, optimal spatial frequency, high frequency cutoff, and size of the receptive field of a given neuron. For example, an increase in eccentricity that results in a twofold increase in receptive field size is accompanied by a twofold decrease in the optimal spatial frequency (Foster, Gaska, Nagler, & Pollen, 1985). However, not all regions in V1 have similar spatial tuning at a given eccentricity. For instance, neurons in the blobs appear to be tuned to low spatial frequencies, and the optimal spatial frequency increases with distance from the blob (Born &Tootell, 1991; Edwards et al., 1995). Preferences for lower spatial frequencies have also been found in the subregions containing the majority of directionally selective neurons, upper Layer 4 and Layer 6 (Hawken, Parker, & Lund, 1988). These neurons also show high sensitivity to contrast, a property characteristic of directionally selective neurons in MT (Sclar, Maunsell, & Lennie, 1990), the region that receives direct inputs from V1 (Hawken et al., 1988).
With respect to temporal characteristics, cortical neurons are similar to neurons encountered in the retina and the LGN and show broad tuning to temporal frequencies. However, whereas LGN neurons show preferences for relatively high frequencies of temporal modulation, 10–20 Hz (Hicks, Lee, & Vidyasagar, 1983), cortical cells respond better to lower temporal modulations (3–8 Hz), showing little attenuation at low temporal frequencies (Foster et al., 1985).
Binocular Interactions
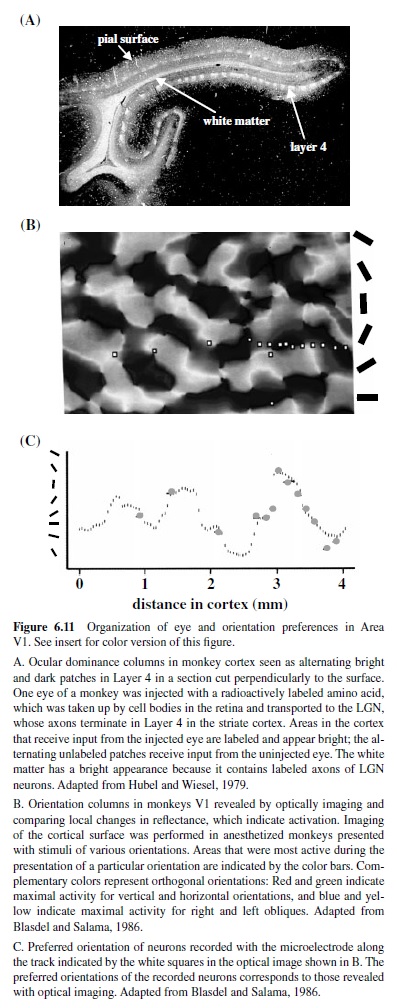
Information from the two eyes—segregated into separate layers in the LGN—remains segregated upon their arrival in Layer 4C of striate cortex (Hubel & Wiesel, 1977). At this stage of cortical processing, the signals from the two eyes are processed separately, and the neurons are grouped according to their eye of origin. These groupings, termed oculodominance columns (Figure 6.11), are most prominent in Layer 4C, but can be visualized as alternating bands across the entire thickness of cortex, becoming less apparent in layers above and below because of the intermixing of inputs from the two eyes. The amount of cortex devoted to processing the information from each eye is nearly equal for the central 20° of the visual field, and the width of the alternating columns representing each eye is about 0.5 mm. The representation of the ipsilateral eye declines at greater eccentricity and eventually disappears—only the contralateral eye is represented (LeVay, Connolly, Houde, & Van Essen, 1985). The intermixing of the inputs from the two eyes in layers above and below Layer 4 is reflected in the properties of neurons in these regions, many of which respond best when both eyes are stimulated. Furthermore, many of these neurons are sensitive to the absolute retinal disparity or the difference in the position of a single stimulus in the two eyes (Cumming & Parker, 1999; Livingstone & Tsao, 1999; Poggio, Gonzalez, & Krause, 1988), an early stage of processing that leads to stereoscopic depth perception (Cumming & Parker, 2000).
Orientation Selectivity
Neurons in the input layers of striate cortex retain a concentric center-surround organization similar to that observed in the retina and LGN, whereas in other layers receptive fields (A) become elongated and the neurons display selectivity for the orientation of the stimulus. Among orientation-selective neurons, a subset of cells termed simple cells have receptive fields consisting of distinct excitatory and inhibitory subregions, whereas receptive fields of complex cells contain excitatory and inhibitory subregions that are intermixed (Hubel & Wiesel, 1968). Some orientation selective neurons, termed hypercomplex cells (or special complex cells) are also sensitive to the length of the optimally oriented stimuli and show inhibition if the bar extends outside its receptive field (Hubel & Wiesel, 1977).
This inhibition—produced by the stimulus extending outside the classical receptive field—is not the only indication of active processes in the area surrounding the classical receptive field. A number of recent studies have shown that responses to stimuli placed in the receptive field are strongly modulated by the context in which this stimulus is presented. Most of these studiesusedorientedpatternscenteredontheclassicalreceptive field surrounded by a large texture and found inhibitory or excitatory effects of the surrounding texture dependent on whether the elements in the surround matched the properties of the elements in the center (Knierim & Van Essen, 1992; Nothdurft, Gallant, & Van Essen, 1999). In some cases, these influences were produced only by texture boundaries located close to the borders of the receptive field, suggesting a role for V1 neurons in the detection of texture boundaries but arguing against the contribution of these neurons to the process of figure-ground segregation (Rossi, Desimone, & Ungerleider, 2001). Because this contextual modulation often emerges a relatively long time after the stimulus onset, it is likely to be the product of the influences of subsequent stages of cortical processing sending feedback projections to V1 (Nothdurft et al., 1999). These observations suggest that the mechanisms underlying texture segmentation and possibly figure-ground segregation may already be in place at a very early stage of cortical processing.
As for neurons with similar eye preferences, neurons with similar orientation preferences cluster into narrow columns extending perpendicularly from the cortical surface to the white matter (Hubel & Wiesel, 1977). Each column is about 30–100 m wide and 2 mm deep. Neurons in these columns respond not only to the same orientation, but also to stimulation of the same portion of the visual field. Along the cortical surface all axes of orientations are represented, and the points where neurons with different orientations meet form a characteristic pinwheel pattern (Obermayer & Blasdel, 1993; Figure 6.11). On average, a region of 1 mm2 on the surface of cortex contains all orientation preferences for a given point of visual space. This periodic pattern of orientation columns is interrupted by the cytochrome oxydase blob regions prominent in Layers 2/3 which contain cells that are not orientation selective and show some selectivity for color and respond to low spatial frequencies (Edwards et al., 1995; Livingstone & Hubel, 1984).
Together, columns representing each eye, orientation columns, and the blobs for a given portion of the visual field form a unit termed a hypercolumn (Hubel & Wiesel, 1977); each hypercolumn occupies 1 mm2 of striate cortex. There is evidence that many columns and blobs with similar preferences are linked by long horizontal connections, although there are also connections that would allow for the interactions between the compartments with different preferences (Yoshioka, Blasdel, Levitt, & Lund, 1996). These horizontal connections between individual compartments are believed to play a role in the integration of information over many millimeters of cortex (Gilbert, Ito, Kapadia, &Westheimer, 2000).
Direction Selectivity
A feature emerging in V1 that has major implications for the ability to see object movement is selectivity for the direction of stimulus motion (Hubel & Wiesel, 1968). Directionally selective neurons fire vigorously to one direction of motion of an optimally oriented bar or grating and fire less or not at all when the same bar moves in the opposite direction. In the monkey, directionally selective neurons are present predominantly in Layer 4C and Layer 4B, which sends projections to MT (Hawken et al., 1988). Like the magnocellular neurons in the LGN (Derrington & Lennie, 1984), these neurons are sensitive to low contrasts and have relatively poor spatial resolution (Hawken et al., 1988; Movshon & Newsome, 1996).
Response to Color
Chromatic signals from the three cone types, combined in an opponent fashion in the retina, arrive in Layer 4C in striate cortex from the parvocellular layers in the LGN; thus, it is not surprising that chromatic properties of cortical neurons resemble those found in parvocellular neurons in the LGN (Derrington et al., 1984). Like the P cells, nearly all neurons in the striate cortex show some degree of chromatic and spatial opponency, which is most commonly found in Layers 4A and 4C, as well as in the blobs (Lennie, Krauskopf, & Sclar, 1990; Livingstone & Hubel, 1984; Ts’o & Gilbert, 1988). A less numerous group of color responsive neurons are those sensitive exclusively to stimuli defined by color differences (E. N. Johnson, Hawken, & Shapley, 2001). These cells are largely nonoriented, respond to low spatial frequencies, and are commonly found in blobs (Johnson et al., 2001; Lennie et al., 1990; Leventhal, Thompson, Liu, Zhou, & Ault, 1995). A larger proportion of neurons respond robustly to stimuli defined both by color differences and by luminance (E. N. Johnson et al., 2001). This group of neurons—most commonly found in Layers 2/3—is highly selective for stimulus form and is equipped to carry spatial information about color and luminance to other cortical areas (E. N. Johnson et al., 2001; see Figure 6.10). Thus, these V1 neurons not only retain color information provided by the LGN, but also add spatial selectivity that enables the detection of color boundaries.
There is recent evidence that V1 neurons not only retain but also amplify chromatically opponent signals arriving from the LGN producing a gradual change in color tuning (Cottaris & De Valois, 1998). This dynamic process, which is likely to involve intracortical circuitry, is reminiscent of a change in orientation tuning—taking place about 30–45 ms after stimulus presentation—observed in neurons located in the output layers of striate cortex (Ringach, Hawken, & Shapley, 1997).
Effects of V1 Lesions
In the primate, most of the visual information is carried to cortex via the retino-geniculate-striate pathway, so it is not surprising that damage to V1 results in a profound visual loss (Merigan, Nealey, & Maunsell, 1993; Miller, Pasik, & Pasik, 1980; Weiskrantz & Cowey, 1967). Although the loss appears to be nearly complete and humans with damage to striate cortex report inability to see anything in the affected portion of the visual field (Glickstein, 1988), rudimentary visual capacities appear to persist. Monkeys with V1 lesions can detect rapid flicker (Humphrey & Weiskrantz, 1967), discriminate simple colors (Keating, 1979; Schilder, Pasik, & Pasik, 1972), track moving lights (Humphrey & Weiskrantz, 1967), and discriminate simple forms (Dineen & Keating, 1981). This residual visual function most likely depends on alternative projections that reach the cortex via the superior colliculus and thalamus. For example, the minimal color vision that survives may depend on color-opponent P ganglion cells projecting to cortex through the pulvinar (Cowey, Stoerig, & Bannister, 1994). On the other hand, the coarse localization of light after V1 lesions may be maintained by the cortical areas receiving projections from the superior colliculus (Walker, Fitzgibbon, & Goldberg, 1995).
Area V2
Anatomy
Area V2 is a narrow strip of cortex located anterior and adjacent to area V1; it is on the surface of and inside the lunate sulcus (Essen & Zeki, 1978; Zeki & Sandeman, 1976). It contains topographically organized representations of the contralateral visual field (Gattass, Gross, & Sandell, 1981) and receives its major inputs from striate cortex (Kennedy & Bullier, 1985; Rockland, 1992; Van Essen, Newsome, Maunsell, & Bixby, 1986). Although it also receives some projections from the LGN (Bullier & Kennedy, 1983) and pulvinar (Curcio & Harting, 1978), its activity appears to be driven mainly by the inputs provided by V1 neurons (Girard & Bullier, 1989; Schiller & Malpeli, 1977). As in Area V1, the representation of the central 10° of the visual field is substantially expanded (Gattass et al., 1981). Area V2 projects topographically back to Area V1 and to Areas V3, MT, and V4, as well as to regions within parietal cortex, including the medial superior temporal area (MST), posterior occipital area (PO), and the ventral intraparietal area (VIP; Gattass, Sousa, Mishkin, & Ungerleider, 1997).
Functional Properties
Although many V2 receptive field properties resemble those foundinV1,a number of new features emerge. Commontothe two areas is the presence of selectivity for stimulus orientation and direction (Burkhalter & Van Essen, 1986). However, neurons in V2 have larger receptive fields (Gattassetal., 1981; see Figure 6.8), prefer lower spatial frequencies, and have a spatial frequency tuning somewhat broader than that of V1 neurons (Foster et al., 1985; Levitt, Kiper, & Movshon, 1994). Although selectivity for stimulus orientation is present in more than half of V2 neurons (Zeki, 1978b), only a small proportion (15%) are selective for the direction of stimulus motion (Burkhalter & Van Essen, 1986; Levitt, Kiper, et al., 1994). These directionally selective neurons are localized largely to the thick stripes (discussed later in this research paper) and show somewhat higher contrast sensitivity (Levitt, Kiper, et al., 1994), suggesting influences of the M pathway.
Many neurons in V2 are sensitive to chromatic modulations (Burkhalter & Van Essen, 1986) and some show strong color opponent responses (Levitt, Kiper, et al., 1994; Zeki, 1978b). There are similarities in chromatic sensitivity of V2 neurons with that observed in Area V1, although some differences in tuning have been reported (Levitt, Kiper, et al., 1994). There are also a greater proportion of color-oriented cells—as well as neurons that exhibit color and disparity selectivity—in comparison with V1 (Roe & Ts’o, 1997).
In contrast to cells in Area V1, most V2 cells are binocularly driven, and many of these neurons are tuned to retinal disparity (Hubel & Livingstone, 1987; Poggio, 1995; Zeki, 1979). Although most of these neurons are sensitive only to the absolute disparity, some respond to the relative disparity between different locations in the visual field, a property absent from V1 neurons (Cumming & Parker, 1999). The emergence of neurons sensitive to relative disparity, a property upon which stereopsis depends, suggests that some V2 neurons may be providing signals to support depth perception (Cumming & DeAngelis, 2001).
Another feature to emerge in V2 neurons is a robust response to illusory contours, first observed by Peterhans and von der Heydt (1989), although there is some evidence of neuronal responses to illusory contours in V1 (Grosof, Shapley, & Hawken, 1993). Such responses are indicative of neurons’ filling in the information about missing contours—a process requiring some level of contour integration. V2 neurons have also been shown to respond to illusory contours induced by depth cues; these responses are present even with cues located beyond the classical receptive field, suggesting a role of longrange horizontal connections within Area V2 (Bakin et al., 2000; see example in Figure 6.9).
In addition to these properties, a selectivity of V2 for complex shapes has also been reported, suggesting that an amount of integration of stimulus features encoded in Area V1 is likely to take place in V2 neurons (Hegde & Van Essen, 2000; Kobatake & Tanaka, 1994). All these features suggest that the information provided by V2 neurons may play a role in coding of surface properties, including contours, opacity, transparency, and relative depths.
Functional and Anatomical Segregation
The spatial segregation and clustering of receptive field properties characteristic of V1 is also present in V2. The first insights into the anatomical and functional organization of this region were provided by the metabolic marker cytochrome oxydase, which revealed a characteristic pattern of labeling consisting of a series of stripes (DeYoe & Van Essen, 1985; Hubel & Livingstone, 1987; Livingstone & Hubel, 1984; Olavarria & Van Essen, 1997). These stripes, consisting of dark thin and thick regions separated by lightly stained pale stripes, have also been visualized by optical imaging (Malach, Tootell, & Malonek, 1994; Roe &Ts’o, 1995).The visual map of V2 consists of three distinct maps, with every location represented once in each of the thin, pale, and thick stripes associated with neurons selective for color, orientation, and disparity respectively (Roe & Ts’o, 1995; Zeki & Shipp, 1987). This anatomical segregation of the three modalities is not entirely complete, as demonstrated by the presence of neurons selective for more than one modality. In fact, studies utilizing optical imaging combined with single-neuron recordings revealed subcompartments within individual stripes, specific for color, form, and disparity (Ts’o, Roe, & Gilbert, 2001). These findings argue against the notion that processing of color, orientation, and disparity is strictly localized to specific types of stripes; this is supported by the fact that the thick stripes in V2, known to receive inputs from Layer 4B in V1 (the magnocellular output layer) also receives inputs from Layer 4A, the parvocellular output layer. Another interesting feature of projections supplied by pyramidal V1 neurons is their relatively extensive spread across V2 and the possibility that they interconnect individual stripe-like compartments in V2, providing an anatomical substrate for interactions between segregated channels in V1 (Levitt, Yoshioka, & Lund, 1994). Furthermore, the intrinsic organization within V2 is such that all three cytochrome-oxydase-rich compartments are interconnected by horizontal connections (Levitt, Yoshioka, et al., 1994; Malach et al., 1994). This anatomical intermixing of signals from the two pathways suggests that V2 may play a role in combining these signals, a notion supported by many receptive field properties encountered in this region.
Effects of V2 Lesions
Although a number of studies have examined the effects of lesions on prestriate cortex—a region that in addition to V2 includes a number of other cortical areas—only one study examined the effects of lesions limited to Area V2 (Merigan et al., 1993). This study reported depressed contrast sensitivity for orientation discrimination (measured with gratings defined by luminance or color) but not for the discrimination of the direction of motion (tested with rapidly moving stimuli). In addition, V2 lesions also profoundly and permanently disrupted the discrimination of complex forms. This profile of visual loss is consistent with receptive field properties characteristic to that area and suggests that neurons in Area V2 play an important role in processing of complex form and color but have a lesser role in motion perception.
Area V3
Anatomy
Area V3, a narrow strip of cortex located immediately anterior to V2, contains a representation of the central 40° of the contralateral visual field split into the ventral (V3v) and the dorsal (V3d) portions, representing the upper and lower quadrants, respectively (see Figure 6.7; Essen & Zeki, 1978; Zeki, 1978d).Although the ventral and dorsal subdivisions of V3 encompass a single representation of the visual field, they differ in their pattern of connectivity (Van Essen et al., 1986) as well as in their receptive field properties, with V3d having a higher incidence of directionally selective neurons but lower number of color-selective cells (Burkhalter & Van Essen, 1986). Because of these differences, Burkhalter and Van Essen (1986) argued that these areas should be treated as separate visual areas; they termed the dorsal region V3 and the ventral region ventral posterior area (VP). Recently, Kaas and Lyon (2001) disputed the idea of splitting these regions into separate visual areas and proposed an alternative scheme that included a single but redefined Area V3. Although the issue of what specifically constitutes Area V3 is important, the details of this controversy are outside the scope of this research paper; we focus here on the results of recordings performed in this general region, treating V3d and V3v together.
This region receives major inputs from Layer 4B of V1 and projects to Areas MT, MST, and VIP (Beck & Kaas, 1999; Felleman, Burkhalter, & Van Essen, 1997), suggesting an association with the dorsal visual stream. However, V3 also receives inputs from V2 and is strongly interconnected with V4, the major component of the ventral visual stream (Beck & Kaas, 1999). Because of this pattern of connectivity, V3 is in a good position to serve as a site where the integration of various visual signals can occur.
Functional Properties
The properties of V3 neurons support the notion that this region may be one of the sites of integration between the visual signals carried by the two major functional streams. Unfortunately, only a small number of physiological studies examining visual receptive field properties have been performed on this region, and those that did recorded from anesthetized animals (e.g., Gegenfurtner, Kiper, & Levitt, 1997).Although the receptive fields of V3 neurons are larger than those found in V2 (Felleman & Van Essen, 1987; Gattass, Sousa, & Gross, 1988), they share a number of similar properties with V2 neurons, including a high incidence of orientation selectivity (80%) and similar orientation tuning (Gegenfurtner et al., 1997). On the other hand, V3 neurons prefer lower spatial and higher temporal frequencies and exhibit a higher sensitivity to contrast than do V2 neurons (Gegenfurtneretal., 1997). These properties—together with the relatively high incidence of directional selectivity (nearly 60%) and the presence of selectivity for binocular disparity (Felleman &Van Essen, 1987)— suggest a role in processing of motion information. Indeed, Gegenfurtneret al. (1997) found that some directionally selective neurons in V3 respond to the motion of a plaid pattern rather to its components, a feature characteristic of many MT neurons and indicative of higher-level motion processing (Movshon, Adelson, Gizzi, & Newsome, 1985).
In addition to motion and depth analysis, nearly half of all neurons in V3 show selectivity for color (Burkhalter & Van Essen, 1986; Gegenfurtner et al., 1997). It is noteworthy that many of the neurons responding to color also show directional selectivity, and a substantial number of V3 neurons responds show directional selectivity to isoluminant gratings. This interaction between color and motion—in addition to motion integration—suggests that V3 represents an important stage in processing of visual information. These properties and the connections withAreas MT and V4, the key midlevel components of the dorsal and the ventral cortical pathways, places V3 at an important stage in the analysis of the visual scene.
Area V3A
Van Essen and Zeki (1978) described a distinct region located between Areas V3 and V4 containing separate visual field representation; they labeled this region V3A. This region receives projections from Area V2, projects to Area V4, contains a representation of both the upper and lower visual quadrants, and has also been referred to as the posterior intraparietal area (PIP; Colby, Gattass, Olson, & Gross, 1988; Felleman, Burkhalter, et al., 1997).
Very few functional differences have been found between Areas V3 and V3A. These differences include the finding that neurons in V3 become unresponsive to visual stimuli when V1 is removed, whereas a third of neurons in V3A remain responsive (Girard, Salin, & Bullier, 1991). The activity of neurons in V3 A has been shown to be modulated by the direction of gaze (Galletti & Battaglini, 1989), and some of the directionselective neurons respond better to real motion across the retina rather than to motion induced by a stationary stimulus when the eye moved (Galletti, Battaglini, & Fattori, 1990).
Parallel Functional Streams
The inputs from the P and M pathways are segregated into different cortical layers in the striate cortex, and an anatomical segregation of neurons with similar properties is also apparent in Area V2. However, the segregation within the visual system becomes most pronounced at the subsequent stage of cortical processing, in Areas V4 and MT. At this stage, the two areas give rise to two distinct cortical streams, the ventral and dorsal pathways. The ventral pathway has been termed the color and form or the what pathway (Maunsell & Newsome, 1987) because in earlier studies both color and shape selectivity appeared to be most prominent in the physiological responses of neurons in the two main components of this stream—Area V4 and the inferotemporal cortex. The dorsal pathway, consisting of MT and the areas within the posterior parietal cortex, has been termed the motion or the where pathway because of the prevalence of directionally selective neurons and the evidence for encoding of spatial location within this pathway. In the following discussion we provide a brief overview of the major properties of the regions within the ventral and dorsal streams and discuss the current view of their role in visual function.
Ventral Visual Stream
Area V4
Anatomy
Area V4, first identified by Zeki (1971), is located in a region anterior to the lunate sulcus. It receives direct projections from Areas V1, V2, and V3 (Nakamura, Gattass, Desimone, & Ungerleider, 1993; Yukie & Iwai, 1985; Zeki, 1978c), sends strong projections to temporal area (TEO) in the inferotemporal cortex, and has reciprocal connections with a number of other areas across the visual system (Distler, Boussaoud, Desimone,&Ungerleider,1993;Tanaka,Lindsley,Lausman,& Creutzfeldt, 1990). Anatomical modularity, prevalent in V2 in theformofthin,thick,andpalestriperegions,isnotasapparent, although the projections from the thin and pale stripe subdivisions ofV2 are distinct and there is evidence of a modular organization within V4 that reflect these inputs (Felleman, Xiao, & McClendon, 1997; Y. Xiao, Zych, & Felleman, 1999). There is also evidence of clustering of neurons with similar preferred orientation and size (Ghose & Ts’o, 1997).
Functional Properties
Area V4 contains a complete representation of the contralateral visual field with an expanded representation of its central portion (Gattass et al., 1988). The receptive fields are well defined but are larger than those encountered in Areas V1, V2, and V3 (Desimone & Schein, 1987; Gattass et al., 1988). Many of the properties encountered in V4 are reminiscent of those found in the primary visual cortex; thus, many V4 neurons are tuned for stimulus orientation and show selectivity for the length and the width of oriented bars (Cheng, Hasegawa, Saleem, &Tanaka, 1994; Desimone & Schein, 1987). In addition, about a third of V4 neurons show selectivity for the direction of stimulus motion (Desimone & Schein, 1987; Ferrera, Rudolph, & Maunsell, 1994), and the majority are selective to binocular disparity (Hinkle & Connor, 2001). AlthoughV4 neurons respond selectively to many of the same features as V1 neurons, a number of more complex properties emerge that suggest specialization for the analysis of complex forms. Forexample, Gallant, Connor, Rakshit, Lewis, and Van Essen (1996) reported that V4 neurons not only are selective for conventional Cartesian gratings, but many also respond preferentially to more complex polar and hyperbolic stimuli. Pasupathy and Connor (1999) found strong selectivity for specific stimulus contours such as angles and curves and showed a bias toward convex contours—a feature that could account for perceptual preferences for convex forms—and a recently reported sensitivity to texture and selectivity to shading suggests the involvement ofV4 neurons in the extraction of shape from shading (Hanazawa & Komatsu, 2001). An example of selective responses of V4 neurons to complex textures is shown in Figure 6.12. Together with sensitivity to binocular disparity,these features could enable V4 neurons to use stereoscopic cues to extract object information.
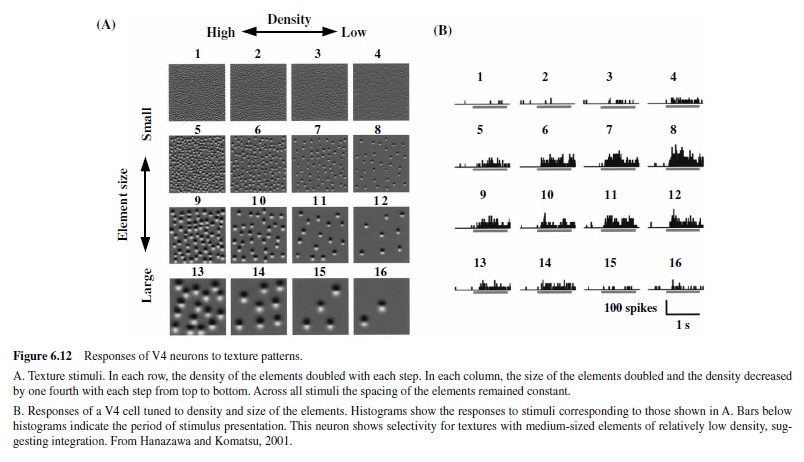
From the time Area V4 was first described, it had been thought of as the color-processing area (Zeki, 1971). However, subsequent work has argued against this specialization. Although many V4 neurons show some wavelength sensitivity and a small proportion are color-biased or color-opponent, similarpropertieshavebeenobservedinneuronsinotherareas of the visual cortex (Desimone, Schein, Moran, & Ungerleider, 1985). It remains to be seen whether V4 neurons show color constancy, one of the critical features of color vision.
Effects of V4 Lesions
A number of studies have examined the effects of lesions of this area on form and color discrimination; the results—for the most part—support its unique contribution to processing of form, as suggested by single-unit recordings. These studies have shown that the loss of Area V4 results in relatively modest and often transitory deficits in the discrimination of size and shape of simple forms (Heywood & Cowey, 1987; Schiller, 1993; Walsh, Butler, et al., 1992). Monkeys with V4 lesions can discriminate the orientation of simple gratings at normal levels as long as the gratings are at relatively high contrasts, are not masked by noise, and are defined by luminance or color (De Weerd, Desimone, & Ungerleider, 1996; Merigan, 1996). However, the same lesions produce severe and permanent deficits in tasks involving discrimination of illusory contours, three-dimensional forms, textures, and groupings (De Weerd et al., 1996; Merigan, 1996, 2000). These effects are quite selective because when the contours are defined by motion, luminance, or color, the effects of V4 lesions were minimal (De Weerd et al., 1996).
Lesions of V4 also affect some aspects of color vision, although these effects are relatively modest. Walsh and colleagues reported largely transient deficits of color discrimination and modest deficits in color constancy (Walsh, Kulikowski, Bulter, & Carden, 1992; Walsh, Carden, Butler, & Kulikowski, 1993). They also reported that perception of color categories was unaffected by the absence of V4 neurons and suggested that these categories are established by chromatic mechanisms at earlier stages of cortical processing. Other studies have also reported relatively minor disruptions of huediscrimination thresholds and modest deficits in chromatic contrast sensitivity (Dean, 1979; Heywood, Gadotti, & Cowey, 1992; Merigan, 1996). These results support the notion that although V4 represents an important step in processing of complex shape and texture, it is less likely to play a key role in processing of information about color.
Inferotemporal Cortex
Anatomy
Inferotemporal (IT) cortex is the final processing stage of the ventral visual stream and is believed to play a key role in processing shape information. It consists of a posterior portion, Area TEO, which in turn projects to the adjacent, more anterior portion, Area TE. Area TEO receives its major inputs from V4 as well as from Areas V2 and V3 (Distler et al., 1993). From there, visual information is sent to TEO, which also receives a direct projection from V4 and from a number of areas in the ventral and anterior portions of the temporal lobe, including the hippocampus (Yukie & Iwai, 1988). This region also is reciprocally interconnected with ventral portions of prefrontal cortex (Bullier, Schall, & Morel, 1996; Seltzer & Pandya, 1989), with the superior temporal polysensory area (STPa)— which also receives projections from the dorsal pathway (discussed later in this research paper)—with parahippocampal regions (Shiwa, 1987), with the basal ganglia (Middleton & Strick, 1996), and with subcortical areas—notably, the pulvinar (Baleydier & Morel, 1992), and portions of the amygdala (Amaral & Price, 1984; Cheng, Saleem, & Tanaka, 1997).
Functional Properties: Area TEO
Area TEO contains an orderly representation of the entire contralateral visual field with receptive fields that are somewhat larger than those in Area V4, increasing with eccentricity from about 5° near the fovea to 60° in the far periphery (Boussaoud, Desimone, & Ungerleider, 1991). Inputs from V4 cluster to produce an apparent modular segregation within TEO with respect to color and shape selectivity (Felleman, Xiao, et al., 1997). Many characteristics of TEO receptive fields are reminiscent of those found in V4 and earlier stages of cortical processing; many of its cells respond selectively to simple features such as length, width, orientation, and wavelength (Kobatake & Tanaka, 1994). However, selectivity for more complex patterns is also quite common (Desimone et al., 1984; Kobatake & Tanaka, 1994). The nature of this selectivity appears to be different from that encountered in TE (discussed in the next part of this research paper) because neurons show less invariance in their response to changes in the size and orientation of objects (Hikosaka, 1999).
Functional Properties: Area TE
In contrast to TEO, this region contains neurons with very large receptive fields that almost always include the fovea and extend into both visual hemifields covering as much as 40° of the visual field (Boussaoud et al., 1991; Desimone & Gross, 1979). Its dorsal (TEad) and ventral (TEav) portions have slightly different connections and show some subtle differences in response properties (Martin-Elkins & Horel, 1992; Tamura & Tanaka, 2001), although for the purposes of this review we treat them as a single area. The incidence of neurons responding strongly to complex stimulus features increases dramatically in Area TE (Tanaka, 1997), and although some TE neurons show extreme selectivity for complex structures such as faces (Desimone, Albright, Gross, & Bruce, 1984; Figure 6.13), other neurons are much less discriminating and respond strongly to a variety of complex patterns. Tanaka (1997) has shown that TE neurons with preferences for similar stimulus features cluster into overlapping columns perpendicular to the cortical surface and extending across all cortical layers.There areabout 1,300 of such columns, each extending over about 400 m (Tanaka, 1993; Figure 6.13).
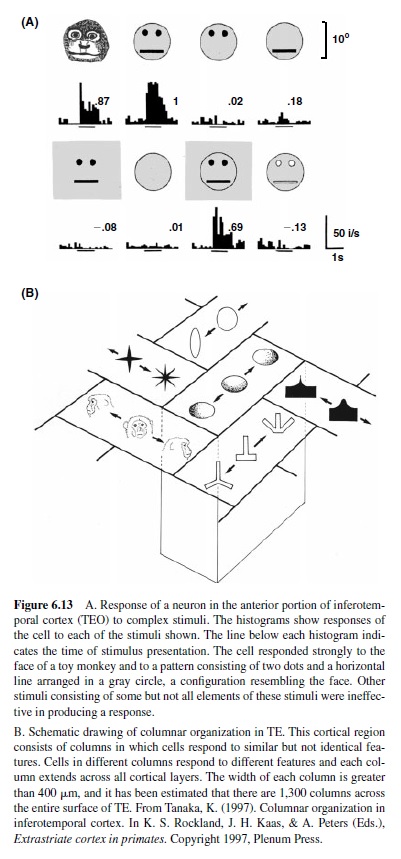
Among novel features emerging in TE—and not present at earlier stages of cortical analysis—is response invariance. For example, there are neurons in TE with responses to complex stimuli that are not affected by large changes in the location of the stimulus in the visual (and receptive) field or in retinal image size (Desimone et al., 1984; Hikosaka, 1999; Ito, Tamura, Fujita, & Tanaka, 1995). Neurons in TE also respond to three-dimensional objects and develop selectivity for specific views of those objects, particularly for those that the monkey learned to recognize the familiar views of those objects (Logothetis & Pauls, 1995).
There is accumulating evidence that TE neurons acquire preferences to specific stimulus features through learning (Kobatake, Wang, & Tanaka, 1998; Logothetis, Pauls, & Poggio, 1995; Sakai & Miyashita, 1994). For example, it has been shown that exposure to a set of patterns during discrimination training increases the probability that that TE neurons will respond maximally to these stimuli (Kobatake, Wang, & Tanaka, 1998). The finding by Logothetis et al. (1995)—that the selectivity of TE neurons is most pronounced for objects the monkey is able to recognize—suggests that new receptive field properties can be acquired during active learning. This apparent ability of TE neurons to acquire new properties with learning has also been demonstrated in tasks designed specifically to test long-term memory for complex patterns (Sakai & Miyashita, 1994).
Another striking feature of TE neurons was revealed in experiments by Sheinberg and Logothetis (1997), who used perceptually ambiguous stimuli induced by binocular rivalry.
They showed that the activity of the majority of IT neurons is determinedby the perceptually dominant stimulus, a phenomenon only rarely observed at earlier stages of cortical analysis (Leopold & Logothetis, 1996). This activity—together with the complex response properties described previously— reinforces the importance of IT neurons in the processing and perception of complex shape and form.
Effects of IT Lesions
The role of IT in object recognition was first revealed in studies involving damage to this region over 50 years ago (Mishkin, 1954; Mishkin & Pribram, 1954) and in numerous lesion studies performed since (for a review, see Merigan & Pasternak, in press). Many of these studies reported deficits in the discrimination of complex forms as well as in the learning of new discriminations (e.g., Britten, Newsome, & Saunders, 1992; Huxlin, Saunders, Marchionini, Pham, & Merigan, 2000). These deficits were often transient, and only a few persisted after extensive retraining. A number of studies also examined the effects of IT lesions on color vision and found deficits in color discriminations that ranged from profound to relatively modest (e.g., Buckley, Gaffan, & Murray, 1997; Huxlin et al., 2000). As is the case with form discriminations, postlesion training often resulted in improvements in color vision. On the whole, the effects of IT lesions are reminiscent of effects of V4 lesions (see previous discussion of this area), although in the case of color vision the deficits appear to be a bit more pronounced.
Dorsal Visual Stream
Area MT
Although the dorsal visual stream originates in specific layers of striate cortex and occupies well-defined subregions (thick cytochrome oxidase (CO) stripes) within V2, it becomes truly distinct—both anatomically and functionally—at the level of the middle temporal area (MT) located in the superior temporal sulcus (STS). During the past 10–15 years, MT has become one of the most studied midlevel processing areas in the visual system of primates. Because most of the physiological recordings from this area are carried out in monkeys performing behavioral tasks, this area has become a fertile ground for establishing links between neural activity, behavior, and perception.
Anatomy
Area MT was first described and named by Allman and Kaas (1971) in the owl monkey. Subsequently, Zeki (1974) identified an equivalent area in the macaque monkey and— because of the selectivity of neurons in this area to image motion—named it the motion area of the superior temporal sulcus and later V5 (Zeki, 1978a). In the macaque monkey, MT is located in the medial part of the posterior bank of the STS. It receives strong projections from Layer 4B of the striate cortex (Hawken et al., 1988), the recipient zone of the magnocellular pathway, and from the thick stripes of Area V2 (DeYoe & Van Essen, 1985; Shipp & Zeki, 1989); both regions contain a high incidence of directionally selective neurons. MTprojects to the adjacent area, MST (Desimone & Ungerleider, 1986)—also rich in directionally selective cells—and provides inputs to other regions of the parietal cortex (Boussaoud, Ungerleider, & Desimone, 1990; Gattass & Gross, 1981). Together with these associated areas, MT constitutes an important component of the dorsal visual stream specialized for processing of visual motion and spatial information. MT also maintains reciprocal connections with Area V4 (Ungerleider & Desimone, 1986), allowing direct communication between the two streams; furthermore, it interconnects with some areas in prefrontal cortex (Schall, Morel, King, & Bullier, 1995) as well as with a number of subcortical structures, including the superior colliculus and pulvinar (Ungerleider, Desimone, Galkin, & Mishkin, 1984).
Functional Properties
MT contains a complete representation of the contralateral visual field, with a disproportionately large area devoted to central vision (Van Essen, Maunsell, & Bixby, 1981). Its neurons have relatively large receptive fields similar in size to those of V4 (Desimone & Ungerleider, 1986; see Figure 6.8). Selectivity for the direction and speed of stimulus motion is the defining characteristic of the majority of MT neurons (e.g., Albright, 1984; Maunsell & Van Essen, 1983b; Figure 6.14), and neurons with similar directional tuning are organized in columns (Albright, 1984). The majority of MT neurons respond best to the stimulation of both eyes and are selective for retinal disparity (DeAngelis & Newsome, 1999; Maunsell & Van Essen, 1983b; Tanaka et al., 1986); neurons with similar disparities cluster into columns, which extend over the thickness of cortex (Figure 6.15). The two sets of columns, direction and disparity, seem to occupy the same subregions in MT, but the relationship between them is still unclear (DeAngelis & Newsome, 1999).
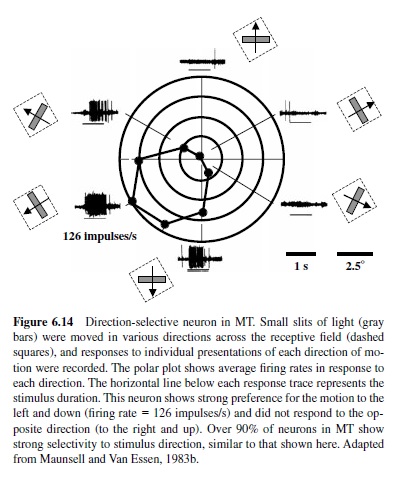
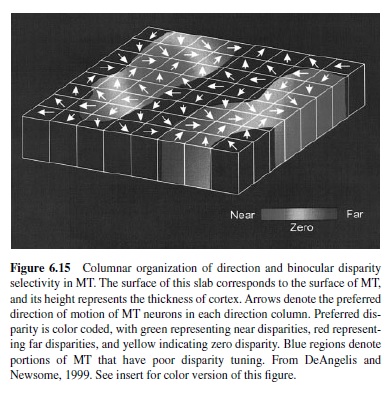
Motion Integration
MT neurons display directional selectivity to smooth and sampled motion of random dots, bars (Figure 6.14), and gratings (Maunsell & Van Essen, 1983c; Mikami, Newsome, & Wurtz, 1986), as well as to more complex motion consisting of multiple motion vectors at the same part of the visual space (Albright, 1984; Britten, Shadlen, Newsome, & Movshon, 1992). This property of MT neurons was first demonstrated by Movshon et al. (1985) and later by Rodman and Albright (1989), who compared responses to moving gratings of different orientations to plaid patterns consisting of two component gratings. They found that although some MT neurons responded only to the motion of the individual components of the plaid, other neurons appeared capable of coding the direction of the whole plaid pattern—independent of the motions of component gratings. In contrast, direction-selective neurons in the striate cortex responded exclusively to the motion of the components of the plaid rather to the direction of plaid motion. It is interesting that the behavior of these patternselective neurons in MT responding to the direction of the plaid matched the percept reported by human observers viewing the plaid stimuli (Adelson & Movshon, 1982). These experiments demonstrate the emergence of neuronal properties that could be tied more directly to perception.
Subsequent studies have examined the responses of MT neurons to other types of complex motion, also consisting of multiple motion vectors presented in the same part of the visual space. For example, in contrast to V1 neurons, which respond equally well to nontransparent and transparent motion, responses of MT neurons to the motion of transparent surfaces formed by random dots moving in different directions are suppressed (Snowden, Treue, Erickson, & Andersen, 1991). Similar suppression has been observed with a smaller number of elements moving in different directions within an MT receptive field (Recanzone, Wurtz, & Schwartz, 1997). This suppression is reminiscent of the perception of motion transparency observed in human psychophysical experiments (Qian, Andersen, & Adelson, 1994) and is an example of the way MT neurons deal with multiple directional vectors at the same spatial location.
Another example illustrating the integrative properties of MT neurons comes from studies utilizing stochastic randomdot stimuli consisting of coherently and randomly moving dots (e.g., Britten, Shadlen, et al., 1992), in which the strength of motion is controlled by the proportion of spatiotemporally correlated dots. Britten, Shadlen, Newsome, and Movshon (1993) showed that the responses of MTneurons to such stimuli vary linearly with stimulus correlation, suggesting linear pooling of local directional signals provided by earlier stages of motion analysis—most likely by striate cortex neurons. Another study involving random-dot stimuli containing multiple directions showed that responses of direction-selective neurons in MT reflect the sum of their responses to the individual motion components (Treue, Hol, & Rauber, 2000).
Finally, direction-selective MT receptive fields have strong antagonistic surrounds, which—when stimulated by the same direction, speed, or both as the excitatory center—show strong inhibition (Allman, Miezin, & McGuinness, 1985; D. K. Xiao, Raiguel, Marcar, Koenderink, & Orban, 1995). This property illustrates the ability of MTneurons to integrate local motion signals with the context in which this motion appears, suggesting a role in the detection of relative motion and in figure-ground segregation.
Processing of Depth
A large proportion of neurons in MT are tuned for depth (DeAngelis & Newsome, 1999; Maunsell & Van Essen, 1983b; Tanaka et al., 1986) and are found clustered according to preferred disparity (see Figure 6.15). These neurons appear to contribute to stereoscopic depth perception; microstimulation of similarly tuned cells can bias the monkey’s perceptual judgment of depth towards the preferred disparity (DeAngelis, Cumming, & Newsome, 1998). Apart from depth perception, the disparity tuning of these neurons appears to be relevant to other perceptual phenomena. For example, a difference in disparity of the display consisting of sheets of random dots creates the percept of transparent motion (Bradley, Quian, & Andersen, 1995; Qian et al., 1994), and changing the disparity in the surround of the classical receptive field modulates not only the response of MT neurons to motion, but also the percept of the direction of motion (Bradley, Chang, & Andersen, 1998; Duncan, Albright, & Stoner, 2000). It has also been suggested that MT may be involved in extracting shape from motion (Buracas & Albright, 1996; Dodd, Krug, Cumming, & Parker, 2001); furthermore, although there is evidence of the interaction between motion and disparity signals in the same neurons (Bradley et al., 1995), MT neurons do not appear to be tuned to motion in depth (Maunsell & Van Essen, 1983b).
Processing of Color
Although the activity of MTneurons is strongly influenced by the magnocellular pathway (Maunsell, Nealey, & DePreist, 1990)—not known to carry color-opponent signals—many MT neurons maintain significant responses to motion of isoluminant stimuli (Gegenfurtner et al., 1994; Seidemann, Poirson, Wandell, & Newsome, 1999; Thiele, Dobkins, & Albright, 2001). Furthermore, the presence of chromatic information has been shown to increase neuronal direction discrimination (Croner & Albright, 1999). Although chromatic signals reaching MT are much weaker than the luminance signals are, the activity in MT to isoluminant gratings appears to be sufficient to explain the performance of monkeys in a color-based motion discrimination task (Thiele et al., 2001).
Relating Activity of MT Neurons to Perception
Newsome and colleagues have used stochastic random-dot stimuli (discussed previously) as a tool to study the relationship between the activity of single neurons and behavioral performance (Britten, Shadlen, et al., 1992; Newsome, Britten, & Movshon, 1989). They have found that single MT neurons are able to detect the direction of motion in such stimuli at nearly the same level as the monkeys performing the task. They concluded that only a small number of MT neurons are needed to explain the perceptual judgments made by the monkeys. Subsequently, Britten and Newsome (1998) examined directional tuning of MT neurons near psychophysical threshold and modified this view, concluding that direction discrimination near threshold is likely to depend on a population of MT neurons with a wide range of preferred directions.
Other powerful evidence that monkeys use signals from MT during the performance of this task comes from microstimulation experiments (Bisley, Zaksas, & Pasternak, 2001; Salzman, Britten, & Newsome, 1990; Seidemann, Zohary, & Newsome, 1998). In these studies, low-current stimulation of physiologically identified directional columns in MT applied during the presentation of random dots at various levels of coherence biased the animals’decisions toward the preferred direction of the stimulated directional column (Salzman et al., 1990; Salzman, Murasagi, Britten, & Newsome, 1992). Bisley et al. (2001) recently applied higher current stimulation during the performance of a discrimination task in which the monkey compared two directions of motion separated in time (see Figure 6.16). When stimulation was applied during the presentation of the first of the two stimuli, the monkeys consistently reported that the stimulus was moving in the direction preferred by the stimulated neurons—regardless of the true stimulus direction (Figure 6.16, Panels B and C). Furthermore, the monkeys reported motion in the preferred direction of the stimulated column even when the stimulus consisted of stationary dots. Thus, MT neurons appear to be the main source of information used by the monkeys to judge the directions of stimulus motion.
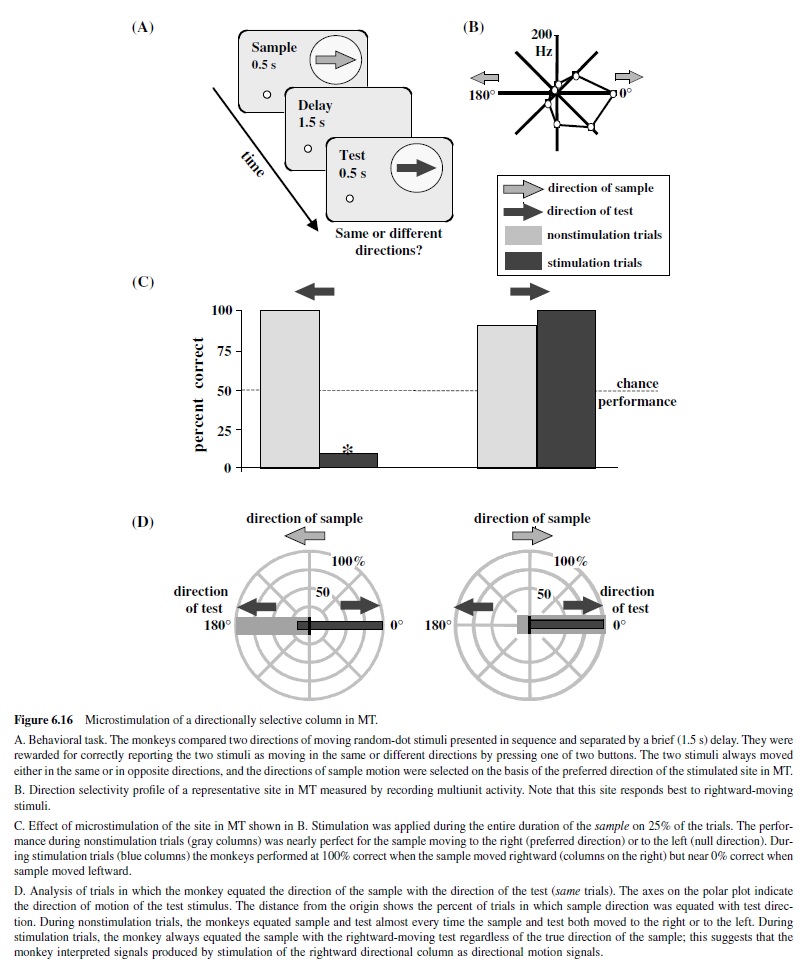
Effects of MT Lesions
Studies involving lesions of MT have confirmed to a large degree the ideas about the role of MT in motion perception, as suggested by the neurophysiological and microstimulation experiments.Although some of the lesion effects were transient and showed substantial postlesion recovery with training (Newsome & Pare, 1988; Rudolph & Pasternak, 1999), they were selective for the properties characteristic of MT neurons. Thus, direction and speed discrimination, motion integration, and the ability to extract motion from noise were selectively affected by the damage to MT (Bisley & Pasternak, 2000; Newsome & Pare, 1988; Pasternak & Merigan, 1994; Rudolph &Pasternak,1999).Deficits in processing of speed information were also revealed by measuring saccades and smooth pursuit of the moving targets (Dursteler, Wurtz, & Newsome, 1987; Newsome, Wurtz, Dursteler, & Mikami, 1985; Schiller & Lee, 1994).
Area MST
Anatomy
Area MST, the medial superior temporal area, was first identified as the MT-recipient zone by Maunsell and Van Essen (1983a). It communicates with the far-peripheral-field representations of Areas V1 and V2 as well as with the parietooccipital visual area of the dorsal pathway (Boussaoud et al., 1990; Maunsell & Van Essen, 1983a). MST consists of two functionally and anatomically distinctregions: dorsal (MSTd) and ventrolateral (MSTv or MSTl; Tanaka, Fukada, & Saito, 1989; Tanaka & Saito, 1989).
Functional Properties
Neurons in MSTd have very large receptive fields and prefer motion of full-field stimuli (Desimone & Ungerleider, 1986; Saito et al., 1986; Tanaka et al., 1986), whereas cells in MSTl generally have smaller receptive fields and respond preferentially to motion of small objects (Tanaka, 1998). Properties of MSTd neurons suggest a role in integrating visual motion signals—generated during the observer’s movement through the environment—with eye-movement and vestibular signals (Andersen, 1997). On the other hand, neurons in MSTl are more likely to be involved in the analysis of object motion in the environment (Tanaka, 1998) and in the maintenance of pursuit eye movements associated with this motion (Komatsu & Wurtz, 1988).
Processing of Optic Flow
MSTd neurons have been implicated in the processing of optic flow, the motion of the visual world perceived by observers during their own movement through the environment. This type of visual motion can be a source of information about the direction of self-motion (Gibson, 1994).
Neurons in MSTd respond to various types of motion of large-field flow patterns, such as expansion, contraction, rotation, translation, or a combination of these (Duffy & Wurtz, 1991; Lagae, Maes, Raiguel, Xiao, & Orban, 1994; Tanaka & Saito, 1989). In response to full-field optic flow stimuli, many of these neurons have a preferred location of the focus of expansion (FOE), which may serve as a cue of the direction of heading (Duffy & Wurtz, 1997; Page & Duffy, 1999; Upadhyay, Page, & Duffy, 2000; see Figure 6.17). These neurons often do not discriminate between the optic flow created by the movement of a subject and simulated optic flow (Duffy, 1998); their responses are largely unaffected by eye or head movements (Bradley, Maxwell, Andersen, Banks, & Shenoy, 1996; Page & Duffy, 1999; Shenoy, Bradley, & Andersen, 1999).
Although it is still not clear how the visual cues resulting from self-motion are utilized, it appears that the computation of the direction of heading is likely to be represented in the population of MST neurons rather than at level of single neurons (Paolini, Distler, Bremmer, Lappe, & Hoffmann, 2000).
Thus, MSTd has the machinery needed to extract and signal the direction of heading from optic flow stimuli (Lappe, Bremmer, Pekel, Thiele, & Hoffmann, 1996; van den Berg & Beintema, 2000). The evidence that the use of such information may depend on MST has been provided by Britten and van Wezel (1998), who took advantage of clustering of neurons preferring the same direction of heading and applied electrical microstimulation to them. This manipulation produced biased decisions about direction of heading provided by from optic flow stimuli. It should be pointed out, however, that there is no direct evidence that this mechanism is actually utilized during self-motion. Although some evidence indicates that humans use optic flow to control walking (Warren, Kay, Zosh, Duchon, & Sahuc, 2001), much more conclusive data suggest that rather than using optic flow, humans usually aim towards an object and correct their aim as they walk (Rushton, Harris, Lloyd, & Wann, 1998).
Retinal Disparity and Object Motion
Some properties of MSTl neurons are reminiscent of neurons in MT. For example, in addition to similarly sized receptive fields, many neurons in MSTl are tuned for retinal disparity, and some show a change in direction selectivity when disparity is changed (Eifuku & Wurtz, 1999; Roy, Komatsu, & Wurtz, 1992; Takemura, Inoue, Kawano, Quaia, & Miles, 2001). Also similar to MT is that neurons in this region have antagonistic surrounds and respond very strongly to object motion when the motion in the surround is in the opposite direction (Eifuku & Wurtz, 1998). This sensitivity to relative motion of objects suggests that these neurons may play a role in segmenting moving objects from backgrounds.
Involvement in Eye Movements
MSTd neurons have also been shown to participate in mechanisms underlying both voluntary and involuntary eye movements. They are active during smooth-pursuit eye movements (Komatsu & Wurtz, 1988), and the ability to match the speed of the target during pursuit is affected by lesioning (Dursteler & Wurtz, 1988) and by electrical stimulation of these neurons (Komatsu & Wurtz, 1989). MSTd neurons are also active prior to the ocular following response (OFR), an involuntary short-latency tracking eye movement evoked by a sudden movement of a stable environment (Kawano, Shidara, Watanabe, & Yamane, 1994; Miles, Kawano, & Optican, 1986; Takemura, Inoue, & Kawano, 2000). Because these responses are also affected by MST lesions (Dursteler & Wurtz,1988), it is likely that this area serves a role in the circuitry subserving OFR.
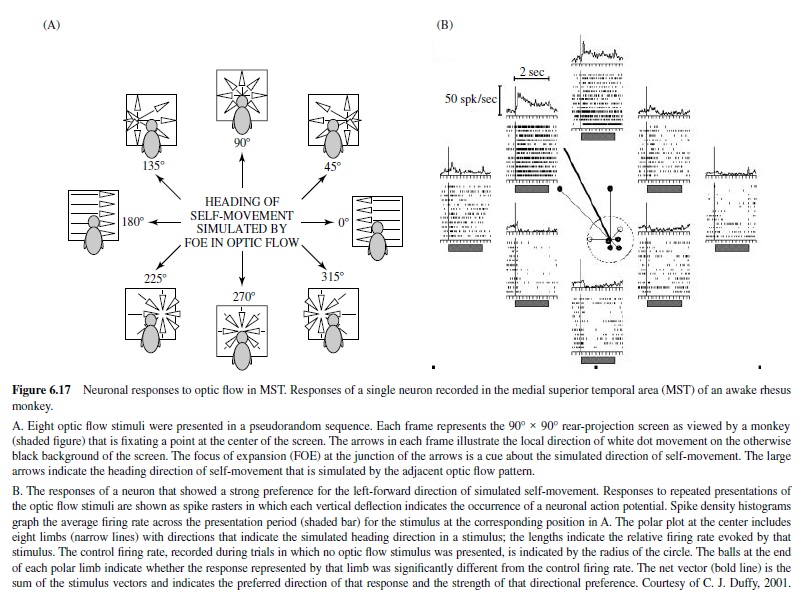
In sum, the properties of this important component of the dorsal visual stream point to its role in the processing of motion information in active observers. Neurons in MSTd are capable of integrating visual information extracted during movement of the observer with signals related to eye and head movements (Andersen, Shenoy, Syder, Bradley, & Crowell, 1999). On the other hand, MSTl may contribute to the ability to detect and pursue motion of small objects in complex environments.
Area LIP
Anatomy
The lateral intraparietal area (LIP) and its contribution to visually guided behavior have received a lot of attention in recent years. Studies examining the properties of LIP neurons have focused on its role in the encoding of a representation of visual space, in planning eye movements, and in spatial attention. It receives inputs from a number of cortical regions, including V2, V3, V3A, V4, MT, MST, TEO, and TE (Andersen, Asanuma, & Cowan, 1985; Andersen, Asanuma, et al., 1990; Blatt, Andersen, & Stoner, 1990). It is reciprocally interconnected with Areas VIP and 7a in the parietal cortex (Blatt et al., 1990; Seltzer & Pandya, 1986), with the prefrontal and premotor cortex, and with the superior colliculus and pulvinar (Cavada & Goldman-Rakic, 1989; Schall et al., 1995).
Functional Properties
LIP contains a representation of the contralateral visual field; more than half of its neurons are devoted to processing stimuli in a region of about 6° around the fovea (Ben Hamed, Duhamel, Bremmer, & Graf, 2001). Receptive fields in LIP are larger than those in MT, although they are well defined and increase in size with eccentricity from about 5° near the fovea (Ben Hamed et al., 2001).
Neurons in LIP have a number of properties not seen at earlier levels of visual processing. Although they respond to the onset of visual stimuli (Robinson, Goldberg, & Stanton, 1978), they also show memory activity in tasks requiring saccadic eye movements to remembered spatial locations (Barash, Bracewell, Fogassi, Gnadt, & Andersen, 1991a, 1991b; Gnadt & Andersen, 1988). There is also evidence that the activity of LIP neurons is modulated by the position of the eye in the orbit (Andersen, Bracewell, Barash, Gnadt, & Fogassi, 1990) and that these neurons store information not only in eye-centered (Duhamel, Colby, & Goldberg, 1992), but also in body-centered coordinates (Snyder, Grieve, Brotchie, & Andersen, 1998). Another intriguing feature of LIP neurons is that the spatial representation of the remembered stimulus is dynamic and shifts to the corresponding retinal location around the time of a saccade (Duhamel et al., 1992; see Figure 6.18). Thus, neurons in the parietal cortex update the retinal coordinates of remembered stimuli to anticipate the upcoming eye movement. This remapping— important for maintaining continuous representation of the visual world during eye movements—is not unique to LIP; it has also been observed in other visual areas, including V2, V3, and V3A (Nakamura & Colby, 2000, 2002).
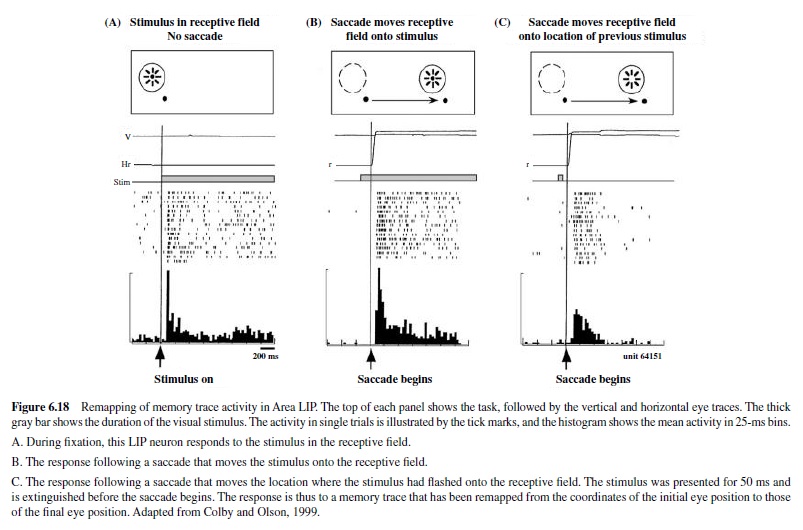
These properties—together with observations showing that LIP neurons fire in preparation for a saccade—lead to the hypothesis that the memory activity preceding the saccade represents an intention to make a saccade to the remembered location(Andersen,Snyder,Bradley,&Xing,1997;Mazzoni, Bracewell, Barash, & Andersen, 1996; Platt & Glimcher, 1997; Snyder, Batista, & Andersen, 1997). According to this hypothesis, LIP activity is indicative of the role of LIP in sensorimotor transformations that take place in preparation for action. An alternative hypothesis is based on results showing that the visual and memory responses are modulated by the salience and behavioral significance of visual stimuli (Colby, Duhamel, & Goldberg, 1996; Gottlieb, Kusunoki, & Goldberg, 1998; Powell & Goldberg, 2000). This hypothesis suggests that the level of activity in LIP is used by the brain to allocate attention to the region of greatest activity—whether it is driven by a salient stimulus, such as a saccade target, or by top-down mechanisms. Whether LIP is involved in motor planning, attention, or both, the activity of these neurons provides the opportunity to study neural correlates of cognitive behavior (Leon & Shadlen, 1998; Platt & Glimcher, 1999; Shadlen & Newsome, 1996; Shadlen & Newsome, 2001; also see Figure 6.19).
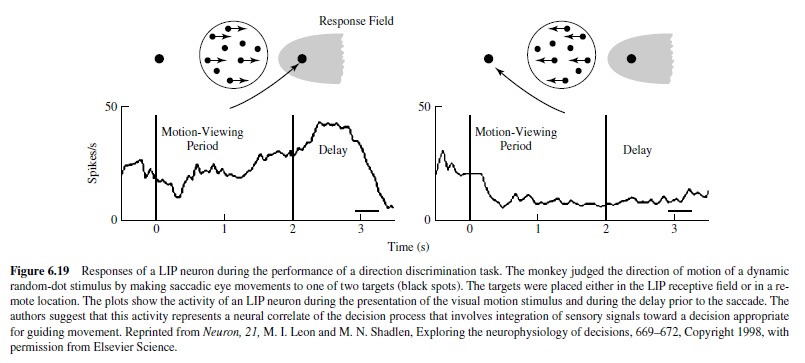
Some neurons in LIP also display properties more common in other visual areas; these areas include selectivity for stimulus shape (Sereno & Maunsell, 1998) and the direction of stimulus motion (Eskandar & Assad, 1999). However, it is not clear whether these response properties represent a role in processing this information, or whether these are just the remnants of signals from the multitude of areas that project to LIP. In summary, LIP neurons appear to carry visual-, memory-, and saccade-related signals that are modulated by the behavioral significance of the stimulus, suggesting that they are involved in sensorimotor transformations taking place in preparation for goal-oriented eye movements and possibly involved in the allocation of visual attention.
Area VIP
The ventral intraparietal area (VIP) has prominent connections from MT, MST, and FST; unlike LIP, however, it receives few (if any) inputs from the ventral pathway (Boussaoud et al., 1990; Colby, Duhamel, & Goldberg, 1993). This evidence and its interactions with other parietal areas suggest that VIPplays a role exclusively in the dorsal stream. Receptive fields of neurons in this area are similar in size to those found in LIP (Duhamel, Colby, & Goldberg, 1998) and show selectivity for optic flow (Colby et al., 1993; Schaafsma & Duysens, 1996). The responses of many VIP neurons are modulated by eye position, and individual neurons can encode information in eye-centered coordinates through to head-centered coordinates (Bremmer, Graf, Ben Hamed, & Duhamel, 1999; Duhamel, Bremmer, Ben Hamed, & Graf, 1997). Some neurons have been found to prefer stimuli that are close to the animal (Colby et al., 1993); most of these cells also respond to tactile stimuli in congruent locations on the head to the visual receptive fields (Duhamel et al., 1998). This has lead to the suggestion that this region is involved in a construction of a multisensory head-centered representation of near personal space (Duhamel et al., 1998).
Area STPa
STPa receives inputs from both visual streams (Baizer, Ungerleider, & Desimone, 1991; Boussaoud et al., 1990) and has been proposed to be a region of convergence and integration of form and motion signals (Oram & Perrett, 1996). Its neurons respond to visual as well as to somatosensory and auditory stimuli (Bruce, Desimone, & Gross, 1981); they have large, gaze centered, receptive fields, and they show selectivity to visual motion similar to that observed in Areas MT and MST (K. C. Anderson & Siegel, 1999; Oram, Perrett, & Hietanen, 1993). Some neurons also respond particularly well to biological motion, such as that made by a walking person (K. C.Anderson & Siegel, 1998; Perrett et al., 1985; Oram & Perrett, 1996).
Area 7a
Area 7a constitutes the final stage in the hierarchy within the dorsal visual stream and is interconnected with a wide range of cortical and subcortical regions providing visual and visuomotor signals important for the execution of visually guided behavior. It receives inputs fromAreas LIPand MST, as well as from other visually responsive areas in the parietal cortex (Andersen, Asanuma, et al., 1990; Cavada & GoldmanRakic, 1989). It sends ascending projections to the prefrontal cortex (Cavada & Goldman-Rakic, 1989; Neal, Pearson, & Powell, 1990; Selemon & Goldman-Rakic, 1988) as well as to the inferotemporal cortex, LIP, STPa, and the basal ganglia (for review, see Siegel & Read, 1997). Neurons in Area 7a have large receptive fields that are often bilateral (Blatt et al., 1990). They respond to visual stimuli (Mountcastle, Lynch, Georgopoulos, Sakata & Acuna, 1975; Robinson et al., 1978) and are active during fixation and visual tracking eye movements (Bremmer, Distler, & Hoffmann, 1997; Kawano, Sasaki, & Yamashita, 1984; Sakata, Shibutani, & Kawano, 1983). Because the activity of these neurons is largely not affected by changes in body or head position during saccades to specific retinal locations, it is likely that these cells encode information in world-referenced coordinates (Snyder et al., 1998).
Some neurons in Area 7a possess properties similar to those encountered at preceding stages of processing in the dorsal visual stream. These neurons are sensitive to complex visual motion, exhibiting selectivity to rotational motion (Sakata, Shibutani, Ito, & Tsurugai, 1986; Sakata, Shibutani, Ito, Tsurugai, Mine, & Kusunoki, 1994), to the optic flow patterns, and to rotational motion components (Phinney & Siegel, 2000; Read & Siegel, 1997; Siegel & Read, 1997).
A number of studies have shown that responses of 7a neurons are modulated by the behavioral relevance of the stimulus appearing in the receptive field (Mountcastle,Andersen, & Motter, 1981; Robinson et al., 1978).Asalient or behaviorally relevant object appearing in a nonattended location can enhance the activity of a neuron, whereas the same object appearing in the attended region often reduces its activity (Constantinidis & Steinmetz, 2001; Steinmetz, Connor, Constantinidis, & McLaughlin, 1994). This phenomenon— also observed in LIP neurons (Powell & Goldberg, 2000)— suggests thatArea 7a together with LIP may play a role in the control of spatial attention.
Other Vision-Related Areas in Parietal Cortex
There are a number of less studied visually responsive areas in the parietal cortex; little is known about their role in visually guided behavior. Some of these areas appear to be associated with somatosensory and motor-cortical areas. Among these areas are V6 and V6A (Galletti, Fattori, Battaglini, Shipp, & Zeki, 1996; Nakamura, Chung, Graziano, & Gross, 1999), the medial intraparietal area (area MIP), the medial dorsal parietal area (MDP), and Area 7m (Ferraina et al., 1997; P. B. Johnson, Ferraina, Bianchi, & Caminiti, 1996; Luppino, Murata, Govoni, & Matelli, 1999).
Area FST contains visually responsive neurons with large receptive fields at the center of gaze and—unlike STPa—has limited directional selectivity (Desimone & Ungerleider, 1986). Little is known about the function of this area, which appears to lie at a level similar to that of MST within the visual hierarchy.
Cognitive Modulation of Cortical Activity: Visual Attention
With the use of a number of simple but effective behavioral paradigms such as change blindness and attentional blindness (Rensink, 2000), it has become clear that visual attention is necessaryfortheconstructionofthevisualworldweperceive. These behavioral paradigms demonstrate that without the ability to allocate attention, detecting even large changes in the visual world becomes difficult. In the laboratory, directing attention to a specific location of the visual field speeds up detection and increases sensitivity to visual stimuli presented at that location (Bashinski & Bacharach, 1980; Bowman, Brown, Kertzman, Schwarz, & Robinson, 1993; Posner, 1980; Yantis & Jonides, 1984). Neurophysiological correlates of this enhancement have been found in many visual areas, including V1 (Ito & Gilbert, 1999; Roelfsema, Lamme, & Spekreijse, 1998), V2 (Luck, Chelazzi, Hillyard, & Desimone, 1997; Reynolds, Chelazzi, & Desimone, 1999), V3A (Nakamura & Colby, 2000), V4 (Fischer & Boch, 1981; McAdams & Maunsell, 1999; Moran & Desimone, 1985; Reynolds, Pasternak, & Desimone, 2000), MT, and MST (Seidemann & Newsome, 1999; Treue & Maunsell, 1996).
Effects of attention on processing of visual stimuli have been found already at the V1 level. For example, Ito and Gilbert (1999) have shown that although the attentional state of an animal has no detectable effect on responses to oriented stimuli placed in the receptive field, it affects neuronal activity when these stimuli are surrounded by flanking lines placed outside the receptive field. The authors proposed that this modulation is accomplished by feedback connections from higher-order cortical areas.
The enhancement of neural activity associated with the demand of the behavioral task has been studied most extensively in Area V4. Neurons in this area show enhanced responses to visual stimuli when they become the target of a saccade (Fischer & Boch, 1981; Moore, Tolias, & Schiller, 1998) or when a single stimulus used by the monkey in the discrimination task is placed in the receptive field (McAdams & Maunsell, 1999; Motter, 1994; Reynolds, Pasternak, & Desimone, 2000). This attentional enhancement is greatest when the discriminative stimulus is presented at nearthreshold contrasts, resulting in an increase in neuronal sensitivity to contrast (Reynolds et al., 2000; Figure 6.20). Attentional effects on neuronal firing are even more pronounced when two stimuli are placed within the receptive field of a V4 neuron; in this case, the response is primarily driven by the attended stimulus (Moran & Desimone, 1985; Reynolds et al., 1999). These observations lead to the hypothesis that within the circuitry of extrastriate cortex, there is a mechanism that gates out the unattended stimulus (Desimone, 1998)—and that this gating may be due to the interaction between neighboring receptive fields (Connor, Preddie, Gallant, & Van Essen, 1997). In animals with lesions in V4, attention appears to be automatically allocated to the most salient stimulus, suggesting that the mechanism that controls the gating may include neurons within V4 (De Weerd, Peralta, Desimone, & Ungerleider, 1999; Schiller, 1993).
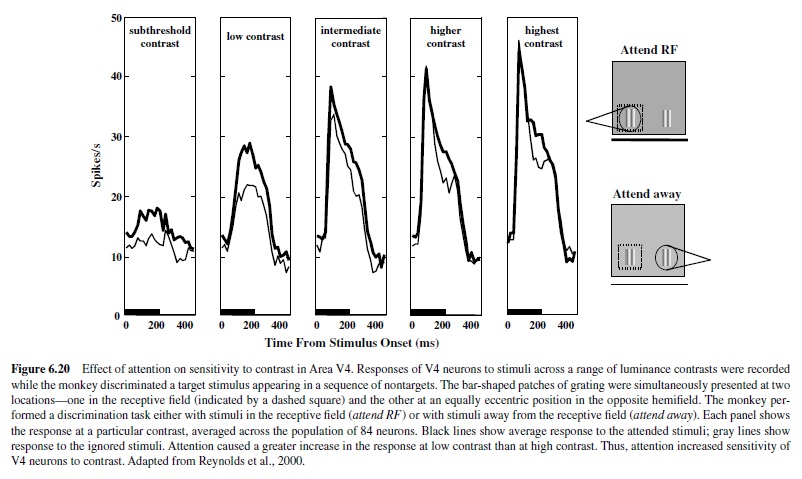
Although earlier studies identified V4 and the ventral visual stream as one of the main sites of attentional influences on visual processing, a number of recent studies have demonstrated similar influences in visual cortical areas within the dorsal visual stream. For example, Treue and Maunsell (1999) have shown that directing attention to the receptive field in Areas MT and MST results in an increase in neuronal firing. This effect was more pronounced when two spots moving in the preferred and the nonpreferred direction were placed in the receptive field; attention was directed from the nonpreferred to the preferred direction. In a subsequent study, Treue and Martinez Trujillo (1999) have demonstrated that attention increases the gain of directionselective neurons. These effects are similar to those found in V4 and show that attention enhances the representation of the attended stimuli and reduces the influence of unattended stimuli.
Cognitive Modulation of Cortical Activity: Visual Memory
Traditionally, sensory cortical areas have not been viewed as regions that play a role in retaining information about the stimuli they process. However, there is now accumulating evidence of the active involvement of sensory areas in neuronal circuitry underlying temporary storage of this information (Fuster, 1997). This type of storage—often referred to as working memory—remains active for only a few seconds and is distinct from long-term memory (Squire, 1987). Its major function is to briefly retain information to be used in specific tasks, a function fundamental to the successful execution of visually guided behaviors.
Much of the neurophysiological work studying the neural mechanisms of visual working memory has focused on IT, which represents a relatively advanced stage of processing within the ventral visual stream (Merigan & Maunsell, 1993). Such studies have reported that IT neurons of monkeys trained to remember visual properties of objects and maintain an elevated firing rate during the delay after a specific color, shape, or location is presented (e.g. Fuster, 1990; Miller, Li, & Desimone, 1993; Miyashita & Chang, 1988). These results have been interpreted as evidence that these neurons may be involved in the short-term storage of information about stimulus form, color, or location. Neurons in V4, which provide a major input to IT, also show enhanced responses to previously cued visual stimuli (e.g., Ferrera et al., 1994; Motter, 1994). Furthermore, there is also some evidence that lesions of V4 affect performance of some memory-related tasks (Desimone, Lehky, Ungerleider, & Mishkin, 1990; Walsh, Le Mare, Blaimire, & Cowey, 2000).
Within the dorsal visual stream, memory-related activity has been reported in Area 7a for motion (Ferrera et al., 1994) and in spatial memory tasks in Areas 7a and LIP (Barash et al., 1991b; Constantinidis & Steinmetz, 1996), although it is not clear whether this latter activity represents short-term memory per se or whether it is a neural mechanism used to track the spatial locations of previously identified objects of importance. Neurons in MT do not show the same sustained pattern of memory-related activity as neurons in 7a, V4, or IT (Ferrera et al., 1994). However, there is accumulating evidence that this area shows a pattern of activation during the delay that is indicative of its participation in storage of visual information (Droll, Bisley, & Pasternak, 2000). This observation is consistent with the suggestion provided by lesion and microstimulation studies that MT may be involved in storing the information it encodes (Bisley & Pasternak, 2000; Bisley et al., 2001).
Concluding Remarks
In recent years the visual system of nonhuman primates has become the system of choice in the study of neural mechanisms underlying visual perception. One reason is the apparent similarity in visual function between old-world monkeys and humans.The second reason is that the development of behavioral and neurophysiological procedures has provided an opportunity to record neural activity in monkeys that can be directly related to visually guided behavior. These techniques have provided new insights into the properties of visually responsive neurons at various stages of cortical analysis. The first—and perhaps most important—realization that emerged from these studies is that visual cortical (and probably thalamic) neurons are not simply passive processors of any stimulus that appears on the retina as long as the stimulus matches the preferences of its receptive field. There is now evidence that as early in processing as the primary visual cortex, responses of neurons are defined not only by the properties of thevisualstimulus,butalsobyitsbehavioralsignificance.The modulation of neuronal responses by the behavioral significance of a stimulus has been well documented in Areas V2 and V4, in MT, and in the posterior parietal cortex. The results reported by many of these studies suggest that some of the characteristics of cortical receptive fields established in experiments performed with anesthetized animals may have to be reexamined. Another feature of visual cortical neurons that emerged from combining neurophysiological recordings with behavioral testing is their ability to change their receptive fields as a result of training. This plasticity has until recently been considered to be the property of a developing brain; however, it appears to be present in the adult inferotemporal cortex (Kobatake et al., 1998) and has been documented in striate cortex (Crist, Li, & Gilbert, 2001).There is also accumulating evidence that visual cortical neurons—particularly those at middle and later stages of analysis—not only are involved in processing visual information, but also participate in circuits underlying its storage (see Fuster, 1995).These results further emphasize the dynamic and plastic nature of neural circuitry underlying processing of visual information. They also point to the continued participation of this circuitry in more cognitive processes (e.g., memory and learning)—processes that until recently have been thought to be localized to regions outside of traditionally defined sensory systems.
These developments call for the application of approaches that would allow examination of the neural basis of visually guided behaviors by simultaneously monitoring the activity of wider brain regions. Functional magnetic resonance imaging (fMRI), is one such technique. Introduced only about 10 years ago, fMRI has become widely used in the study of neural activity-related signals associated with visual processing in humans (Courtney & Ungerleider, 1997; Wandell, 1999). The development of this approach with nonhuman primates should provide an important tool for simultaneously examining neural activity in multiple brain regions during the performance of visual-guided behaviors; several laboratories have recently begun successful efforts in that direction (Dubowitz et al., 1998; Logothetis, Guggenberger, Peled, & Pauls, 1999; Stefanacci et al., 1998).Another important approach to examining the activity of neuronal ensembles in multiple brain regions is simultaneous microelectrode recordings from multiple brain regions. This valuable tool has already been appliedinseverallaboratorieswithsomesuccess(seeNowak, Munk, James, Girard, & Bullier, 1999; Varela, Lachaux, Rodriguez, & Martinerie, 2001) and holds great promise.
Bibliography:
- Adelson, E. H., & Movshon, J. A. (1982). Phenomenal coherence of moving visual patterns. Nature, 300, 523–525.
- Albright, T. D. (1984). Direction and orientation selectivity of neurons in visual area MT of the macaque. Journal of Neurophysiology, 52, 1106–1130.
- Allman, J. M., & Kaas, J. H. (1971). A representation of the visual field in the caudal third of the middle tempral gyrus of the owl monkey (Aotus trivirgatus). Brain Research, 31, 85–105.
- Allman, J. M., Miezin, F., & McGuinness, E. (1985). Direction- and velocity-specific responses from beyond the classical receptive field in the middle temporal visual area (MT). Perception, 14, 105–126.
- Amaral, D. G., & Price, J. L. (1984). Amygdalo-cortical projections in the monkey (Macaca fascicularis). Journal of Comparative Neurology, 230, 465–496.
- Andersen, R. A. (1997). Multimodal integration for the representation of space in the posterior parietal cortex.Philosophical Transactions of the Royal Society, London, 352B, 1421–1428.
- Andersen, R. A., Asanuma, C., & Cowan, W. M. (1985). Callosal and prefrontal associational projecting cell populations in area 7A of the macaque monkey: A study using retrogradely transported fluorescent dyes. Journal of Comparative Neurology, 232, 443–455.
- Andersen, R. A., Asanuma, C., Essick, G., & Siegel, R. M. (1990). Corticocortical connections of anatomically and physiologically defined subdivisions within the inferior parietal lobule. Journal of Comparative Neurology, 296, 65–113.
- Andersen, R. A., Bracewell, R. M., Barash, S., Gnadt, J. W., & Fogassi, L. (1990). Eye position effects on visual, memory, and saccade-related activity in areas LIP and 7a of macaque. Journal of Neuroscience, 10, 1176–1196.
- Andersen, R. A., Shenoy, K. V., Snyder, L. H., Bradley, D. C., & Crowell, J. A. (1999). The contributions of vestibular signals to the representations of space in the posterior parietal cortex. Annals of the New York Academy of Sciences, 871, 282–292.
- Andersen, R. A., Snyder, L. H., Bradley, D. C., & Xing, J. (1997). Multimodal representation of space in the posterior parietal cortex and its use in planning movements. Annual Review of Neuroscience, 20, 303–330.
- Anderson, K. C., & Siegel, R. M. (1998). Lack of selectivity for simple shapes defined by motion and luminance in STPa of the behaving macaque. Neuroreport, 9, 2063–2070.
- Anderson, K. C., & Siegel, R. M. (1999). Optic flow selectivity in the anterior superior temporal polysensory area, STPa, of the behaving monkey. Journal of Neuroscience, 19, 2681–2692.
- Anderson, S. A., Mullen, K. T., & Hess, R. F. (1991). Human peripheral spatial resolution for achromatic and chromatic stimuli: Limits imposed by optical and retinal factors. Journal of Physiology, 442, 47–64.
- Azzopardi, P., & Cowey, A. (1993). Preferential representation of the fovea in the primary visual cortex. Nature, 361, 719–721.
- Baizer, J. S., Ungerleider, L. G., & Desimone, R. (1991). Organization of visual inputs to the inferior temporal and posterior parietal cortex in macaques. Journal of Neuroscience, 11, 168– 190.
- Bakin, J. S., Nakayama, K., & Gilbert, C. D. (2000). Visual responses in monkey areas V1 and V2 to three-dimensional surface configurations. Journal of Neuroscience, 20, 8188–8198.
- Baleydier, C., & Morel, A. (1992). Segregated thalamocortical pathways to inferior parietal and inferotemporal cortex in macaque monkey. Visual Neuroscience, 8, 391–405.
- Barash, S., Bracewell, R. M., Fogassi, L., Gnadt, J. W., & Andersen, R. A. (1991a). Saccade-related activity in the lateral intraparietal area: I. Temporal properties; comparison with area 7a. Journal of Neurophysiology, 66, 1095–1108.
- Barash, S., Bracewell, R. M., Fogassi, L., Gnadt, J. W., & Andersen, R. A. (1991b). Saccade-related activity in the lateral intraparietal area: II. Spatial properties. Journal of Neurophysiology, 66, 1109–1124.
- Bashinski, H. S., & Bacharach, V. R. (1980). Enhancement of perceptual sensitivity as the result of selectively attending to spatial locations. Perception and Psychophysics, 28, 241–248.
- Baylor, D. A., Nunn, B. J., & Schnapf, J. L. (1987). Spectral sensitivity of cones of the monkey Macaca fascicularis. Journal of Physiology, 390, 145–160.
- Bear, M. F., Connors, B., & Paradiso, M. A. (1996). Neuroscience: Exploring the brain. New York: Williams and Wilkins.
- Beck, P. D., & Kaas, J. H. (1999). Cortical connections of the dorsomedial visual area in old world macaque monkeys. Journal of Comparative Neurology, 406, 487–502.
- Ben Hamed, S., Duhamel, J.-R., Bremmer, F., & Graf, W. (2001). Representation of the visual field in the lateral intraparietal area of macaque monkeys: A quantitative receptive field analysis. Experimental Brain Research, 140, 127–144.
- Bisley, J. W., & Pasternak, T. (2000). The multiple roles of visual cortical areas MT/MST in remembering the direction of visual motion. Cerebral Cortex, 10, 1053–1065.
- Bisley, J. W., Zaksas, D., & Pasternak, T. (2001). Microstimulation of cortical area MT affects performance on a visual working memory task. Journal of Neurophysiology, 85, 187–196.
- Blasco, B., Avendano, C., & Cavada, C. (1999). A stereological analysis of the lateral geniculate nucleus in adult Macaca nemestrina Visual Neuroscience, 16, 933–941.
- Blasdel, G. G., & Lund, J. S. (1983). Termination of afferent axons in macaque striate cortex. Journal of Neuroscience, 3, 1389– 1413.
- Blasdel, G. G., & Salama, G. (1986). Voltage-sensitive dyes reveal a modular organization in monkey striate cortex. Nature, 321, 579–585.
- Blatt, G. J., Andersen, R. A., & Stoner, G. R. (1990). Visual receptive field organization and cortico-cortical connections of the lateral intraparietal area (area LIP) in the macaque. Journal of Comparative Neurology, 299, 421–445.
- Born, R. T., & Tootell, R. B. (1991). Spatial frequency tuning of single units in macaque supragranular striate cortex. Proceedings of the National Academy of Sciences, USA, 88, 7066–7070.
- Boussaoud, D., Desimone, R., & Ungerleider, L. G. (1991). Visual topography of area TEO in the macaque. Journal of Comparative Neurology, 306, 554–575.
- Boussaoud, D., Ungerleider, L. G., & Desimone, R. (1990). Pathways for motion analysis: Cortical connections of the medial superior temporal and fundus of the superior temporal visual areas in the macaque. Journal of Comparative Neurology, 296, 462–495.
- Bowman, E. M., Brown, V. J., Kertzman, C., Schwarz, U., & Robinson, D. L. (1993). Covert orienting of attention in macaques: I. Effects of behavioral context. Journal of Neurophysiology, 70, 431–443.
- Boycott, B. B., & Hopkins, J. M. (1991). Cone bipolar cells and cone synapses in the primate retina. Visual Neuroscience, 7, 49–60.
- Boycott, B. B., & Hopkins, J. M. (1997). The cone synapses of cone bipolar cells of primate retina. Journal of Neurocytology, 26, 313–325.
- Boyd, J. D., & Casagrande, V. A. (1999). Relationships between cytochrome oxidase (CO) blobs in primate primary visual cortex (V1) and the distribution of neurons projecting to the middle temporal area (MT). Journal of Comparative Neurology, 409, 573–591.
- Bradley, D. C., Chang, G. C., & Andersen, R. A. (1998). Encoding of three-dimensional structure-from-motion by primate area MT neurons. Nature, 392, 714–717.
- Bradley, D. C., Maxwell, M., Andersen, R. A., Banks, M. S., & Shenoy, K. V. (1996). Mechanisms of heading perception in primate visual cortex. Science, 273, 1544–1547.
- Bradley, D. C., Qian, N., & Andersen, R. A. (1995). Integration of motion and stereopsis in middle temporal cortical area of macaques. Nature, 373, 609–611.
- Bremmer, F., Distler, C., & Hoffmann, K. P. (1997). Eye position effects in monkey cortex: II. Pursuit-and fixation- related activity in posterior parietal areas LIP and 7A. Journal of Neurophysiology, 77, 962–977.
- Bremmer, F., Graf, W., Ben Hamed, S., & Duhamel, J. R. (1999). Eye position encoding in the macaque ventral intraparietal area (VIP). Neuroreport, 10, 873–878.
- Britten, K. H. (1998). Clustering of response selectivity in the medial superior temporal area of extrastriate cortex in the macaque monkey. Visual Neuroscience, 15, 553–558.
- Britten, K. H., & Newsome, W. T. (1998). Tuning bandwidths for near-threshold stimuli in area MT. Journal of Neurophysiology, 80, 762–770.
- Britten, K. H., Newsome, W. T., & Saunders, R. C. (1992). Effects of inferotemporal cortex lesions on form-from-motion discrimination in monkeys. Experimental Brain Research, 88, 292– 302.
- Britten, K. H., Shadlen, M. N., Newsome, W. T., & Movshon, J. A. (1992). The analysis of visual motion: Acomparison of neuronal and psychophysical performance. Journal of Neuroscience, 12, 4745–4765.
- Britten, K. H., Shadlen, M. N., Newsome, W. T., & Movshon, J. A. (1993). Responses of neurons in macaque MT to stochastic motion signals. Visual Neuroscience, 10, 1157–1169.
- Britten, K. H., & van Wezel, R. J. (1998). Electrical microstimulation of cortical area MST biases heading perception in monkeys. Nature Neuroscience, 1, 59–63.
- Bruce, C., Desimone, R., & Gross, C. G. (1981). Visual properties of neurons in a polysensory area in superior temporal sulcus of the macaque. Journal of Neurophysiology, 46, 369–384.
- Buckley, M. J., Gaffan, D., & Murray, E. A. (1997). Functional double dissociation between two inferior temporal cortical areas: Perirhinal cortex versus middle temporal gyrus. Journal of Neurophysiology, 77, 587–598.
- Bullier, J., & Kennedy, H. (1983). Projection of the lateral geniculate nucleus onto cortical area V2 in the macaque monkey. Experimental Brain Research, 53, 168–172.
- Bullier, J., Schall, J. D., & Morel, A. (1996). Functional streams in occipito-frontal connections in the monkey. Behavioural Brain Research, 76, 89–97.
- Buracas, G. T., & Albright, T. D. (1996). Contribution of area MT to perception of three-dimensional shape: A computational study. Vision Research, 36, 869–887.
- Burkhalter, A., & Van Essen, D. C. (1986). Processing of color, form and disparity information in visual areas VP and V2 of ventral extrastriate cortex in the macaque monkey. Journal of Neuroscience, 6, 2327–2351.
- Calkins, D. J. (1999). Synaptic organization of cone pathways in the primate retina. In K. Gegenfurtner & L. Sharpe (Eds.), Color vision: From molecular genetics to perception. New York: Cambridge University Press.
- Calkins, D. J. (2001). Seeing with S cones. Progress in Retinal and Eye Research, 20, 255–287.
- Calkins, D. J., & Sterling, P. (1999). Evidence that circuits for spatial and color vision segregate at the first retinal synapse. Neuron, 24, 313–321.
- Calkins, D. J., Tsukamoto, Y., & Sterling, P. (1998). Microcircuitry and mosaic of a blue-yellow ganglion cell in the primate retina. Journal of Neuroscience, 18, 3373–3385.
- Casagrande, V. A., & Kaas, J. H. (1994). The afferent, intrinsic, and efferent connections of primary visual cortex in primates. In E. G. Jones, A. Peters (Series Eds.), A. Peters, & K. S. Rockland (Vol. Eds.), Cerebral cortex: Vol. 10. Primary visual cortex in primates (pp. 201–259). New York: Plenum Press.
- Cavada, C., & Goldman-Rakic, P. S. (1989). Posterior parietal cortex in rhesus monkey: I. Parcellation of areas based on distinctive limbic and sensory corticocortical connections. Journal of Comparative Neurology, 287, 393–421.
- Cheng, K., Hasegawa, T., Saleem, K. S., & Tanaka, K. (1994). Comparison of neuronal selectivity for stimulus speed, length, and contrast in the prestriate visual cortical areas V4 and MT of the macaque monkey. Journal of Neurophysiology, 71, 2269–2280.
- Cheng, K., Saleem, K. S., & Tanaka, K. (1997). Organization of corticostriatal and corticoamygdalar projections arising from the anterior inferotemporal area TE of the macaque monkey: A Phaseolus vulgaris leucoagglutinin study. Journal of Neuroscience, 17, 7902–7925.
- Colby, C. L., Duhamel, J. R., & Goldberg, M. E. (1993). Ventral intraparietal area of the macaque:Anatomic location and visual response properties. Journal of Neurophysiology, 69, 902–914.
- Colby, C. L., Duhamel, J. R., & Goldberg, M. E. (1996). Visual, presaccadic, and cognitive activation of single neurons in monkey lateral intraparietal area. Journal of Neurophysiology, 76, 2841– 2852.
- Colby, C. L., Gattass, R., Olson, C. R., & Gross, C. G. (1988). Topographical organization of cortical afferents to extrastriate visual area PO in the macaque: Adual tracer study. Journal of Comparative Neurology, 269, 392–413.
- Colby, C. L., & Olson, C. R. (1999). Spatial cognition. In M. J. Zigmond,F.E.Bloom,S.C.Landis,&L.R.Squire(Eds.),Fundamental neuroscience (pp. 1363–1383). London: Academic Press.
- Connor, C. E., Preddie, D. C., Gallant, J. L., & Van Essen, D. C. (1997). Spatial attention effects in macaque area V4. Journal of Neuroscience, 17, 3201–3214.
- Constantinidis, C., & Steinmetz, M. A. (1996). Neuronal activity in posterior parietal area 7a during the delay periods of a spatial memory task. Journal of Neurophysiology, 76, 1352–1355.
- Constantinidis, C., & Steinmetz, M. A. (2001). Neuronal responses in area 7a to multiple stimulus displays: II. Responses are suppressed at the cued location. Cerebral Cortex, 11, 592–597.
- Cottaris, N. P., & De Valois, R. L. (1998). Temporal dynamics of chromatic tuning in macaque primary visual cortex. Nature, 395, 896–900.
- Courtney, S. M., & Ungerleider, L. G. (1997). What fMRI has taught us about human vision. Current Opinion in Neurobiology, 7, 554–561.
- Cowey, A., Stoerig, P., & Bannister, M. (1994). Retinal ganglion cells labelled from the pulvinar nucleus in macaque monkeys. Neuroscience, 61, 691–705.
- Crist, R. E., Li, W., & Gilbert, C. D. (2001). Learning to see: Experience and attention in primary visual cortex. Nature Neuroscience, 4, 519–525.
- Croner, L. J., & Albright, T. D. (1999). Segmentation by color influences responses of motion-sensitive neurons in the cortical middle temporal visual area. Journal of Neuroscience, 19, 3935–3951.
- Croner, L. J., & Kaplan, E. (1995). Receptive fields of P and M ganglion cells across the primate retina. Vision Research, 35, 7–24.
- Cumming, B. G., & DeAngelis, G. C. (2001). The physiology of stereopsis. Annual Review of Neuroscience, 24, 203–238.
- Cumming, B. G., & Parker, A. J. (1999). Binocular neurons in V1 of awake monkeys are selective for absolute, not relative, disparity. Journal of Neuroscience, 19, 5602–5618.
- Cumming, B. G., & Parker, A. J. (2000). Local disparity not perceived depth is signaled by binocular neurons in cortical area V1 of the macaque. Journal of Neuroscience, 20, 4758–4767.
- Curcio, C. A., & Harting, J. K. (1978). Organization of pulvinar afferents to area 18 in the squirrel monkey: Evidence for stripes. Brain Research, 143, 155–161.
- Curcio, C. A., Packer, O., & Hendrickson, A. E. (1989). Photoreceptor topography of the retina in the adult pigtail macaque (Macaca nemestrina). The Journal of Comparative Neurology, 288, 165–183.
- Dacey, D. M. (1993). The mosaic of midget ganglion cells in the human retina. Journal of Neuroscience, 13, 5334–5355.
- Dacey, D. M. (1996). Circuitry for color coding in the primate retina. Proceedings of the National Academy of Sciences, USA, 93, 582–588.
- Dacey, D. M. (2000). Parallel pathways for spectral coding in primate retina. Annual Review of Neuroscience, 23, 743–775.
- Dacey, D. M., & Lee, B. B. (1994). The blue-on opponent pathway in primate retina originates from a distinct bistratified ganglion cell type. Nature, 367, 731–735.
- Dacey, D. M., Packer, O. S., Diller, L., Brainard, D., Peterson, B., & Lee, B. (2000). Center surround receptive field structure of cone bipolar cells in primate retina. Vision Research, 40, 1801–1811.
- Dean, P. (1979). Visual cortex ablation and thresholds for successively presented stimuli in rhesus monkeys: II. Hue. Experimental Brain Research, 35, 69–83.
- DeAngelis, G. C., Cumming, B. G., & Newsome, W. T. (1998). Cortical area MT and the perception of stereoscopic depth. Nature, 394, 677–680.
- DeAngelis, G. C., & Newsome, W. T. (1999). Organization of disparity-selective neurons in macaque area MT. Journal of Neuroscience, 19, 1398–1415.
- Derrington, A. M., Krauskopf, J., & Lennie, P. (1984). Chromatic mechanisms in lateral geniculate nucleus of macaque. Journal of Physiology, 357, 241–265.
- Derrington, A. M., & Lennie, P. (1984). Spatial and temporal contrast sensitivities of neurones in lateral geniculate nucleus of macaque. Journal of Physiology, 357, 219–240.
- Desimone, R. (1998). Visual attention mediated by biased competition in extrastriate visual cortex. Philosophical Transactions of the Royal Society, London, 353B, 1245–1255.
- Desimone, R., Albright, T. D., Gross, C. G., & Bruce, C. (1984). Stimulus-selective properties of inferior temporal neurons in the macaque. Journal of Neuroscience, 4, 2051–2062.
- Desimone, R., & Gross, C. G. (1979). Visual areas in the temporal cortex of the macaque. Brain Research, 178, 363–380.
- Desimone, R., Li, L., Lehky, S., Ungerleider, L. G., & Mishkin, M. (1990). Effects of V4 lesions on visual discrimination performance and responses of neurons in inferior temporal cortex. Neuroscience Abstracts, 16,
- Desimone, R., & Schein, S. J. (1987). Visual properties of neurons in area V4 of the macaque: Sensitivity to stimulus form. Journal of Neurophysiology, 57, 835–868.
- Desimone, R., Schein, S. J., Moran, J., & Ungerleider, L. G. (1985). Contour, color and shape analysis beyond the striate cortex. Vision Research, 25, 441–452.
- Desimone, R., & Ungerleider, L. G. (1986). Multiple visual areas in the caudal superior temporal sulcus of the macaque. Journal of Comparative Neurology, 248, 164–189.
- De Valois, R. L., Albrecht, D. G., & Thorell, L. G. (1982). Spatial frequency selectivity of cells in macaque visual cortex. Vision Research, 22, 545–559.
- DeVries, S. H. (2000). Bipolar cells use kainate and AMPA receptors to filter visual information into separate channels. Neuron, 28, 847–856.
- De Weerd, P., Desimone, R., & Ungerleider, L. G. (1996). Cue-dependent deficits in grating orientation discrimination after V4 lesions in macaques. Visual Neuroscience, 13, 529–538.
- De Weerd, P., Peralta, M. R., III, Desimone, R., & Ungerleider, L. G. (1999). Loss of attentional stimulus selection after extrastriate cortical lesions in macaques. Nature Neuroscience, 2, 753–758.
- DeYoe, E. A., & Van Essen, D. C. (1985). Segregation of efferent connections and receptive field properties in visual area V2 of the macaque. Nature, 317, 58–61.
- Dineen, J., & Keating, E. G. (1981). The primate visual system after bilateral removal of striate cortex: Survival of complex pattern vision. Experimental Brain Research, 41, 338–345.
- Distler, C., Boussaoud, D., Desimone, R., & Ungerleider, L. G. (1993). Cortical connections of inferior temporal area TEO in macaque monkeys. Journal of Comparative Neurology, 334,125–150.
- Dodd, J. V., Krug, K., Cumming, B. G., & Parker, A. J. (2001). Perceptually bistable three-dimensional figures evoke high choice probabilities in cortical area MT. Journal of Neuroscience, 21, 4809–4821.
- Dow, B. M., Snyder, A. Z., Vautin, R. G., & Bauer, R. (1981). Magnification factor and receptive field size in foveal striate cortex of the monkey. Experimental Brain Research, 44, 213–228.
- Drasdo, N., & Fowler, C. W. (1974). Non-linear projection of the retinal image in a wide-angle schematic eye. British Journal of Opthalmology, 58, 709–714.
- Droll, J. A., Bisley, J. W., & Pasternak, T. (2000). Delay activity in area MT neurons during a visual working memory task. Investigative Ophthalmology and Visual Science Supplement (Abstracts), 41,
- Dubowitz, D. J., Chen, D. Y., Atkinson, D. J., Grieve, K. L., Gillikin, B., Bradley, W. G., et al. (1998). Functional magnetic resonance imaging in macaque cortex. Neuroreport, 9, 2213–2218.
- Duffy, C. J. (1998). MST neurons respond to optic flow and translational movement. Journal of Neurophysiology, 80, 1816–1827.
- Duffy, C. J., & Wurtz, R. H. (1991). Sensitivity of MST neurons to optic flow stimuli: I. A continuum of response selectivity to large-field stimuli. Journal of Neurophysiology, 65, 1329–1345.
- Duffy, C. J., & Wurtz, R. H. (1997). Planar directional contributions to optic flow responses in MST neurons. Journal of Neurophysiology, 77, 782–796.
- Duhamel, J. R., Bremmer, F., Ben Hamed, S., & Graf, W. (1997). Spatial invariance of visual receptive fields in parietal cortex neurons. Nature, 389, 845–848.
- Duhamel, J. R., Colby, C. L., & Goldberg, M. E. (1992). The updating of the representation of visual space in parietal cortex by intended eye movements. Science, 255, 90–92.
- Duhamel, J. R., Colby, C. L., & Goldberg, M. E. (1998). Ventral intraparietal area of the macaque: Congruent visual and somatic response properties. Journal of Neurophysiology, 79, 126–136.
- Duncan, R. O., Albright, T. D., & Stoner, G. R. (2000). Occlusion and the interpretation of visual motion: Perceptual and neuronal effects of context. Journal of Neuroscience, 20, 5885–5897.
- Dursteler, M. R., & Wurtz, R. H. (1988). Pursuit and optokinetic deficits following chemical lesions of cortical areas MT and MST. Journal of Neurophysiology, 60, 940–965.
- Dursteler, M. R., Wurtz, R. H., & Newsome, W. T. (1987). Directional pursuit deficits following lesions of the foveal representation within the superior temporal sulcus of the macaque monkey. Journal of Neurophysiology, 57, 1262–1287.
- Edwards, D. P., Purpura, K. P., & Kaplan, E. (1995). Contrast sensitivity and spatial frequency response of primate cortical neurons in and around the cytochrome oxidase blobs. Vision Research, 35, 1501–1523.
- Eifuku, S., & Wurtz, R. H. (1998). Response to motion in extrastriate area MSTl: Center-surround interactions. Journal of Neurophysiology, 80, 282–296.
- Eifuku, S., & Wurtz, R. H. (1999). Response to motion in extrastriate area MSTl: Disparity sensitivity. Journal of Neurophysiology, 82, 2462–2475.
- Erisir, A., Van Horn, S. C., & Sherman, S. M. (1997). Relative numbers of cortical and brainstem inputs to the lateral geniculate nucleus. Proceedings of the National Academy of Sciences, USA, 94, 1517–1520.
- Eskandar, E. N., & Assad, J. A. (1999). Dissociation of visual, motor and predictive signals in parietal cortex during visual guidance. Nature Neuroscience, 2, 88–93.
- Essen, D. C., & Zeki, S. M. (1978). The topographic organization of rhesus monkey prestriate cortex. Journal of Physiology, 277, 193–226.
- Famiglietti, E. V., Jr., & Kolb, H. (1976). Structural basis for ON- and OFF-center responses in retinal ganglion cells. Science, 194, 193–195.
- Farah, M. J., Humphreys, G. W., & Rodman, H. R. (1999). Object and face recognition. In M. J. Zigmond, F. E. Bloom, S. C. Landis, J. L. Roberts, & L. R. Squire (Eds.), Fundamental neuroscience (pp. 1339–1361). London: Academic Press.
- Felleman, D. J., Burkhalter, A., & Van Essen, D. C. (1997). Cortical connections of areas V3 and VP of macaque monkey extrastriate visual cortex. Journal of Comparative Neurology, 379, 21–47.
- Felleman, D. J., & Van Essen, D. C. (1987). Receptive field properties of neurons in area V3 of macaque monkey extrastriate cortex. Journal of Neurophysiology, 57, 889–920.
- Felleman, D. J., & Van Essen, D. C. (1991). Distributed hierarchical processing in the primate cerebral cortex. Cerebral Cortex, 1, 1–47.
- Felleman, D. J., Xiao, Y., & McClendon, E. (1997). Modular organization of occipito-temporal pathways: Cortical connections between visual area 4 and visual area 2 and posterior inferotemporal ventral area in macaque monkeys. Journal of Neuroscience, 17, 3185–3200.
- Ferraina, S., Garasto, M. R., Battaglia-Mayer, A., Ferraresi, P., Johnson, P. B., Lacquaniti, F., et al. (1997). Visual control of hand-reaching movement: Activity in parietal area 7 m. European Journal of Neuroscience, 9, 1090–1095.
- Ferrera, V. P., Rudolph, K. K., & Maunsell, J. H. (1994). Responses of neurons in the parietal and temporal visual pathways during a motion task. Journal of Neuroscience, 14, 6171– 6186.
- Fischer, B., & Boch, R. (1981). Selection of visual targets activates prelunate cortical cells in trained rhesus monkey. Experimental Brain Research, 41, 431–433.
- Foster, K. H., Gaska, J. P., Nagler, M., & Pollen, D. A. (1985). Spatial and temporal frequency selectivity of neurones in visual cortical areas V1 and V2 of the macaque monkey. Journal of Physiology, 365, 331–363.
- Freed, M. A., Smith, R. G., & Sterling, P. (1992). Computational model of the on-alpha ganglion cell receptive field based on bipolar circuitry. Proceedings of the National Academy of Sciences, USA, 89, 236–240.
- Fuster, J. M. (1990). Inferotemporal units in selective visual attention and short-term memory. Journal of Neurophysiology, 64, 681–697.
- Fuster, J. M. (1995). Memory in the cerebral cortex. Cambridge, MA: MIT Press.
- Fuster, J. M. (1997). Network memory. Trends in Neurosciences, 20, 451–459.
- Gallant, J. L., Connor, C. E., Rakshit, S., Lewis, J. W., & Van Essen, D. C. (1996). Neural responses to polar, hyperbolic, and Cartesian gratings in area V4 of the macaque monkey. Journal of Neurophysiology, 76, 2718–2739.
- Galletti, C., & Battaglini, P. P. (1989). Gaze-dependent visual neurons in area V3A of monkey prestriate cortex. Journal of Neuroscience, 9, 1112–1125.
- Galletti, C., Battaglini, P. P., & Fattori, P. (1990). “Real-motion” cells in area V3A of macaque visual cortex. Experimental Brain Research, 82, 67–76.
- Galletti, C., Fattori, P., Battaglini, P. P., Shipp, S., & Zeki, S. (1996). Functional demarcation of a border between areas V6 and V6a in the superior parietal gyrus of the macaque monkey. European Journal of Neuroscience, 8, 30–52.
- Gattass, R., & Gross, C. G. (1981). Visual topography of striate projection zone (MT) in posterior superior temporal sulcus of the macaque. Journal of Neurophysiology, 46, 621–638.
- Gattass, R., Gross, C. G., & Sandell, J. H. (1981). Visual topography of V2 in the macaque. Journal of Comparative Neurology, 201, 519–539.
- Gattass, R., Sousa, A. P., & Gross, C. G. (1988). Visuotopic organization and extent of V3 and V4 of the macaque. Journal of Neuroscience, 8, 1831–1845.
- Gattass, R., Sousa, A. P., Mishkin, M., & Ungerleider, L. G. (1997). Cortical projections of area V2 in the macaque. Cerebral Cortex, 7, 110–129.
- Gegenfurtner, K. R., Kiper, D. C., Beusmans, J. M., Carandini, M., Zaidi, Q., & Movshon, J. A. (1994). Chromatic properties of neurons in macaque MT. Visual Neuroscience, 11, 455–466.
- Gegenfurtner, K. R., Kiper, D. C., & Levitt, J. B. (1997). Functional properties of neurons in macaque area V3. Journal of Neurophysiology, 77, 1906–1923.
- Ghose, G. M., & Ts’o, D. Y. (1997). Form processing modules in primate area V4. Journal of Neurophysiology, 77, 2191–2196.
- Gibson, J. J. (1994). The visual perception of objective motion and subjective movement: 1954. Psychology Review, 101, 318– 323.
- Gilbert, C., Ito, M., Kapadia, M., & Westheimer, G. (2000). Interactions between attention, context and learning in primary visual cortex. Vision Research, 40, 1217–1226.
- Girard, P., & Bullier, J. (1989). Visual activity in area V2 during reversible inactivation of area 17 in the macaque monkey. Journal of Neurophysiology, 62, 1287–1302.
- Girard, P., Salin, P. A., & Bullier, J. (1991). Visual activity in areas V3a and V3 during reversible inactivation of area V1 in the macaque monkey. Journal of Neurophysiology, 66, 1493–1503.
- Glickstein, M. (1988). The discovery of the visual cortex. Scientific American, 259, 118–127.
- Gnadt, J. W., & Andersen, R. A. (1988). Memory related motor planning activity in posterior parietal cortex of macaque. Experimental Brain Research, 70, 216–220.
- Gottlieb, J. P., Kusunoki, M., & Goldberg, M. E. (1998). The representation of visual salience in monkey parietal cortex. Nature, 391, 481–484.
- Grosof, D. H., Shapley, R. M., & Hawken, M. J. (1993). Macaque V1 neurons can signal “illusory” contours. Nature, 365, 550–552.
- Grünert, U., Greferath, U., Boycott, B. B., & Wässle, H. (1993). Parasol (P alpha) ganglion-cells of the primate fovea: Immunocytochemical staining with antibodies against GABAareceptors. Vision Research, 33, 1–14.
- Grünert, U., & Martin, P. R. (1991). Rod bipolar cells in the macaque monkey retina: Immunoreactivity and connectivity. Journal of Neuroscience, 11, 2742–2758.
- Hanazawa, A., & Komatsu, H. (2001). Influence of the direction of elemental luminance gradients on the responses of V4 cells to textured surfaces. Journal of Neuroscience, 21, 4490–4497.
- Hawken, M. J., & Parker, A. J. (1991). Spatial receptive field organization in monkey V1 and its relationship to the cone mosaic. In M. S. Landy & J. A. Movshon (Eds.), Computational models of visual processing (pp. 83–93). Cambridge, MA: MIT Press.
- Hawken, M. J., Parker, A. J., & Lund, J. S. (1988). Laminar organization and contrast sensitivity of direction-selective cells in the striate cortex of the old world monkey. Journal of Neuroscience, 8, 3541–3548.
- Hegde, J., & Van Essen, D. C. (2000). Selectivity for complex shapes in primate visual area V2. Journal of Neuroscience, 20,
- Hendrickson, A. E., Wilson, J. R., & Ogren, M. P. (1978). The neuroanatomical organization of pathways between the dorsal lateral geniculate nucleus and visual cortex in old world and new world primates. Journal of Comparative Neurology, 182, 123–136.
- Hendry, S. H., & Reid, R. C. (2000). The koniocellular pathway in primate vision. Annual Reviews in Neuroscience, 23, 127–153.
- Hendry, S. H., & Yoshioka, T. (1994). A neurochemically distinct third channel in the macaque dorsal lateral geniculate nucleus. Science, 264, 575–577.
- Heywood, C. A., & Cowey, A. (1987). On the role of cortical area V4 in the discrimination of hue and pattern in macaque monkeys. Journal of Neuroscience, 7, 2601–2617.
- Heywood, C. A., Gadotti, A., & Cowey, A. (1992). Cortical area V4 and its role in the perception of color. Journal of Neuroscience, 12, 4056–4065.
- Hicks, T. P., Lee, B. B., & Vidyasagar, T. R. (1983). The responses of cells in macaque lateral geniculate nucleus to sinusoidal gratings. Journal of Physiology, 337, 183–200.
- Hikosaka, K. (1999). Tolerances of responses to visual patterns in neurons of the posterior inferotemporal cortex in the macaque against changing stimulus size and orientation, and deleting patterns. Behavioral Brain Research, 100, 67–76.
- Hinkle, D. A., & Connor, C. E. (2001). Disparity tuning in macaque area V4. Neuroreport, 12, 365–369.
- Hirsch, J. (1984). Quality of the primate photoreceptor lattice and limits of spatial vision. Vision Research, 24, 347–355.
- Horton, J. C. (1984). Cytochrome oxidase patches: A new cytoarchitectonic feature of monkey visual cortex. Philosophical Transactions of the Royal Society, London, 304B, 199–253.
- Hubel, D. H. (1960). Single unit activity in lateral geniculate body and optic tract of unrestrained cats. Journal of Physiology, 150, 91–104.
- Hubel, D. H. (1979). The brain. Scientific American, 241, 44–53.
- Hubel, D. H., & Livingstone, M. S. (1987). Segregation of form, color, and stereopsis in primate area 18. Journal of Neuroscience, 7, 3378–3415.
- Hubel, D. H., & Wiesel, T. N. (1968). Receptive fields and functional architecture of monkey striate cortex. Journal of Physiology, 195, 215–243.
- Hubel, D. H., & Wiesel, T. N. (1977). Ferrier lecture: Functional architecture of macaque monkey visual cortex. Proceedings of the Royal Society, London, 198B, 1–59.
- Humphrey, N. K., & Weiskrantz, L. (1967). Vision in monkeys after removal of the striate cortex. Nature, 215, 595–597.
- Huxlin, K. R., Saunders, R. C., Marchionini, D., Pham, H. A., & Merigan, W. H. (2000). Perceptual deficits after lesions of inferotemporalcortexinmacaques.CerebralCortex,10,671–683.
- Ito, M., & Gilbert, C. D. (1999). Attention modulates contextual influences in the primary visual cortex of alert monkeys. Neuron, 22, 593–604.
- Ito, M., Tamura, H., Fujita, I., & Tanaka, K. (1995). Size and position invariance of neuronal responses in monkey inferotemporal cortex. Journal of Neurophysiology, 73, 218–226.
- Johnson, E. N., Hawken, M. J., & Shapley, R. (2001). The spatial transformation of color in the primary visual cortex of the macaque monkey. Nature Neuroscience, 4, 409–416.
- Johnson, P. B., Ferraina, S., Bianchi, L., & Caminiti, R. (1996). Cortical networks for visual reaching: Physiological and anatomical organization of frontal and parietal lobe arm regions. Cerebral Cortex, 6, 102–119.
- Kaas, J. H., & Huerta, M. F. (1988). The subcortical visual system of primates. In H. D. Steklis (Ed.), Neurosciences: Vol. 4. Comparative primate biology (pp. 327–391). New York: Alan R. Liss.
- Kaas, J. H., & Lyon, D. C. (2001). Visual cortex organization in primates: Theories of V3 and adjoining visual areas. Progress in Brain Research, 134, 285–295.
- Kamermans, M., & Spekreijse, H. (1999). The feedback pathway from horizontal cells to cones: A mini review with a look ahead. Vision Research, 39, 2449–2468.
- Kaplan, E., Lee, B. B., & Shapley, R. M. (1990). New views of primate retinal function. In N. Osborne & J. Chader (Eds.), Progress in retinal research: Vol. 9. (pp. 273–336). Oxford: Pergamon Press.
- Kaplan, E., Purpura, K., & Shapley, R. M. (1988). Background light and the contrast gain of primate P and M retinal ganglion cells. Proceedings of the National Academy of Sciences, USA, 85, 4534–4537.
- Kaplan, E., & Shapley, R. M. (1986). The primate retina contains two types of ganglion cells, with high and low contrast sensitivity. Proceedings of the National Academy of Sciences, USA, 83, 2755–2757.
- Kawano, K., Sasaki, M., & Yamashita, M. (1984). Response properties of neurons in posterior parietal cortex of monkey during visual-vestibular stimulation: I. Visual tracking neurons. Journal of Neurophysiology, 51, 340–351.
- Kawano, K., Shidara, M., Watanabe, Y., & Yamane, S. (1994). Neural activity in cortical area MST of alert monkey during ocular following responses. Journal of Neurophysiology, 71, 2305–2324.
- Keating, E. G. (1979). Rudimentary color vision in the monkey after removal of striate and preoccipital cortex. Brain Research, 179, 379–384.
- Kennedy, H., & Bullier, J. (1985). A double-labeling investigation of the afferent connectivity to cortical areas V1 and V2 of the macaque monkey. Journal of Neuroscience, 5, 2815–2830.
- Knierim, J. J., & Van Essen, D. C. (1992). Neuronal responses to static texture patterns in area V1 of the alert macaque monkey. Journal of Neurophysiology, 67, 961–980.
- Kobatake, E., & Tanaka, K. (1994). Neuronal selectivities to complex object features in the ventral visual pathway of the macaque cerebral cortex. Journal of Neurophysiology, 71, 856–867.
- Kobatake, E., Wang, G., & Tanaka, K. (1998). Effects of shapediscrimination training on the selectivity of inferotemporal cells in adult monkeys. Journal of Neurophysiology, 80, 324–330.
- Komatsu, H., & Wurtz, R. H. (1988). Relation of cortical areas MT and MST to pursuit eye movements: I. Localization and visual properties of neurons. Journal of Neurophysiology, 60, 580–603.
- Komatsu, H., & Wurtz, R. H. (1989). Modulation of pursuit eye movements by stimulation of cortical areas MT and MST. Journal of Neurophysiology, 62, 31–47.
- Lagae, L., Maes, H., Raiguel, S., Xiao, D. K., & Orban, G. A. (1994). Responses of macaque STS neurons to optic flow components: Acomparison of areas MT and MST. Journal of Neurophysiology, 71, 1597–1626.
- Lappe, M., Bremmer, F., Pekel, M., Thiele, A., & Hoffmann, K. P. (1996). Optic flow processing in monkey STS: A theoretical and experimental approach. Journal of Neuroscience, 16, 6265– 6285.
- Lennie, P., Krauskopf, J., & Sclar, G. (1990). Chromatic mechanisms in striate cortex of macaque. Journal of Neuroscience, 10, 649–669.
- Leon, M. I., & Shadlen, M. N. (1998). Exploring the neurophysiology of decisions. Neuron, 21, 669–672.
- Leopold, D. A., & Logothetis, N. K. (1996). Activity changes in early visual cortex reflect monkeys’ percepts during binocular rivalry. Nature, 379, 549–553.
- LeVay, S., Connolly, M., Houde, J., & Van Essen, D. C. (1985). The complete pattern of ocular dominance stripes in the striate cortex and visual field of the macaque monkey. Journal of Neuroscience, 5, 486–501.
- Leventhal, A. G., Rodieck, R. W., & Dreher, B. (1981). Retinal ganglion cell classes in the old world monkey: Morphology and central projections. Science, 213, 1139–1142.
- Leventhal, A. G., Thompson, K. G., Liu, D., Zhou, Y., & Ault, S. J. (1995). Concomitant sensitivity to orientation, direction, and color of cells in layers 2, 3, and 4 of monkey striate cortex. Journal of Neuroscience, 15, 1808–1818.
- Levitt, J. B., Kiper, D. C., & Movshon, J. A. (1994). Receptive fields and functional architecture of macaque V2. Journal of Neurophysiology, 71, 2517–2542.
- Levitt, J. B., Schumer, R. A., Sherman, S. M., Spear, P. D., & Movshon, J. A. (2001). Visual response properties of neurons in the LGN of normally reared and visually deprived macaque monkeys. Journal of Neurophysiology, 85, 2111–2129.
- Levitt, J. B., Yoshioka, T., & Lund, J. S. (1994). Intrinsic cortical connections in macaque visual area V2: Evidence for interaction between different functional streams. Journal of Comparative Neurology, 342, 551–570.
- Livingstone, M. S., & Hubel, D. H. (1983). Specificity of corticocortical connections in monkey visual system. Nature, 304, 531–534.
- Livingstone, M. S., & Hubel, D. H. (1984). Anatomy and physiology of a color system in the primate visual cortex. Journal of Neuroscience, 4, 309–356.
- Livingstone, M. S., & Tsao, D. Y. (1999). Receptive fields of disparity-selective neurons in macaque striate cortex. Nature Neuroscience, 2, 825–832.
- Logothetis, N. K., Guggenberger, H., Peled, S., & Pauls, J. (1999). Functional imaging of the monkey brain. Nature Neuroscience, 2, 555–562.
- Logothetis, N. K., & Pauls, J. (1995). Psychophysical and physiological evidence for viewer-centered object representations in the primate. Cerebral Cortex, 5, 270–288.
- Logothetis, N. K., Pauls, J., & Poggio, T. (1995). Shape representation in the inferior temporal cortex of monkeys. Current Biology, 5, 552–563.
- Luck, S. J., Chelazzi, L., Hillyard, S. A., & Desimone, R. (1997). Neural mechanisms of spatial selective attention in areas V1, V2, and V4 of macaque visual cortex. Journal of Neurophysiology, 77, 24–42.
- Luppino, G., Murata, A., Govoni, P., & Matelli, M. (1999). Largely segregated parietofrontal connections linking rostral intraparietal cortex (areas AIP and VIP) and the ventral premotor cortex (areas F5 and F4). Experimental Brain Research, 128, 181–187.
- Makous, W. (1990). Absolute sensitivity. In R. F. Hess, L. T. Sharpe, & K. Nordby (Eds.), Night vision: Basic, clinical and applied aspects (pp. 146–176). New York: Cambridge University Press.
- Malach, R., Tootell, R. B., & Malonek, D. (1994). Relationship between orientation domains, cytochrome oxidase stripes, and intrinsic horizontal connections in squirrel monkey area V2. Cerebral Cortex, 4, 151–165.
- Martin, P. R., Lee, B. B., White, A. J., Solomon, S. G., & Ruttiger, L. (2001). Chromatic sensitivity of ganglion cells in the peripheral primate retina. Nature, 410, 933–936.
- Martin, P. R., White, A. J., Goodchild, A. K., Wilder, H. D., & Sefton, A. E. (1997). Evidence that blue-on cells are part of the third geniculocortical pathway in primates. European Journal of Neuroscience, 9, 1536–1541.
- Martin-Elkins, C. L., & Horel, J. A. (1992). Cortical afferents to behaviorally defined regions of the inferior temporal and parahippocampal gyri as demonstrated by WGA-HRP. Journal of Comparative Neurology, 321, 177–192.
- Masland, R. H., & Raviola, E. (2000). Confronting complexity: Strategies for understanding the microcircuitry of the retina. Annual Review of Neuroscience, 23, 249–284.
- Massey, S. C. (1990). Cell types using glutamate as a neurotransmitter in the vertebrate retina. In N. N. Osborne & G. Chader (Eds.), Progress in retinal research: Vol. 9. (pp. 399–425). London: Pergamon Press.
- Maunsell, J. H., Nealey, T. A., & DePriest, D. D. (1990). Magnocellular and parvocellular contributions to responses in the middle temporal visual area (MT) of the macaque monkey. Journal of Neuroscience, 10, 3323–3334.
- Maunsell, J. H., & Newsome, W. T. (1987). Visual processing in monkey extrastriate cortex. Annual Review of Neuroscience, 10, 363–401.
- Maunsell, J. H., & Van Essen, D. C. (1983a). The connections of the middle temporal visual area (MT) and their relationship to a cortical hierarchy in the macaque monkey. Journal of Neuroscience, 3, 2563–2586.
- Maunsell, J. H., & Van Essen, D. C. (1983b). Functional properties of neurons in middle temporal visual area of the macaque monkey: I. Selectivity for stimulus direction, speed, and orientation. Journal of Neurophysiology, 49, 1127–1147.
- Maunsell, J. H., & Van Essen, D. C. (1983c). Functional properties of neurons in middle temporal visual area of the macaque monkey: II. Binocular interactions and sensitivity to binocular disparity. Journal of Neurophysiology, 49, 1148– 1167.
- Mazzoni, P., Bracewell, R. M., Barash, S., & Andersen, R. A. (1996). Motor intention activity in the macaque’s lateral intraparietal area: I. Dissociation of motor plan from sensory memory. Journal of Neurophysiology, 76, 1439–1456.
- McAdams, C. J., & Maunsell, J. H. (1999). Effects of attention on orientation-tuning functions of single neurons in macaque cortical area V4. Journal of Neuroscience, 19, 431–441.
- Merigan, W. H. (1989). Chromatic and achromatic vision of macaques: Role of the P pathway. Journal of Neuroscience, 9, 776–783.
- Merigan, W. H. (1996). Basic visual capacities and shape discrimination after lesions of extrastriate area V4 in macaques. Visual Neuroscience, 13, 51–60.
- Merigan, W. H. (2000). Cortical area V4 is critical for certain texture discriminations, but this effect is not dependent on attention. Visual Neuroscience, 17, 949–958.
- Merigan, W. H., Byrne, C. E., & Maunsell, J. H. (1991). Does primate motion perception depend on the magnocellular pathway? Journal of Neuroscience, 11, 3422–3429.
- Merigan, W. H., Katz, L. M., & Maunsell, J. H. (1991). The effects of parvocellular lateral geniculate lesions on the acuity and contrast sensitivity of macaque monkeys. Journal of Neuroscience, 11, 994–1001.
- Merigan, W. H., & Maunsell, J. H. (1990). Macaque vision after magnocellular lateral geniculate lesions. Visual Neuroscience, 5, 347–352.
- Merigan, W. H., & Maunsell, J. H. (1993). How parallel are the primate visual pathways? Annual Review of Neuroscience, 16, 369– 402.
- Merigan, W. H., Nealey, T. A., & Maunsell, J. H. (1993). Visual effects of lesions of cortical area V2 in macaques. Journal of Neuroscience, 13, 3180–3191.
- Merigan, W. H., & Pasternak, T. (in press). Lesions in primate visual cortex leading to deficits of perception. In M. Fahle & M. Greenlee (Eds.), Neuropsychology of vision: Vol.: Oxford University Press.
- Middleton, F. A., & Strick, P. L. (1996). The temporal lobe is a target of output from the basal ganglia. Proceedings of the National Academy of Sciences, USA, 93, 8683–8687.
- Mikami, A., Newsome, W. T., & Wurtz, R. H. (1986). Motion selectivity in macaque visual cortex: I. Mechanisms of direction and speed selectivity in extrastriate area MT. Journal of Neurophysiology, 55, 1308–1327.
- Miles, F. A., Kawano, K., & Optican, L. M. (1986). Short-latency ocular following responses of monkey: I. Dependence on temporospatial properties of visual input. Journal of Neurophysiology, 56, 1321–1354.
- Miller, E. K., Li, L., & Desimone, R. (1993). Activity of neurons in anterior inferior temporal cortex during a short-term memory task. Journal of Neuroscience, 13, 1460–1478.
- Miller, M., Pasik, P., & Pasik, T. (1980). Extrageniculostriate vision in the monkey: VII. Contrast sensitivity functions. Journal of Neurophysiology, 43, 1510–1526.
- Mishkin, M. (1954). Visual discrimination performance following partial ablations of the temporal lobe: II. Ventral surface vs. hippocampus. Journal of Comparative & Physiological Psychology, 47, 187–193.
- Mishkin, M., & Pribram, K. H. (1954). Visual discrimination performance following partial ablations of the temporal lobe: I. Ventral vs. lateral. Journal of Comparative & Physiological Psychology, 47, 14–20.
- Miyashita, Y., & Chang, H. S. (1988). Neuronal correlate of pictorial short-term memory in the primate temporal cortex. Nature, 331, 68–70.
- Moore, T., Tolias, A. S., & Schiller, P. H. (1998). Visual representations during saccadic eye movements. Proceedings of the National Academy of Sciences, USA, 95, 8981–8984.
- Moran, J., & Desimone, R. (1985). Selective attention gates visual processing in the extrastriate cortex. Science, 229, 782–783.
- Morigiwa, K., & Vardi, N. (1999). Differential expression of ionotropic glutamate receptor subunits in the outer retina. Journal of Comparative Neurology, 405, 173–184.
- Motter, B. C. (1994). Neural correlates of feature selective memory and pop-out in extrastriate area V4. Journal of Neuroscience, 14, 2190–2199.
- Mountcastle, V. B., Andersen, R. A., & Motter, B. C. (1981). The influence of attentive fixation upon the excitability of the lightsensitive neurons of the posterior parietal cortex. Journal of Neuroscience, 1, 1218–1225.
- Mountcastle, V. B., Lynch, J. C., Georgopoulos, A., Sakata, H., & Acuna, C. (1975). Posterior parietal association cortex of the monkey: Command functions for operations within extrapersonal space. Journal of Neurophysiology, 38, 871–908.
- Movshon, J. A., Adelson, E. H., Gizzi, M. S., & Newsome, T.(1985).Theanalysisofmovingvisualpatterns.InC.Chagas, R. Gattas, & C. G. Gross (Eds.), Pattern recognition mechanisms (pp. 117–151). Vatican City: Ponticifica Academia Scientiarum.
- Movshon, J. A., & Newsome, W. T. (1996). Visual response properties of striate cortical neurons projecting to area MT in macaque monkeys. Journal of Neuroscience, 16, 7733–7741.
- Nakamura, H., Gattass, R., Desimone, R., & Ungerleider, L. G. (1993). The modular organization of projections from areas V1 and V2 to areas V4 and TEO in macaques. Journal of Neuroscience, 13, 3681–3691.
- Nakamura,K.,Chung,H.H.,Graziano,M.S.,&Gross,C.G.(1999). Dynamic representation of eye position in the parieto-occipital sulcus. Journal of Neurophysiology, 81, 2374–2385.
- Nakamura, K., & Colby, C. L. (2000). Visual, saccade-related, and cognitive activation of single neurons in monkey extrastriate area V3a. Journal of Neurophysiology, 84, 677–692.
- Nakamura, K., & Colby, C. L. (2002). Updating of the visual representation in monkey striate and extrastriate areas during saccades. PNAS, 99, 4026–4031.
- Neal, J. W., Pearson, R. C., & Powell, T. P. (1990). The connections of area PG, 7a, with cortex in the parietal, occipital and temporal lobes of the monkey. Brain Research, 532, 249–264.
- Newsome, W. T., Britten, K. H., & Movshon, J. A. (1989). Neuronal correlates of a perceptual decision. Nature, 341, 52–54.
- Newsome, W. T., & Pare, E. B. (1988). A selective impairment of motion perception following lesions of the middle temporal visual area (MT). Journal of Neuroscience, 8, 2201–2211.
- Newsome, W. T., Wurtz, R. H., Dursteler, M. R., & Mikami, A. (1985). Deficits in visual motion processing following ibotenic acid lesions of the middle temporal visual area of the macaque monkey. Journal of Neuroscience, 5, 825–840.
- Nothdurft, H. C., Gallant, J. L., & Van Essen, D. C. (1999). Response modulation by texture surround in primate area V1: Correlates of “popout” under anesthesia. Visual Neuroscience, 16, 15–34.
- Nowak, L. G., Munk, M. H., James, A. C., Girard, P., & Bullier, J. (1999). Cross-correlation study of the temporal interactions between areas V1 and V2 of the macaque monkey. Journal of Neurophysiology, 81, 1057–1074.
- Obermayer, K., & Blasdel, G. G. (1993). Geometry of orientation and ocular dominance columns in monkey striate cortex. Journal of Neuroscience, 13, 4114–4129.
- Olavarria, J. F., & Van Essen, D. C. (1997). The global pattern of cytochrome oxidase stripes in visual area V2 of the macaque monkey. Cerebral Cortex, 7, 395–404.
- Oram, M. W., & Perrett, D. I. (1996). Integration of form and motion in the anterior superior temporal polysensory area (STPa) of the macaque monkey. Journal of Neurophysiology, 76, 109– 129.
- Oram, M. W., Perrett, D. I., & Hietanen, J. K. (1993). Directional tuning of motion-sensitive cells in the anterior superior temporal polysensory area of the macaque. Experimental Brain Research, 97, 274–294.
- Packer, O. S., Williams, D. R., & Bensinger, D. G. (1996). Photopigment transmittance imaging of the primate photoreceptor mosaic. Journal of Neuroscience, 16, 2251–2260.
- Page, W. K., & Duffy, C. J. (1999). MST neuronal responses to heading direction during pursuit eye movements. Journal of Neurophysiology, 81, 596–610.
- Paolini, M., Distler, C., Bremmer, F., Lappe, M., & Hoffmann, K. P. (2000). Responses to continuously changing optic flow in area MST. Journal of Neurophysiology, 84, 730–743.
- Pasternak, T., & Merigan, W. H. (1994). Motion perception following lesions of the superior temporal sulcus in the monkey. Cerebral Cortex, 4, 247–259.
- Pasupathy, A., & Connor, C. E. (1999). Responses to contour features in macaque area V4. Journal of Neurophysiology, 82, 2490–2502.
- Perrett, D. I., Smith, P. A. J., Mistlin, A. J., Chitty, A. J., Head, A. S., Potter, D. D., et al. (1985). Visual analysis of body movements by neurons in the temporal cortex of the macaque monkey: A preliminary report. Behavioral Brain Research, 16, 153–170.
- Perry, V. H., Oehler, R., & Cowey, A. (1984). Retinal ganglion cells that project to the dorsal lateral geniculate nucleus in the macaque monkey. Neuroscience, 12, 1101–1123.
- Peterhans, E., & von der Heydt, R. (1989). Mechanisms of contour perception in monkey visual cortex: II. Contours bridging gaps. Journal of Neuroscience, 9, 1749–1763.
- Phinney, R. E., & Siegel, R. M. (2000). Speed selectivity for optic flow in area 7a of the behaving macaque. Cerebral Cortex, 10, 413–421.
- Platt, M. L., & Glimcher, P. W. (1997). Responses of intraparietal neurons to saccadic targets and visual distractors. Journal of Neurophysiology, 78, 1574–1589.
- Platt, M. L., & Glimcher, P. W. (1999). Neural correlates of decision variables in parietal cortex. Nature, 400, 233–238.
- Poggio, G. E. (1995). Mechanisms of stereopsis in monkey visual cortex. Cerebral Cortex, 5, 193–204.
- Poggio, G. F., Gonzalez, F., & Krause, F. (1988). Stereoscopic mechanisms in monkey visual cortex: Binocular correlation and disparity selectivity. Journal of Neuroscience, 8, 4531–4550.
- Posner, M. I. (1980). Orienting of attention. Quarterly Journal of Experimental Psychology, 32, 3–25.
- Powell, K. D., & Goldberg, M. E. (2000). Response of neurons in the lateral intraparietal area to a distractor flashed during the delay period of a memory-guided saccade. Journal of Neurophysiology, 84, 301–310.
- Qian, N., Andersen, R. A., & Adelson, E. H. (1994). Transparent motion perception as detection of unbalanced motion signals: I. Psychophysics. Journal of Neuroscience, 14, 7357–7366.
- Read, H. L., & Siegel, R. M. (1997). Modulation of responses to optic flow in area 7a by retinotopic and oculomotor cues in monkey. Cerebral Cortex, 7, 647–661.
- Recanzone, G. H., Wurtz, R. H., & Schwarz, U. (1997). Responses of MT and MST neurons to one and two moving objects in the receptive field. Journal of Neurophysiology, 78, 2904–2915.
- Rensink, R. A. (2000). Visual search for change: A probe into the nature of attentional processing. Visual Cognition, 7, 345–376.
- Reynolds, J. H., Chelazzi, L., & Desimone, R. (1999). Competitive mechanisms subserve attention in macaque areas V2 and V4. Journal of Neuroscience, 19, 1736–1753.
- Reynolds, J. H., Pasternak, T., & Desimone, R. (2000). Attention increases sensitivity of V4 neurons. Neuron, 26, 703–714.
- Ringach, D. L., Hawken, M. J., & Shapley, R. (1997). Dynamics of orientation tuning in macaque primary visual cortex. Nature, 387, 281–284.
- Robinson, D. L., Goldberg, M. E., & Stanton, G. B. (1978). Parietal association cortex in the primate: Sensory mechanisms and behavioral modulations. Journal of Neurophysiology, 41, 910–932.
- Rockland, K. S. (1992). Laminar distribution of neurons projecting from area V1 to V2 in macaque and squirrel monkeys. Cerebral Cortex, 2, 38–47.
- Rockland, K. S., & Pandya, D. N. (1979). Laminar origins and terminations of cortical connections of the occipital lobe in the rhesus monkey. Brain Research, 179, 3–20.
- Rodieck, R. W. (1979). Visual pathways. Annual Review of Neuroscience, 2, 193–225.
- Rodieck, R. W. (1988). The primate retina. In H. D. Steklis (Ed.), Neurosciences: Vol. 4. Comparative primate biology (pp. 203–278). New York: Alan R. Liss.
- Rodieck, R. W. (1998). The first steps in seeing. Sunderland, MA: Sinauer Associates.
- Rodieck, R. W., & Watanabe, M. (1993). Survey of the morphology of macaque retinal ganglion cells that project to the pretectum, superior colliculus, and parvicellular laminae of the lateral geniculate nucleus. Journal of Comparative Neurology, 338, 289–303.
- Rodman, H. R., & Albright, T. D. (1989). Single-unit analysis of pattern-motion selective properties in the middle temporal visual area (MT). Experimental Brain Research, 75, 53–64.
- Roe, A. W., & Ts’o, D. Y. (1995). Visual topography in primate V2: Multiple representation across functional stripes. Journal of Neuroscience, 15, 3689–3715.
- Roe, A. W., & Ts’o, D. Y. (1997). The functional architecture of area V2 in the macaque monkey: Physiology, topography, connectivity. In E. G. Jones, A. Peters (Series Eds.), K. S. Rockland, J. H. Kaas, & A. Peters (Vol. Eds.), Cerebral cortex: Vol. 12. Extrastriate cortex in primates (pp. 295–333). New York: Plenum Press.
- Roelfsema, P. R., Lamme, V. A., & Spekreijse, H. (1998). Objectbased attention in the primary visual cortex of the macaque monkey. Nature, 395, 376–381.
- Rossi, A. F., Desimone, R., & Ungerleider, L. G. (2001). Contextual modulation in primary visual cortex of macaques. Journal of Neuroscience, 21, 1698–1709.
- Roy, J. P., Komatsu, H., & Wurtz, R. H. (1992). Disparity sensitivity of neurons in monkey extrastriate area MST. Journal of Neuroscience, 12, 2478–2492.
- Rudolph, K., & Pasternak, T. (1999). Transient and permanent deficits in motion perception after lesions of cortical areas MT and MST in the macaque monkey. Cerebral Cortex, 9, 90– 100.
- Rushton, S. K., Harris, J. M., Lloyd, M. R., & Wann, J. P. (1998). Guidance of locomotion on foot uses perceived target location rather than optic flow. Current Biology, 8, 1191–1194.
- Saito, H., Yukie, M., Tanaka, K., Hikosaka, K., Fukada, Y., & Iwai, E. (1986). Integration of direction signals of image motion in the superior temporal sulcus of the macaque monkey. Journal of Neuroscience, 6, 145–157.
- Sakai, K., & Miyashita, Y. (1994). Neuronal tuning to learned complex forms in vision. Neuroreport, 5, 829–832.
- Sakata, H., Shibutani, H., Ito, Y., & Tsurugai, K. (1986). Parietal cortical neurons responding to rotary movement of visual stimulus in space. Experimental Brain Research, 61, 658–663.
- Sakata, H., Shibutani, H., Ito, Y., Tsurugai, K., Mine, S., & Kusunoki, M. (1994). Functional properties of rotation-sensitive neurons in the posterior parietal association cortex of the monkey. Experimental Brain Research, 101, 183–202.
- Sakata, H., Shibutani, H., & Kawano, K. (1983). Functional properties of visual tracking neurons in posterior parietal association cortex of the monkey. Journal of Neurophysiology, 49, 1364–1380.
- Salzman, C. D., Britten, K. H., & Newsome, W. T. (1990). Cortical microstimulation influences perceptual judgements of motion direction. Nature, 346, 174–177.
- Salzman, C. D., Murasugi, C. M., Britten, K. H., & Newsome, W. T. (1992). Microstimulation in visual area MT: Effects on direction discrimination performance. Journal of Neuroscience, 12, 2331– 2355.
- Samy, C. N., & Hirsch, J. (1989). Comparison of human and monkey retinal photoreceptor sampling mosaics. Visual Neuroscience, 3, 281–285.
- Sceniak, M. P., Ringach, D. L., Hawken, M. J., & Shapley, R. (1999). Contrast’s effect on spatial summation by macaque V1 neurons. Nature Neuroscience, 2, 733–739.
- Schaafsma, S. J., & Duysens, J. (1996). Neurons in the ventral intraparietal area of awake macaque monkey closely resemble neurons in the dorsal part of the medial superior temporal area in their responses to optic flow patterns. Journal of Neurophysiology, 76, 4056–4068.
- Schall, J. D., Morel, A., King, D. J., & Bullier, J. (1995). Topography of visual cortex connections with frontal eye field in macaque: Convergence and segregation of processing streams. Journal of Neuroscience, 15, 4464–4487.
- Schilder, P., Pasik, P., & Pasik, T. (1972). Extrageniculostriate vision in the monkey: III. Circle VS triangle and “red VS green” discrimination. Experimental Brain Research, 14, 436– 448.
- Schiller, P. H. (1993). The effects of V4 and middle temporal (MT) area lesions on visual performance in the rhesus monkey. Visual Neuroscience, 10, 717–746.
- Schiller, P. H., & Colby, C. L. (1983). The responses of single cells in the lateral geniculate nucleus of the rhesus monkey to color and luminance contrast. Vision Research, 23, 1631–1641.
- Schiller, P. H., & Lee, K. (1994). The effects of lateral geniculate nucleus, area V4, and middle temporal (MT) lesions on visually guided eye movements. Visual Neuroscience, 11, 229–241.
- Schiller, P. H., Logothetis, N. K., & Charles, E. R. (1990). Functions of the colour-opponent and broad-band channels of the visual system. Nature, 343, 68–70.
- Schiller, P. H., & Malpeli, J. G. (1977). The effect of striate cortex cooling on area 18 cells in the monkey. Brain Research, 126, 366–369.
- Schiller, P. H., & Malpeli, J. G. (1978). Functional specificity of lateral geniculate nucleus laminae of the rhesus monkey. Journal of Neurophysiology, 41, 788–797.
- Sclar, G., Maunsell, J. H., & Lennie, P. (1990). Coding of image contrast in central visual pathways of the macaque monkey. Vision Research, 30, 1–10.
- Seidemann, E., & Newsome, W. T. (1999). Effect of spatial attention on the responses of area MT neurons. Journal of Neurophysiology, 81, 1783–1794.
- Seidemann, E., Poirson, A. B., Wandell, B. A., & Newsome, W. T. (1999). Color signals in area MT of the macaque monkey. Neuron, 24, 911–917.
- Seidemann, E., Zohary, E., & Newsome, W. T. (1998). Temporal gating of neural signals during performance of a visual discrimination task. Nature, 394, 72–75.
- Selemon, L. D., & Goldman-Rakic, P. S. (1988). Common cortical and subcortical targets of the dorsolateral prefrontal and posterior parietal cortices in the rhesus monkey: Evidence for a distributed neural network subserving spatially guided behavior. Journal of Neuroscience, 8, 4049–4068.
- Seltzer, B., & Pandya, D. N. (1986). Posterior parietal projections to the intraparietal sulcus of the rhesus monkey. Experimental Brain Research, 62, 459–469.
- Seltzer, B., & Pandya, D. N. (1989). Frontal lobe connections of the superior temporal sulcus in the rhesus monkey. Journal of Comparative Neurology, 281, 97–113.
- Sereno, A. B., & Maunsell, J. H. (1998). Shape selectivity in primate lateral intraparietal cortex. Nature, 395, 500–503.
- Shadlen, M. N., & Newsome, W. T. (1996). Motion perception: Seeing and deciding. Proceedings of the National Academy of Sciences, USA, 93, 628–633.
- Shadlen, M. N., & Newsome, W. T. (2001). Neural basis of a perceptual decision in the parietal cortex (area LIP) of the rhesus monkey. Journal of Neurophysiology, 86, 1916–1936.
- Sheinberg, D. L., & Logothetis, N. K. (1997). The role of temporal cortical areas in perceptual organization. Proceedings of the National Academy of Sciences, USA, 94, 3408–3413.
- Shenoy, K. V., Bradley, D. C., & Andersen, R. A. (1999). Influence of gaze rotation on the visual response of primate MSTd neurons. Journal of Neurophysiology, 81, 2764–2786.
- Sherman, S. M. (1996). Dual response modes in lateral geniculate neurons: Mechanisms and functions. Visual Neuroscience, 13, 205–213.
- Sherman, S. M. (2001). Tonic and burst firing: Dual modes of thalamocortical relay. Trends in Neurosciences, 24, 122–126.
- Sherman, S. M., & Guillery, R. W. (1996). Functional organization of thalamocortical relays. Journal of Neurophysiology, 76, 1367–1395.
- Shipp, S., & Zeki, S. (1989). The organization of connections between areas V5 and V2 in macaque monkey visual cortex. European Journal of Neuroscience, 1, 333–354.
- Shiwa, T. (1987). Corticocortical projections to the monkey temporal lobe with particular reference to the visual processing pathways. Archive Ital Biol, 125, 139–154.
- Siegel, R. M., & Read, H. L. (1997). Analysis of optic flow in the monkey parietal area 7a. Cerebral Cortex, 7, 327–346.
- Smith, R. G., & Sterling, P. (1990). Cone receptive field in cat retina computed from microcircuitry. Visual Neuroscience, 5, 453–461.
- Smith, V. C., Pokorny, J., Lee, B. B., & Dacey, D. M. (2001). Primate horizontal cell dynamics: An analysis of sensitivity regulation in the outer retina. Journal of Neurophysiology, 85, 545–558.
- Snowden, R. J., Treue, S., Erickson, R. G., & Andersen, R. A. (1991). The response of area MT and V1 neurons to transparent motion. Journal of Neuroscience, 11, 2768–2785.
- Snyder, L. H., Batista, A. P., & Andersen, R. A. (1997). Coding of intention in the posterior parietal cortex. Nature, 386, 167–170.
- Snyder, L. H., Grieve, K. L., Brotchie, P., & Andersen, R. A. (1998). Separate body- and world-referenced representations of visual space in parietal cortex. Nature, 394, 887–891.
- Spear, P. D., Kim, C. B. Y., Ahmad, A., & Tom, B. W. (1996). Relationship between numbers of retinal ganglion cells and lateral geniculate neurons in the rhesus monkey. Visual Neuroscience, 13, 199–203.
- Spear, P. D., Moore, R. J., Kim, C. B. Y., Xue, J.-T., & Tumosa, N., (1994). Effects of aging on the primate visual system: Spatial and temporal processing by lateral geniculate neurons in young adult and old rhesus monkeys. Journal of Neurophysiology, 72, 402–420.
- Squire, L. R. (1987). Memory and brain. New York: Oxford University Press.
- Srinivasan, M. V., Laughlin, S. B., & Dubs, A. (1982). Predictive coding: A fresh view of inhibition in the retina. Proceedings of the Royal Society, London, 216B, 427–459.
- Stefanacci, L., Reber, P., Costanza, J., Wong, E., Buxton, R., Zola, S., et al. (1998). FMRI of monkey visual cortex. Neuron, 20, 1051–1057.
- Steinmetz, M. A., Connor, C. E., Constantinidis, C., & McLaughlin, J. R. (1994). Covert attention suppresses neuronal responses in area 7a of the posterior parietal cortex. Journal of Neurophysiology, 72, 1020–1023.
- Sterling, P. (1998). “Knocking out” a neural circuit. Neuron, 21, 643–644.
- Sterling, P., Smith, R. G., Rao, R., & Vardi, N. (1995). Functional architecture of mammalian outer retina and bipolar cells. In S. Archer, M. B. Djamgoz, & S. Vallerga (Eds.), Neurobiology and clinical aspects of the outer retina (pp. 325–348). London: Chapman & Hall.
- Strettoi, E., Dacheux, R. F., & Raviola, E. (1990). Synaptic connections of rod bipolar cells in the inner plexiform layer of the rabbit retina. Journal of Comparative Neurology, 295, 449–466.
- Takemura, A., Inoue, Y., & Kawano, K. (2000). The effect of disparity on the very earliest ocular following responses and the initial neuronal activity in monkey cortical area MST. Neuroscience Research, 38, 93–101.
- Takemura, A., Inoue, Y., Kawano, K., Quaia, C., & Miles, F. A. (2001). Single-unit activity in cortical area MST associated with disparity-vergence eye movements: Evidence for population coding. Journal of Neurophysiology, 85, 2245–2266.
- Tamura, H., & Tanaka, K. (2001). Visual response properties of cells in the ventral and dorsal parts of the macaque inferotemporal cortex. Cerebral Cortex, 11, 384–399.
- Tanaka, K. (1993). Neuronal mechanisms of object recognition. Science, 262, 685–688.
- Tanaka, K. (1996). Inferotemporal cortex and object vision. Annual Review of Neuroscience, 19, 109–139.
- Tanaka, K. (1997). Columnar organization in inferotemporal cortex. In E. G. Jones, A. Peters (Series Eds.), K. S. Rockland, J. H. Kaas, & A. Peters (Vol. Eds.), Cerebral cortex: Vol. 12.
- Extrastriate cortex in primates (pp. 469–498). New York: Plenum Press.
- Tanaka, K. (1998). Representation of visual motion in the extrastriate visual cortex. In T. Watanabe (Ed.), High-level motion processing: Computational, neurobiological, and psychophysical perspectives (pp. 295–313). Cambridge, MA: MIT Press.
- Tanaka, K., Fukada, Y., & Saito, H. A. (1989). Underlying mechanisms of the response specificity of expansion/contraction and rotation cells in the dorsal part of the medial superior temporal area of the macaque monkey. Journal of Neurophysiology, 62, 642–656.
- Tanaka, K., Hikosaka, K., Saito, H., Yukie, M., Fukada, Y., & Iwai, E. (1986). Analysis of local and wide-field movements in the superior temporal visual areas of the macaque monkey. Journal of Neuroscience, 6, 134–144.
- Tanaka, K., & Saito, H. (1989). Analysis of motion of the visual field by direction, expansion/contraction, and rotation cells clustered in the dorsal part of the medial superior temporal area of the macaque monkey. Journal of Neurophysiology, 62, 626–641.
- Tanaka, M., Lindsley, E., Lausmann, S., & Creutzfeldt, O. D. (1990). Afferent connections of the prelunate visual association cortex (areas V4 and DP). Anatomy and Embryology, Berlin, 181, 19–30.
- Thiele, A., Dobkins, K. R., & Albright, T. D. (2001). Neural correlates of chromatic motion perception. Neuron, 32, 351–358.
- Treue, S., Hol, K., & Rauber, H.-J. (2000). Seeing multiple directions of motion: Physiology and psychophysics. Nature Neuroscience, 3, 270–276.
- Treue, S., & Martinez Trujillo, J. C. (1999). Feature-based attention influences motion processing gain in macaque visual cortex. Nature, 399, 575–579.
- Treue, S., & Maunsell, J. H. (1996). Attentional modulation of visual motion processing in cortical areas MT and MST. Nature, 382, 539–541.
- Treue, S., & Maunsell, J. H. (1999). Effects of attention on the processing of motion in macaque middle temporal and medial superior temporal visual cortical areas. Journal of Neuroscience, 19, 7591–7602.
- Ts’o, D. Y., & Gilbert, C. D. (1988). The organization of chromatic and spatial interactions in the primate striate cortex. Journal of Neuroscience, 8, 1712–1727.
- Ts’o, D. Y., Roe, A. W., & Gilbert, C. D. (2001). A hierarchy of the functional organization for color, form and disparity in primate visual area V2. Vision Research, 41, 1333–1349.
- Tsukamoto, Y., Masarachia, P., Schein, S. J., & Sterling, P. (1992). Gap junctions between the pedicles of macaque foveal cones. Vision Research, 32, 1809–1815.
- Ungerleider, L. G., & Desimone, R. (1986). Cortical connections of visual area MT in the macaque. Journal of Comparative Neurology, 248, 190–222.
- Ungerleider, L. G., Desimone, R., Galkin, T. W., & Mishkin, M. (1984). Subcortical projections of area MT in the macaque. Journal of Comparative Neurology, 223, 368–386.
- Ungerleider, L. G., Galkin, T. W., & Mishkin, M. (1983). Visuotopic organization of projections from striate cortex to inferior and lateral pulvinar in rhesus monkey. Journal of Comparative Neurology, 217, 137–157.
- Ungerleider, L. G., & Mishkin, M. (1982). Two cortical visual systems. In D. J. Ingle, R. J. Mansfield, & M. S. Goodale (Eds.), The analysis of visual behavior (pp. 549–586). Cambridge, MA: MIT Press.
- Upadhyay, U. D., Page, W. K., & Duffy, C. J. (2000). MST responses to pursuit across optic flow with motion parallax. Journal of Neurophysiology, 84, 818–826.
- van den Berg, A. V., & Beintema, J. A. (2000). The mechanism of interaction between visual flow and eye velocity signals for heading perception. Neuron, 26, 747–752.
- Van Essen, D. C., & Zeki, S. M. (1978). The topographic organization of rhesus monkey prestriate cortex. The Journal of Physiology, 277, 193–226.
- Van Essen, D. C., Maunsell, J. H., & Bixby, J. L. (1981). The middle temporal visual area in the macaque: Myeloarchitecture, connections, functional properties and topographic organization. Journal of Comparative Neurology, 199, 293–326.
- Van Essen, D. C., Newsome, W. T., & Maunsell, J. H. (1984). The visual field representation in striate cortex of the macaque monkey: Asymmetries, anisotropies, and individual variability. Vision Research, 24, 429–448.
- Van Essen, D. C., Newsome, W. T., Maunsell, J. H., & Bixby, J. L. (1986). The projections from striate cortex (V1) to areas V2 and V3 in the macaque monkey: Asymmetries, areal boundaries, and patchy connections. Journal of Comparative Neurology, 244, 451–480.
- Vaney, D. I. (1994). Territorial organization of direction-selective ganglion cells in rabbit retina. Journal of Neuroscience, 14, 6301–6316.
- Vaney, D. I., Peichl, L., & Boycott, B. B. (1981). Matching populations of amacrine cells in the inner nuclear and ganglion cell layers of the rabbit retina. Journal of Comparative Neurology, 199, 373–391.
- Vardi, N., Kaufman, D. L., & Sterling, P. (1994). Horizontal cells in cat and monkey retina express different isoforms of glutamic acid decarboxylase. Visual Neuroscience, 11, 135–142.
- Vardi, N., Masarachia, P., & Sterling, P. (1992). Immunoreactivity to GABAa receptor in the outer plexiform layer of the cat retina. Journal of Comparative Neurology, 320, 394–397.
- Varela, F., Lachaux, J. P., Rodriguez, E., & Martinerie, J. (2001). The brainweb: Phase synchronization and large-scale integration. Nature Reviews Neuroscience, 2, 229–239.
- Walker, M. F., Fitzgibbon, E. J., & Goldberg, M. E. (1995). Neurons in the monkey superior colliculus predict the visual result of impending saccadic eye movements. Journal of Neurophysiology, 73, 1988–2003.
- Walsh, V., Butler, S. R., Carden, D., & Kulikowski, J. J. (1992). The effects of V4 lesions on the visual abilities of macaques: Shape discrimination. Behavioural Brain Research, 50, 115–126.
- Walsh, V., Carden, D., Butler, S. R., & Kulikowski, J. J. (1993). The effects of V4 lesions on the visual abilities of macaques: Hue discrimination and colour constancy. Behavioural Brain Research, 53, 51–62.
- Walsh, V., Kulikowski, J. J., Butler, S. R., & Carden, D. (1992). The effects of lesions of area V4 on the visual abilities of macaques: Colour categorization. Behavioural Brain Research, 52, 81–89.
- Walsh, V., Le Mare, C., Blaimire, A., & Cowey, A. (2000). Normal discrimination performance accompanied by priming deficits in monkeys with V4 or TEO lesions. Neuroreport, 11, 1459–1462.
- Wandell, B. A. (1995). Foundations of vision. Sunderland, MA: Sinauer Associates.
- Wandell, B. A. (1999). Computational neuroimaging of human visual cortex. Annual Review of Neuroscience, 22, 145–173.
- Warren, W. H., Kay, B. A., Zosh, W. D., Duchon, A. P., & Sahuc, S. (2001). Optic flow is used to control human walking. Nature Neuroscience, 4, 213–216.
- Wässle, H., & Boycott, B. B. (1991). Functional architecture of the mammalian retina. Physiological Reviews, 71, 447–480.
- Wässle, H., Grünert, U., Martin, P. R., & Boycott, B. B. (1994). Immunocytochemical characterization and spatial distribution of midget bipolar cells in the macaque monkey retina. Vision Research, 34, 561–579.
- Wässle, H., Grünert, U., Röhrenbeck, J., & Boycott, B. B. (1989). Cortical magnification factor and ganglion cell density of the primate retina. Nature, 341, 643–646.
- Wässle, H., Grünert, U., Röhrenbeck, J., & Boycott, B. B. (1990). Retinal ganglion cell density and cortical magnification factor in the primate. Vision Research, 30, 1897–1911.
- Watanabe, M., & Rodieck, R. W. (1989). Parasol and midget ganglion cells of the primate retina. Journal of Comparative Neurology, 289, 434–454.
- Weiskrantz, L., & Cowey, A. (1967). Comparison of the effects of striate cortex and retinal lesions on visual acuity in the monkey. Science, 155, 104–106.
- Wiesel, T. N., & Hubel, D. H. (1966). Spatial and chromatic interactions in the lateral geniculate body of the rhesus monkey. Journal of Neurophysiology, 29, 1115–1156.
- Williams, D. R. (1986). Seeing through the photoreceptor mosaic. Trends in Neuroscience, 9, 193–198.
- Wilson, J. R. (1993). Circuitry of the dorsal lateral geniculate nucleus in the cat and monkey. Acta Anatomica, 147, 1–13.
- Wurtz, R. H., & Kandel, E. R. (2000). Central visual pathways. In E. R. Kandel, J. H. Schwartz, & T. M. Jessell (Eds.), Principles of neural science (4th ed., pp. 523–547). New York: McGraw-Hill.
- Xiao, D. K., Raiguel, S., Marcar, V., Koenderink, J., & Orban, G. A. (1995). Spatial heterogeneity of inhibitory surrounds in the middle temporal visual area. Proceedings of the National Academy of Sciences, USA, 92, 11303–11306.
- Xiao, Y., Zych, A., & Felleman, D. J. (1999). Segregation and convergence of functionally defined V2 thin stripe and interstripe compartment projections to area V4 of macaques. Cerebral Cortex, 9, 792–804.
- Xu, X., Ichida, J. M., Allison, J. D., Boyd, J. D., Bonds, A. B., & Casagrande, V. A. (2000). A comparison of koniocellular, magnocellular and parvocellular receptive field properties in the lateral geniculate nucleus of the owl monkey (Aotus trivirgatus). Journal of Physiology, 531, 203–218.
- Yantis, S., & Jonides, J. (1984). Abrupt visual onsets and selective attention: Evidence from visual search. Journal of Experimental Psychology and Human Perception and Performance, 10, 601–621.
- Yoshioka, T., Blasdel, G. G., Levitt, J. B., & Lund, J. S. (1996). Relation between patterns of intrinsic lateral connectivity, ocular dominance, and cytochrome oxidase-reactive regions in macaque monkey striate cortex. Cerebral Cortex, 6, 297–310.
- Yukie, M., & Iwai, E. (1985). Laminar origin of direct projection from cortex area V1 to V4 in the rhesus monkey. Brain Research, 346, 383–386.
- Yukie, M., & Iwai, E. (1988). Direct projections from the ventral TE area of the inferotemporal cortex to hippocampal field CA1 in the monkey. Neuroscience Letters, 88, 6–10.
- Zeki, S. M. (1971). Cortical projections from two prestriate areas in the monkey. Brain Research, 34, 19–35.
- Zeki, S. M. (1974). Functional organization of a visual area in the posterior bank of the superior temporal sulcus of the rhesus monkey. Journal of Physiology (London), 236, 549–573.
- Zeki, S. M. (1978a). The cortical projections of foveal striate cortex in the rhesus monkey. Journal of Physiology, 277, 227–244.
- Zeki, S. M. (1978b). Functional specialisation in the visual cortex of the rhesus monkey. Nature, 274, 423–428.
- Zeki, S. M. (1978c). The third visual complex of rhesus monkey prestriate cortex. Journal of Physiology, 277, 245–272.
- Zeki, S. M. (1978d). Uniformity and diversity of structure and function in rhesus monkey prestriate visual cortex. Journal of Physiology, 277, 273–290.
- Zeki, S. M. (1979). Functional specialization and binocular interaction in the visual areas of rhesus monkey prestriate cortex. Proceedings of the Royal Society, London, 204B, 379–397.
- Zeki, S. M., & Sandeman, D. R. (1976). Combined anatomical and electrophysiological studies on the boundary between the second and third visual areas of rhesus monkey cortex. Proceedings of the Royal Society, London, 194B, 555–562.
- Zeki, S. M., & Shipp, S. (1987). Functional segregation within area V2 of macaque monkey visual cortex. In J. J. Kulikowski, C. M. Dickinson, & I. J. Murray (Eds.), Seing contour and color (pp. 120–124). Oxford: Pergamon Press.
ORDER HIGH QUALITY CUSTOM PAPER

Always on-time

Plagiarism-Free

100% Confidentiality