
View sample comparative psychology of vision research paper. Browse research paper examples for more inspiration. If you need a psychology research paper written according to all the academic standards, you can always turn to our experienced writers for help. This is how your paper can get an A! Feel free to contact our writing service for professional assistance. We offer high-quality assignments for reasonable rates.
Animals have accumulated an impressive array of sensory capacities to support the critical choices of life, but for most species vision provides an unparalleled source of information allowing access to sustenance, safe havens, and mates. Quite simply, vision is important for most species and paramount for many. Among the latter group are the members of our own order—the primates—and no doubt because of this there has long been a vigorous interest in studying vision. The fruits of this labor are represented in thousands of published studies detailing virtually every aspect of vision. A significant fraction of this work involves studies of nonhuman subjects, and this research, though often motivated by an interest in simply using results from other animals to infer aspects of human vision, has done much to reveal the details of visual processing across very disparate species. In addition, a smaller (but no less committed) group of investigators has pursued comparative studies of vision as an end that is useful and important
Academic Writing, Editing, Proofreading, And Problem Solving Services
Get 10% OFF with 24START discount code
in its own right. In this research paper I appropriate results drawn from both of these approaches in order to summarize some comparative features of vision with the intent of revealing examples of common solutions achieved by evolutionary experiments in seeing and of noting cases where visual diversity allows solutions to particular environmental opportunities. Let us start by considering some basic features of photic environments and eyes.
Environments and Eyes
Fundamental Features of Photic Environments
Animals have evolved a range of photoreceptive mechanisms that allow the harvest of light to be employed toward multiple ends—for instance, in biological timing and navigation, as well as in seeing. In natural environments sunlight is the principle source of photic energy. Solar radiation is heavily filtered as it passes into earth’s atmosphere such that the radiation spectrum of light reaching the planet surface encompasses only a relatively narrow range of wavelengths, from approximately 300 nm to 1100 nm. As a result of some additional limitations that are inherent in biological light detectors, this range becomes further truncated. In particular, longer wavelength lights contain insufficient energies to trigger effectively a change in photopigment molecules while the eyes of many species contain spectral filters of one sort or another that greatly attenuate short wavelength lights and accordingly make them unavailable for further visual processing. The result is that vision in animals is effectively limited to a span of wavelengths that lay somewhere in the range from approximately 300 nm to 700 nm, and most species do not see
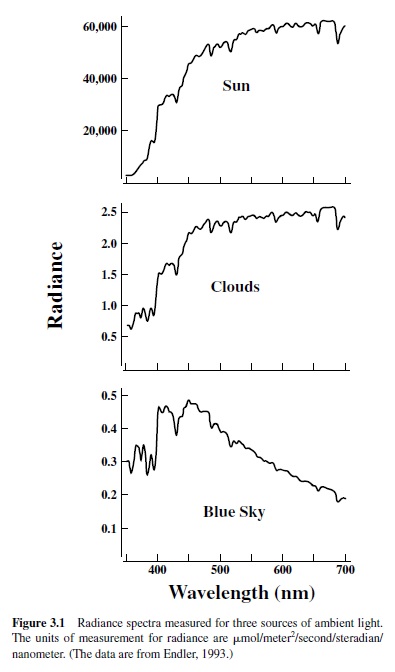
well over this entire range. Within this interval, variations in natural conditions can produce virtually infinite variations both in the overall amount of light (the total radiance) and in the relative distribution of light at different wavelengths (the radiance spectrum). These possibilities are illustrated in Figure 3.1, which shows radiance spectra measured for direct sunlight, for clouds, and for blue sky. Note, for example, that directsunlightandblueskydiffernotonlyintheirrelativedistributions of spectral energy but also in peak radiance, in this case by more than five orders of magnitude. Examinations of spectra like these suggest that it would be useful to design visual systems that both allow for an analysis of variations in the spectral distribution of light and operate efficiently over an expanded range of overall radiance.
The variations in the spectral distribution and overall radiance of ambient light are enhanced even more as a result of fluctuations in light at different times of the daily cycle and as a result of the physical properties of matter intervening in the light path. For example, sunlight filtered through a canopy of foliage is preferentially absorbed by plant pigments and consequently presents a very different radiance spectrum from that of the same sunlight viewed in an open field. Filtering processes like these yield a wide variety of potential photic habitats and serve to provide important constraints on the nature of vision best suited to exploit local conditions. Probably nowhere is that fact more clearly evident than in aquatic habitats. Long-wavelength radiation is preferentially absorbed by water, the result being that as one moves downward from the surfaceofabodyofwater,thetotalradiancedecreases,andthe spectrum of available lights also shifts toward the shorter wavelengths.Thefilteringissuchthatintheoceanatdepthsof 200 m or so the total radiance has been greatly decreased and the remaining light is more nearly monochromatic and has energy centered near 500 nm. Systematic measurements have been made on the nature of available light in some important aquatic and terrestrial habitats (Endler, 1993; Jerlov, 1976).
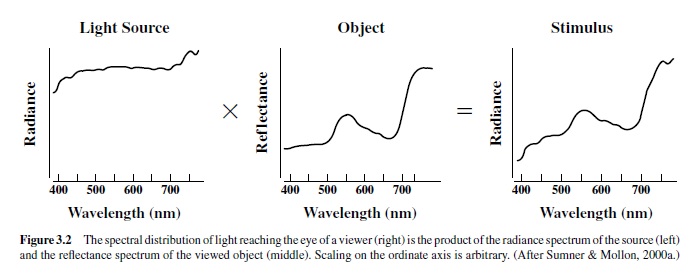
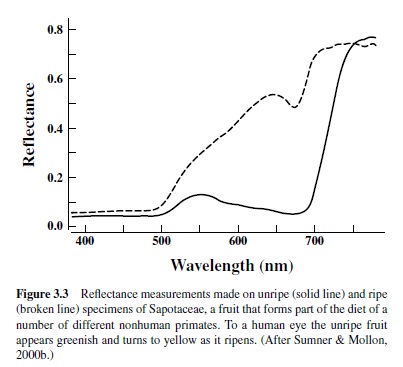
Of course, vision results mostly not from directly viewing light sources, but rather from observing objects in the environment. For visual purposes objects can be characterized by the efficiency with which they reflect light as a function of wavelength (the reflectance spectrum). As illustrated in Figure 3.2, the light reaching the eye of a viewer is the product of the spectrum of the illuminant and the reflectance spectrum of the object.Accordingly, visual stimuli may be dramatically altered by changes in the quality of the illuminant, as for instance at different times of the day, or by changes in the reflectance properties of the object. These alterations can be employed as a means for changing the nature of signals exchanged between animals or between an animal and a food source.Acommon example is that of fruiting plants.As fruits change from unripe to ripe, their reflectance properties are often dramatically shifted (Figure 3.3). For people and other species with the appropriate visual capacities (including various species of insects, nonhuman primates, fishes, and birds), this shift yields a large color change, and that information can allow a viewer to evaluate quickly and easily the potential palatability of fruit, perhaps thus guiding a decision as to whether it is worthy of the effort of harvesting.
In addition to overall radiance and spectral variation, there is another feature of light that can potentially provide useful information to an animal. Light radiated from the sun is unpolarized; that is, the electric vector (e-vector) of such light vibrates in all directions in the plane perpendicular to the direction of propagation. However, as light passes through the atmosphere, it becomes polarized so that the e-vector is oriented in a particular direction at each point in the sky relative to the position of the sun. It has long been appreciated that some species can analyze e-vector information to orient the animal relative to these polarization patterns. For example, honeybees are known to analyze patterns of polarized skylight to provide directional maps that can be used to chart the location of food sources (Rossel, 1993). Polarization sensitivity has been claimed to exist to varying degrees in many insects and birds, as well as in some fishes (Hawryshyn, 1992; Labhart & Meyer, 1999; Shashar & Cronin, 1996; Waterman, 1984). The biological mechanisms present in the visual systems of these animals that allow for an analysis of the plane of polarization of light are absent from the eyes of mammals; thus, mammals are unable to exploit this potential source of visual information.
Eyes: Basic Design Features and Evolution
Althoughprimitivedevicesthatcandetectlightaboundinsimple organisms in the form of eyespots and eyecups, structures that are effectively not much more than localized accumulations of light-sensitive pigments on the surface of the body, the eyes with which we are most familiar are prominent organs that serve to collect light and focus it onto photosensitive cells.The consensus is that such eyes first appeared in great numbers during the Cambrian period, a time that saw an explosive divergence of metazoan phyla (Fernald, 2000). Examination of fossils from the middle Cambrian period (about 515 million years ago, or MYA) reveals irregularities on the body surface that have the form of a series of closely aligned parallel ridges or grooves, perhaps permitting them to serve as diffraction gratings. If so, these structures could have made the animals appear iridescent in the ambient light of their watery habitats. It has been proposed that this structural feature may have enabled for the first time the exchange of informative visual signals between individuals (Parker,1998).Whether this adaptation was a trigger for a rapid evolution of eyes remains a matter for discussion, but in any case a number of phyla, including mollusks, arthropods, and chordates, emerged from the Cambrian period with functional eyes (Land, 1991).
Contemporary species provide examples of a variety of different eye designs. In essence, an eye images the outside world on a two-dimensional sheet of photoreceptor cells. Photoreceptors form immediate neural networks with other cells to make up the retina, and that structure constitutes the first stage of the visual nervous system. Two basically different kinds of optical systems have emerged to handle the task of image formation. In one, the retina is concave in shape; in the other, it is convex. If the retina is concave, a single optical element can be used to form an image across the retinal surface. This is the sort of arrangement found in the cameratype eyes of vertebrates. If the retina is convex, however, individual photoreceptive elements will be sensitive only to a narrow beam of incoming light, and this limitation is accommodated by the use of small lenses that are replicated again and again across the surface of the eye. The latter is characteristic of the compound eyes of arthropods (Goldsmith, 1990). Within these two design constraints are a number of qualitatively different imaging strategies. Several of these are illustrated schematically in Figure 3.4 (Land, 1991).
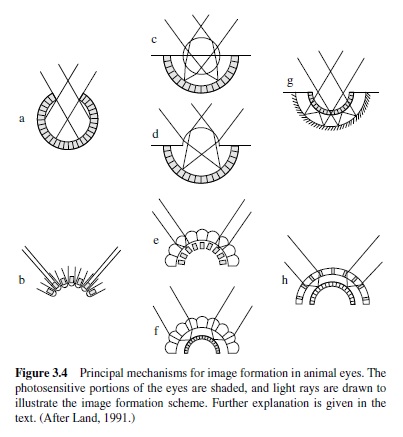
The top half of Figure 3.4 shows alternative versions of retinas that maintain a basic concave shape. In each case the photosensitive portion of the eye appears as shaded, and light rays have been drawn to illustrate the image formation scheme. A possible precursor to the more elaborate versions of a concave retina is a simple pit (Figure 3.4, panel A), the bottom surface of which is pigmented so that shadowing of light allows the animal to gain an indication of the directionality of a light source.Two successors to this plan are illustrated in the middle. They each employ large refracting elements to form a retinal image. In one (panel C) this is done with a spherical lens (as is typical of the eyes of fishes and others); in the other (panel D), principal refraction of light is accomplished by the cornea.Thelatterarrangementistheonefoundinhumaneyes, as indeed it is in all terrestrial vertebrates. The eye schematized in panel G ingenuously accommodates the concave retina by reflecting light back from a concave surface (a mirror) onto the photoreceptor cells. Mirrored eyes like this are rare; the eyes of scallops provide a well-studied contemporary example (Land, 1965).
The bottom half of Figure 3.4 illustrates various optical arrangements that have evolved in conjunction with a convex retina. The scheme shown in panel B, in which the individual elements are tube-like structures with a photopigment accumulation at the base of the tube, is again a possible primitive precursor for more sophisticated convex retina designs. In the middle are the two common optical arrangements found in compound eyes. One (panel E) uses so-called apposition optics, in which each of the lenses forms an image on photosensitive pigment in individual structures called rhabdoms. In the other version of the compound eye (panel F), the image is formed by the superposition of rays coming through many of the optical elements. Most insects have one or the other of these arrangements, and a usual generalization is that superposition eyes are found in diurnal insects whereas apposition eyes are found mostly in nocturnal insects. Finally, a reflecting-mirror version of the superposition eye (panel H) is found in decapod crustacea (shrimps, prawns, crayfish, and lobsters). All in all, animal eyes have managed to exploit an impressive array of image formation schemes—in the words of one of the foremost students of the matter, “It does seem that nearly every method of producing an image that exists has been tried somewhere in the animal kingdom” (Land, 1991, p. 133).
The main business of the visual system is to detect and analyze the spatial structure of the environment. Consequently, the details and relative merits of various types of eyes as devices for resolving images have been the subject of intense scrutiny (for extensive reviews of this topic see Goldsmith, 1990; Hughes, 1977; Land, 1999a). The principles governing the potential resolution of eyes are well understood. For instance, in single-lens eyes image resolution is conditioned by the focal length of the lens and the physical separation of the individual receptors. This is because a longer focal length yields higher magnification of the image whereas a denser packing of the receptors increases the spatial sampling of the image. A limitation on increasing the packing density of receptors is that as they are pushed closer together, they must necessarily become smaller. This is a problem because smaller receptors would enhance spatial sampling; but because they are smaller, they also become less efficient devices for trapping light. The consequence is the inevitable tradeoff between these two features. The trade is such that, in general, the portions of vertebrate receptors responsible for absorbing light (the outer segments) have diameters of not less than about 1 m and a receptor-receptor spacing of not less than about 2 m (Goldsmith, 1990). Examinations of singlelens eyes suggest that the packing density of receptors has been optimized so as to take the fullest advantage of the optical quality of the image provided by the anterior portion of the eye.
Compound eyes have a design problem not inherent in single-lens eyes. In compound eyes, the small sizes of the optical elements suffer a loss of resolution from diffraction of the focused light. This loss of resolution could be counteracted by an increase in the size of individual lenses and in the number of individual elements. Such increases in size are, however, difficult to accommodate in small-bodied animals. Just how difficult can be appreciated by a calculation suggesting that if a compound eye were designed to yield the same spatial resolution as that produced by the single-lens human eye, it would have to be about 1 m in diameter (Kirschfeld, 1976)! This is obviously impractical, but one means that has evolved to increase spatial resolution in compound eyes without having to increase overall eye size is to adapt small regions of compound eyes so that they can provide for localized regions of higher acuity. For example, preferential increases in the sizes of some individual facets allow some flying insects to have a zone of increased spatial acuity that is directed toward the horizon (Land, 1999a).
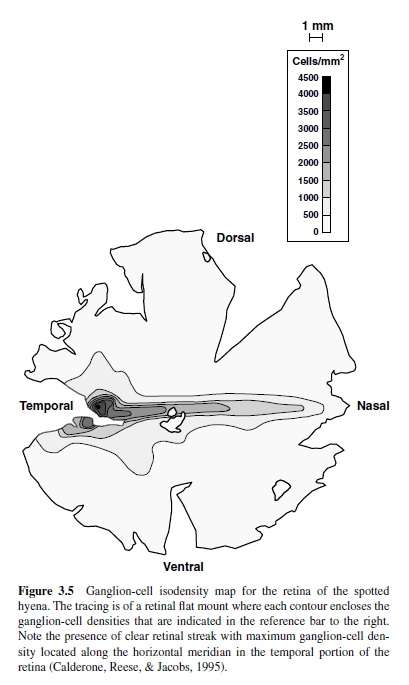
Regional specializations designed to support zones of higher acuity are common to many types of eyes whether they are of the compound or single-lens type (Collin, 1999). For example, in vertebrate eyes the density of retinal ganglion cells (the output cells from the retina) can provide a rough guide as to the way in which visual acuity varies across the visual field, with ganglion cell density highest in those regions of most acute vision. Figure 3.5 shows a map of the retinal distribution of ganglion cells in a large carnivore, the spotted hyena (Crocuta crocuta). The hyena has a pronounced horizontal streak that stretches across the retina and is made up of densely packed ganglion cells. Visual streaks of this sort appear in the eyes of a number of mammals, often in animals that live in open terrain and that may therefore be thought to require heightened acuity along a plane parallel to the surface of the ground where most objects of interest will appear (Hughes, 1977). Cell distributions like those of Figure 3.5 can be used to generate quantitative estimates of the spatial resolution capacity of the animal. This can prove useful for predicting visual acuity and thus avoiding having to ask the animal to serve as a subject in a behavioral test of acuity, an invitation one might issue only with some reluctance in the case of subjects like the spotted hyena.
Another example of regional eye specialization is a little closer to home. Primate retinas have a fovea, a central region that contains a heightened packing of cones, the daylight photoreceptors. The foveal region is also free of blood vessels, and these structural adaptations, in conjunction with the superior optical quality that derives for light rays that pass through the center of the lens as well as a robust representation of this region in the nervous system, yields a central visual field in which visual acuity is unusually high. Studies of structural features in the eyes of the kinds described here for fly, hyena, and man have been used to infer the presence of specialized visual capacities in many other animals (Ahnelt & Kolb, 2000; Hughes, 1977).
Photosensitivity
Photopigments
The translation of energy from light into nerve signals is initiated by the activation of photopigments. Photopigments are intrinsic membrane proteins called opsins that are covalently bound to retinoid chromophores. Light causes an isomerization of the chromophore, and that shape change initiates a biochemical cascade culminating in photoreceptor activation (Baylor, 1996). Photopigments can be characterized according to the efficiency with which they absorb light (the spectral absorption curve), and it has been known for well more than a century that the absorption properties of photopigments contain important implications for understanding vision (Jacobs, 1998b). The essential point is that only light that is absorbed by photopigments contributes to sight.
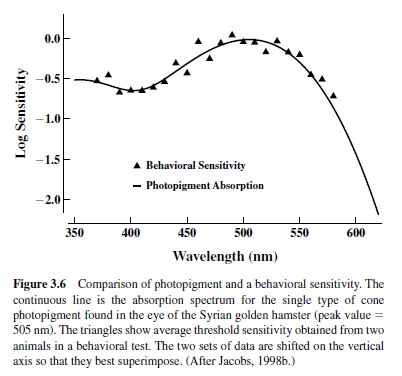
An example of the intimate linkage that exists between photopigment absorption characteristics and vision is given in Figure 3.6, which shows results obtained from the Syrian golden hamster, a small rodent that is somewhat unusual in having only a single type of photopigment active under daylight (photopic) conditions (Calderone & Jacobs, 1999). The solid line is the absorption spectrum of the hamster cone photopigment. Like all photopigments, that of the hamster has broad spectral absorption, but the efficiency with which it absorbs light varies greatly as a function of wavelength with peak sensitivity at about 500 nm. This species has also been the subject of direct tests of vision, and the triangles in Figure 3.6 plot those results, indicating the sensitivity of this species to lights of different wavelengths. It is apparent that the spectral absorption characteristics of the hamster cone photopigment almost perfectly predict the spectral sensitivity of the behaving animal. Various assumptions and corrections are usually required in order to compare photopigment absorption characteristics and different measurements of vision legitimately, but as the example of Figure 3.6 suggests, photopigment measurements per se may be used to derive strong inferences about the nature of vision. It is partially because of that fact that enormous effort has been directed toward measuring and understanding photopigments in a wide range of different animals.
The spectral absorption properties of photopigments depend on both of the essential components of photopigments. The width of the absorption curve is determined by the structure of the chromophore. In this case nature has been economical because only four different types of chromophores are used to construct all animal photopigments. These pigment chromophores are (a) retinal, the chromophore widely used in the photopigments of many vertebrates and invertebrates; (b) 3-dehydroretinal, used by most freshwater fishes, amphibians, and reptiles; (c) 3-hydroxyretinal, found in the photopigments of certain insects such as flies, moths, and butterflies; and (d) 4-hydroxyretinal, a chromophore apparently used exclusively by a bioluminescent squid. Some animals are able to utilize two different chromophores to make photopigments, and this can (and often does) yield mixtures of photopigments in the retina based on these different chromophores. In addition, some switch from one chromophore to another at different stages in their life cycle (e.g., during metamorphosis in some anurans and during the migration between freshwater and marine environments for some fishes). Changing the chromophore can alter spectral sensitivity, sometimes drastically, and thus chromophore substitutions may significantly impact an animal’s vision.
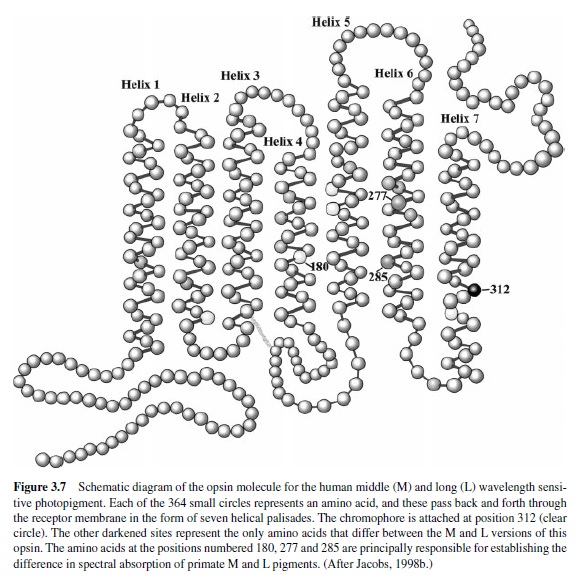
The spectral positioning of the absorption curve of the photopigment depends on the structure of the opsin.As was noted earlier, opsins are membrane-spanning proteins. Figure 3.7 is a schematic of a human cone photopigment opsin. It is composed of seven α-helices that weave back and forth through the membrane. The chromophore is attached to the opsin at the site indicated. All photopigments share this general configuration, but there is individual variation in the total number of amino acids in the polypeptide chain (from about 350 to 400 in different types of photopigment) and in their sequence. These sequence variations determine the spectral absorption properties of the photopigment; thus, because there are many alternate versions of the opsin molecule, there is a correspondingly large number of different photopigments.
Over the years measurements have been made of dozens of different animal photopigments (for summaries see Bowmaker, 1991, 1995; Briscoe & Chittka, 2001). Some generalizations can be drawn from this effort. First, most species have more than one type of photopigment, and their visual behavior is controlled by some combination of signals originating in different pigment types. It is fairly typical to find three, four, or five different kinds of photopigments in a retina, but there is variation from that number in both directions. For instance, the retinas of many deep-dwelling fishes make do with only a single type of photopigment (Bowmaker et al., 1994), whereas, at the other extreme, the current record for pigment production is held by the mantis shrimps, members of a group of crustaceans who are somehow able to make adaptive use of at least 11 different photopigments (Cronin, Marshall, & Caldwell, 2000). Second, although photopigments of different species vary significantly in their spectral positioning along the wavelength axis, the shape of the absorption curves changes in a lawful manner as a function of the location of their peak sensitivity (λmax). This means that mathematical expressions can be derived to produce templates to account economically for the absorption spectra of any photopigment (Baylor, Nunn, & Schnapf, 1987; Carroll, McMahon, Neitz, & Neitz, 2000; Govardovskii, Fyhrquist, Reuter, Kuzmin, & Donner, 2000; Lamb, 1995; Palacios, Varela, Srivastava, & Goldsmith, 1998; Stavenga, Smits, & Hoenders, 1993). Finally, pigments from different animals are frequently positioned at the same spectral locations. For example, in all cercopithecine primates (Old World monkeys, apes, and humans) two of the classes of cone photopigment have spectral locations that are virtually the same for all of the species in this group. This reflects the fact that structural variations in opsins specifying particular pigment positions are often conservatively maintained during the evolution of an animal line.
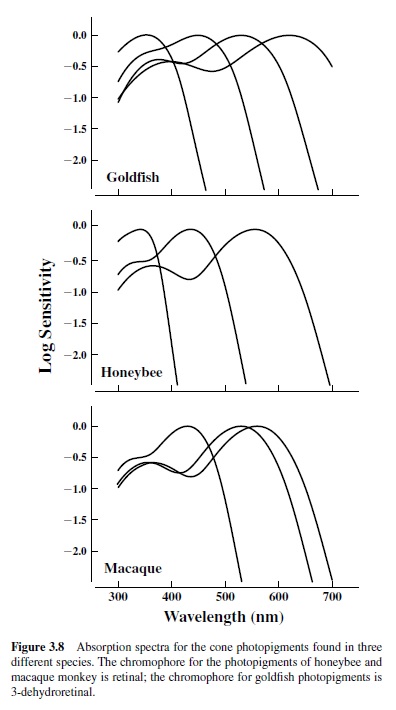
The absorption spectra for the daylight pigments of three species (goldfish, honeybee, and macaque monkey) appear in Figure 3.8. They exemplify the kind of variations in photopigments found among animals. These species have three or four different types of such pigment. In addition, goldfish and monkey have a population of rods subserving vision in low light, and this adds another pigment type to their retinal mix. The pigments from two of these, the honeybee and the macaque monkey, are based on retinal chromophores; goldfish pigments use 3-dehydroretinal. Note that the latter allows one of the fish pigments to be shifted much further into the long wavelengths than can be achieved for pigments built with retinal chromophores and that the spectral absorption bandwidth is greater for these 3-dehydroretinal pigments. Both goldfish and honeybee have photopigments that absorb maximally in the ultraviolet (UV) part of the spectrum. Some mammals (all rodents as far as is now known) have UV pigments, but primates are not among them (Jacobs, 1992). The results of variations in photopigment complements of these kinds are to provide spectral windows to the world that can vary greatly for different animal species. They also set the stage for significant variations in the color vision of different animals.
Opsins are produced by actions of single genes, and the past 15 years have witnessed significant progress in studying and understanding these genes. Opsin genes belong to a large family of cell surface receptors (which include a significant number of hormone and neurotransmitter receptors as well as other sensory receptors) and are believed to derive from a single ancestor in this family. Many different opsin gene sequences have been derived: As of this writing, over 1500 primary sequence for opsins have been deposited in GenBank, a database maintained by the National Center for Biotechnology Information (http://www.ncbi.nlm.nih.gov80/). This accumulation of opsin gene sequences for diverse species in turn permits sequence comparisons from which ideas about the evolution of opsins can be derived. One caution in this enterprise is that the timing of evolutionary events derived from sequence comparisons depends on assumptions about the rate of molecular evolution (the so-called “molecular clock”), and that issue has generated considerable controversy. In particular, there is evidence that the mutation rates commonly used to calibrate suchclocks differ for different groups of animalsand thus that the assumption of a single clock rate appropriate for all cases is unrealistic (Li, 1995). A consequence is that dates given for various events in photopigment evolution are quite provisional.
The eyespots of green algae contain opsins that bear significant sequence similarity to opsins of both invertebrate and vertebrate animals, suggesting that motile microorganisms like them might have been the first to develop photopigments (Deininger, Fuhrmann, & Hegemann, 2000). For historical context, the bacteria that employ pigments for photosynthesis can be traced back at least 3 billion years (Des Marais, 2000). In vertebrates, a single cone photopigment appeared first. Subsequently, this progenitor pigment gene duplicated, and the two diverged in structure, yielding two types of cone pigment having respective maximum sensitivity somewhere in the short and in the long wavelengths. This early divergence has been estimated to have occurred sometime between 400 MYA and 1,000 MYA (Bowmaker, 1998;
Nathans, Thomas, & Hogness, 1986; Neitz, Carroll, & Neitz, 2001). This timing implies that two separate photopigments would have been available for use during the explosive expansion of eyes of the Cambrian period. Rod photopigments evolved from these early cone pigments following another gene duplication and four families of cone pigments also later emerged. A phylogenetic tree summarizing the inferred relationships among the vertebrate photopigments is shown in Figure 3.9. Note that whereas all contemporary vertebrates have rod pigments with only slightly variant spectral absorption properties, cone pigments have evolved to have maximum sensitivity over a much greater portion of the visible spectrum. Phylogenies for insect photopigments based on similar comparisons of opsin sequences are available elsewhere (Briscoe & Chittka, 2001).
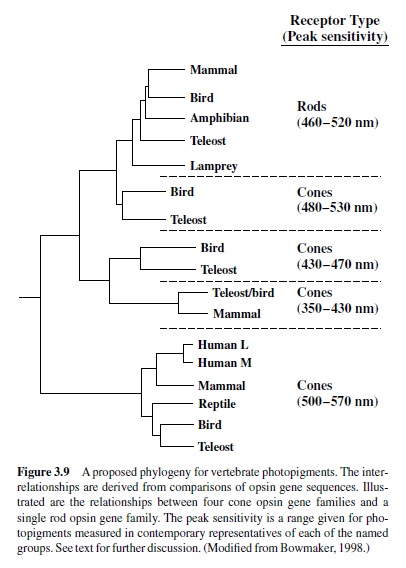
Examination of the vertebrate opsin phylogeny of Figure 3.9 reveals the important fact that photopigments are both gained and lost during evolution. Thus, representatives of all four families of cone photopigments appear in modern animals from several groups (e.g., birds, fishes), but mammals have maintained pigments from only two of these families. How did this occur? One interpretation is that early mammals were nocturnal, and given that lifestyle, it may have been adaptive to increase the representation of rods in the retina in order to maximize sensitivity to the low light levels available during peak activity periods. Perhaps this change was at the expense of losing some daylight (cone-based) vision. Reflecting this loss, most contemporary mammals have only two types of cone pigment (Jacobs, 1993). As we shall see, some primates have added pigments and provide a notable exception to this rule. At the same time, other mammals have moved in the opposite direction; that is, they have lost a photopigment and thus a class of photoreceptors as a direct result of mutational changes in short-wavelength sensitive (S) cone opsin genes. Animals that have suffered this fate include some rodents and nocturnal primates, as well as many (perhaps all) marine mammals (Calderone & Jacobs, 1999; Crognale, Levenson, Ponganis, Deegan, & Jacobs, 1998; Fasick, Cronin, Hunt, & Robinson, 1998; Jacobs, Neitz, & Neitz, 1996; Peichl, Behrmann, & Kroger, 2001). It is not known why all these species have lost this particular cone pigment. Even so, the very presence of these nonfunctional genes makes clear that some ancestors of these animals must have had functional versions of these genes and the pigments they produce, and consequently these mutated genes stand as signposts that can guide us to a better understanding of the evolution of photosensitivity and vision. In any case, one major lesson learned from photopigment phylogenies is that the evolution of photopigments is not a one-way street.
Ocular Filtering
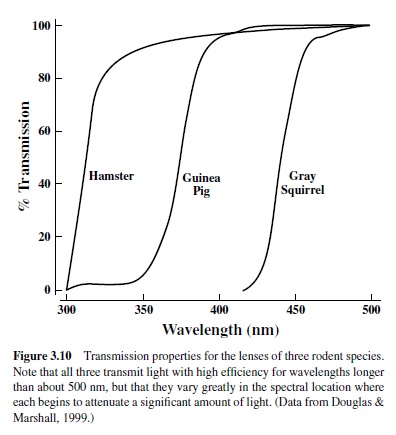
Light has to be absorbed by photopigments to contribute to vision, but light must reach the photopigments in order to be absorbed. The retinas of most animals contain photopigments that have the potential to absorb significant amounts of light well below 400 nm (see Figure 3.8), but that potential often goes unrealized because of intraocular filtering. These filters take many forms and can occur in any anatomical region of both vertebrate and invertebrate eyes (for an extensive review see Douglas & Marshall, 1999). Thus, the corneas or lenses of many species contain pigments that preferentially absorb short-wavelength radiation. An example is given in Figure 3.10, which shows transmission curves measured for lenses taken from the eyes of a number of different mammals. Lenses of this sort are nearly transparent to longer wavelength lights, but they begin to attenuate very steeply at some short-wavelength location, becoming progressively more optically dense and effectively opaque at still shorter wavelengths. The spectral location of the transmission cutoff varies among the species shown in Figure 3.10 such that, for instance, a light of 350 nm will be very heavily attenuated by the squirrel lens but hardly attenuated at all by the hamster lens.
In some cases photoreceptors contain screening pigments. These are called oil droplets, and they are positioned directly in the light path to the photopigment. Many birds and reptiles, as well as some amphibians and fishes, have oil droplets, and frequently there are several different varieties of oil droplets in a single retina (Douglas & Marshall, 1999). Like lens pigments oil droplets serve to attenuate short-wavelength lights, but unlike lens pigments the region of the attenuation may extend well out into the visible spectrum.As a consequence, a person viewing a fresh piece of retina sees these oil droplets as having a deeply colored appearance (red, orange, yellow, and so on). These pigments can serve to change drastically the absorption efficiency of the photopigment lying behind the droplet. There are a wide variety of other intraocular filters found in various animals. Considered as a group, these filters obviously greatly condition the extent to which environmental light contributes to sight.
Intraocular filters serve to reduce the influence that light can have on the visual system, and at first glance this might seem maladaptive. From his studies of the eyes of many different animals, Gordon Walls (1942), one of the great comparative vision specialists of the last century, famously suggested that “everything in the vertebrate eye means something” (p. iii). Following Walls’s dictum, many investigators have felt impelled to try to understand what positive role intraocular filters might play. Avariety of possibilities has been suggested. Among the more popular are these: (a) Intraocular filters might serve to protect the retina from high-energy (and potentially injurious) short-wavelength lights, and this may be particularly important for animals behaviorally active at high light levels; (b) intraocular filters could enhance the quality of the image formed on the photoreceptors by reducing the effects of chromatic aberrations, which are especially troublesome for short-wavelength lights; and (c) for oil droplets particularly, intraocular filters can effectively narrow the spectral sensitivities of photopigments and hence may serve to increase the number of spectral channels. There is little evidence to indicate whether any or all of these ideas are correct, but the presence of intraocular filters in so many different species makes it quite certain that they must play a variety of adaptive roles.
Drawing Inferences About Animal Vision From Photopigment Measurements
In recent years it has become possible to characterize objectively the photopigments of a species by using procedures such as spectrophotometry and electrophysiology, as well as by applying various molecular genetic approaches. These techniques have proven invaluable in identifying the number of types of photopigments in a given retina and in predicting their spectral absorption properties. Paradoxically, it is usually a much more difficult and time-consuming task to make direct measurements of vision in most animals in a way that permits an understanding of how these pigments are used to allow an animal to see (Jacobs, 1981, 1993). A consequence is that there is a near universal tendency to go directly from measurements of photopigments to conclusions about how an animal sees. Although there are plenty of logical and compelling linkages between pigments and vision (as Figure 3.6 reveals), there is also need for caution in trying to establish these links.
One difficulty in making the jump from pigment specification to predictions about vision is that the techniques used for measurement typically do not give information about the prevalence of the receptors containing these photopigments or of their distributions within the retina. Obviously, a small number of receptors containing a particular photopigment that happen to be tucked away in some corner of the retina will have a very different potential impact than if this same photopigment is present in large numbers of receptors liberally spread across the retinal surface. Even when there is some information about photopigment prevalence and distribution, interpretational problems may persist, as they do in the following example. In recent years it has become possible to use immunostaining of opsins to identify and chart the spatial distribution of photopigments contained within a retina (Szel, Rohlich, Caffe, & van Veen, 1996), and when this technique was applied to a marsupial, the South American opossum (Didelphis marsupialis aurita), it was discovered that the animal’s retina contains two classes of cones, one with maximum sensitivity in the short wavelengths and the other in the middle-to-long wavelengths (Ahnelt, Hokoc, & Rohlich, 1995). The presence of two classes of cone pigments would ordinarily be interpreted to suggest the possibility of dichromatic color vision. However, opossum cones were found to be scarce, never reaching a density greater than about 3,000/mm2 (by comparison, rod densities in this same retina may reach 400,000/mm2), and of these cones there are only a handful of S cones (never more than 300/mm2). An obvious concern is whether there are sufficient cone photoreceptors to capture the light needed to generate neural signals that can lead to color vision. Perhaps even more to the point would be to ask whether a devoutly nocturnal species like the opossum would often be active at light levels high enough to ensure such inputs.
A second example of the difficulty in arguing from pigment information to visual capacity comes from study of the coelacanth (Latimeria chalumnae), a fish that lives at depths of 200 m or so in the Indian ocean and that has attracted much attention over the years because it is considered a living fossil, having been little altered over the course of the last 400 million years. Recently, investigators ingeniously succeeded in isolating two opsin genes from the coelacanth, producing photopigment from these genes in an artificial expression system and then measuring the absorption characteristics of these pigments (Yokoyama, Zhang, Radlwimmer, & Blow, 1999). The coelacanth has two photopigments with closely spaced absorption spectra (peaks of 478 nm and 485 nm). These pigments are apparently housed in cone and rod receptors, respectively. What inferences can be drawn about vision in the coelacanth from these observations? By analogy to cases in mammals where feeble color vision may be derived from neural comparisons of rod and cone signals, the authors suggested that the pigments may give the coelacanth some color vision. But how likely is that? For one thing, the coelacanth has only a very small number of cone photoreceptors (Locket, 1980), so neural signals generated from one of the sets of receptors will be minimal at best. A similar reservation comes from the fact that the spectra for two pigments are very close together. In vertebrates, the signals used for color vision reflect a neural computation of the differences in spectral absorption between photopigments. Those differences will be very small for pigments whose spectra are so greatly overlapped, and an unavoidable consequence is that a considerable amount of light will be required to generate reliable difference signals (De Valois & Jacobs, 1984). Would the restricted amount of light available at the ocean depths that mark the home of the coelacanth be sufficient to generate such neural difference signals?
The point to be drawn from these examples is not that measurements of photopigments are unimportant for understanding animal vision. To the contrary, they are quite essential. What should be appreciated, however, is that frequently it is not straightforward to go from photopigment information to an understanding of how and what an animal sees. Care is always required in this step, and whenever possible it is useful to know something about visual behavior in the species under consideration.
The Role of the Nervous System
This section has dealt with a consideration of eyes and what can be learned about comparative vision by examining their structures and functions. Of course, for most animals the processing of information that leads to vision does not end with the eye, but rather with the networks of a visual nervous system that lie beyond the eye. These visual systems can be compact and simple or extensive and highly elaborate, comprised of anywhere from dozens to billions of nerve cells. The variations in structure and organization of visual systems across phyla are so profound as to make impractical any compact summary. Indeed, unlike the optical portions of eyes, where the components and their principals of operation are well understood, much of the detail of the function of visual systems remains still poorly understood, thus making comparison difficult.
Certainly there are many organizational features common to the visual nervous systems of different animals. For example, most visual systems have point-to-point topographic mappingsbetweenthevisualfieldandvarioustargetstructures in the visual system. Thus, topographic maps of this sort are found in mammalian visual cortex, in fish optic tecta, and in the optic lobes of insects. Such organization allows neural economy in the sense that information about contour boundaries in the visual world can be processed using only short-range neural interactions. Although perhaps less universal across phyla, there is also frequently some sort of parallel processing in the visual system that allows for a structural segregation of functional information. In mammalian visual systems, for instance, separate cortical regions are at least partially specialized for the analysis of different aspects of the visual scene. In insects an analogous segregation can be seen in the utilization of subregions of the nervous system for analysis of movement information. Finally, species having restricted nervous systems generally accomplish much of the filtering of environmental information using peripheral mechanisms, whereas relatively less preprocessing is done for species with more expansive nervous systems.The ultimate expansion is in the primate central visual system, where a large fraction of the neocortex is dedicated to the analysis of visual information. This extra processing capacity allows for richness in visual behavior that seems largely absent from animals with smallerand more hardwired visual systems. Indeed, it has been argued that the large expansion of primate visual cortex principally reflects a need for an increase in the processing of complex social-cognitive signals that can be inferred uniquely from examination of the visual world (Barton, 1998). See Cronly-Dillon and Gregory (1991) for detailed information about the visual systems of different animal groups.
Measuring Animal Vision
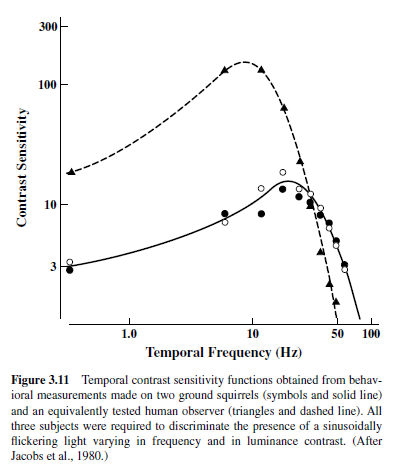
Two general strategies have been used in the study of animal vision. One probes animal vision to explore capacities that seem important based on our understanding of human vision or those that would be useful to establish in order to understand better some biological feature of the visual system. The stimuli in such applications usually isolate some dimension of the visual input (e.g., movement, contour orientation), and visual behavior is most often assessed by measuring thresholds using discrimination-learning paradigms of the sort developed over the years by animal behaviorists (Blake, 1998; Jacobs, 1981). An illustration of results from a study of this kind is shown in Figure 3.11. The goal of this particular experiment was to establish the temporal sensitivity of a small diurnal rodent, the California ground squirrel (Spermophilus beecheyi). The stimuli were sinusoidally flickering lights that were varied in frequency (cycles/second) and in luminance contrast. Through an operant conditioning procedure, ground squirrels were trained to detect the presence of such stimuli. The solid line in Figure 3.11 shows the sensitivity of ground squirrels to stimulus contrast as a function of the frequency of flicker; the dashed line shows discrimination results obtained from a human subject who was equivalently tested. The experiment indicates that although people are superior at detecting flickering lights of low to moderate frequency, for very fast flicker ground squirrels become superior and, indeed, people are quite blind to rapidly flickering lights that can be seen by ground squirrels. As for most experiments of this kind, these results were interpreted in light of details of the biology of the visual system and, to a lesser extent, as a step toward a better understanding of the normal visual behavior of this species (Jacobs, Blakeslee, McCourt, & Tootell, 1980).
A second general strategy for measuring animal vision relies on the use of natural behaviors. These are most frequently behaviors that are reliably elicited by some set of stimulus conditions and that therefore do not require that the animal be trained to perform an arbitrary response. Two examples illustrate this approach. The first involves an analysis of feeding behavior in a teleost fish, the black bream (Acanthopagrus butcheri; Shand, Chin, Harman, & Collin, 2000). In fish like this there are developmental changes in the position of the portion of the retina that has the highest ganglion-cell density (the area centralis) so that as the fish grows, the area centralis migrates from the central retina to a more dorsal location. As noted earlier, high ganglion-cell density is a regional retinal adaptation associated with the presence of heightened visual acuity. The question was whether this developmental change is paralleled by changes in visual behavior. To provide an answer, fish were offered food on the surface, at middepth, and on the bottom of an aquarium. It was discovered that as the fish grew, the preferred feeding location changes in accord with the position of its area centralis; that is, fish exploit that portion of the field that can be scanned with the highest visual acuity. A second example involves the predatory behavior of an insect, the praying mantis (Sphodromantis viridis). These insects sit in wait and skillfully dispatch passing flies by flicking out a leg and striking the prey in flight. The praying mantis has large forward-looking eyes that allow considerable binocular overlap between the two eyes. Rossel (1986) conducted a series of clever experiments involving the mantis’s ability to strike flies accurately. By positioning prisms in front of the eye he was able to demonstrate that accuracy in striking behavior depends on the ability of the mantis’s visual system to compare the angular extent of the target at the two eyes. Both of these examples illustrate the use of natural behaviors to understand better visual problems faced by particular species. Each also yields strong inferences about the relationships between the visual system and behavior.
Three Issues in Comparative Vision
A significant amount of research done on human subjects involves measurement of the limits of vision (e.g., the minimal amount of light required for detection, the highest temporal modulations that can be seen, the smallest wavelength change that can be registered, etc.). This approach can have a number of goals—for instance, to provide insights into visual mechanisms or to serve as a prerequisite for the development of practical applications. Studies of vision in other species are also frequently designed to assess the limits of vision, and these often have the goal of understanding the biology of vision as well. Studies of nonhuman species, however, also serve to focus attention sharply on the utility of vision. If two insect species differ significantly in their abilities to detect moving targets or if two rodent species have very different absolute thresholds, it is quite natural to seek an explanation of that fact in differences in the visual worlds of the respective species. Investigators studying animals that have more stereotypic visual behaviors, and correspondingly more simply organized visual systems, have been particularly avid in championing this kind of approach. In recent years the influence of this way of studying vision (sometimes subsumed under the phrase ecology of vision) has been steadily expanding to encompass a wider range of species, up to and including the primates. Here I cite some examples drawn from the comparative vision literature that are intended both to illustrate variations in animal vision and, where possible, to indicate how these variations relate to the visual demands placed on that animal. For convenience, these illustrations are divided according to three general problems that visual systems must solve.
Detecting Change
From a rodent searching the sky for a flying predator to a driver scanning a crosswalk for the presence of an errant pedestrian, success in seeing requires that novel events in the visual world be quickly detected and accurately appreciated. It is hardly surprising then that biological machinery appropriate for detection of stimulus change is an integral feature of visual systems. The importance of visual change (i.e., spacetime alterations in the distribution of light) was dramatically underlined by early observations on human vision showing that when there is no change in the pattern of light falling on the photoreceptor array (a condition achieved by stabilizing the image of an object formed on the retinal surface), the visual scene simply fades from view after a few seconds to be replaced by a formless percept (Riggs, Ratliff, Cornsweet, & Cornsweet, 1953). In that sense, and at least for people, change and its detection are not just important—they are absolute prerequisites for sight.
Good examples of the ability of animal visual systems to detect change come from studies examining how animals use movement to control behavior. Consider the visual problems encountered by an insect in flight where image motion across the retina is a combination of inputs from stationary backgrounds that are initiated by self-movement and from other moving objects in the field of view. Both of these generate complex input patterns that alter rapidly in configuration, have very high angular velocities, and can change direction unpredictably. Some of these flight behaviors have been well studied. Among these, observations have been made on how houseflies pursue one another (Land & Collett, 1974; Wagner, 1986). The aerial pursuits of flies are quite spectacular, characterized by quick turns made at high angular velocities often separated by periods of little or no turning.Aclear implication is that the fly visual system must be capable of responding to very rapid change. Particularly intriguing is the observation that there are characteristic differences in flight behavior between the two sexes. Although both male and female houseflies pursue targets, males are pursuit specialists. This is because males avidly pursue females in flight, frequently intercepting and then mating with them.
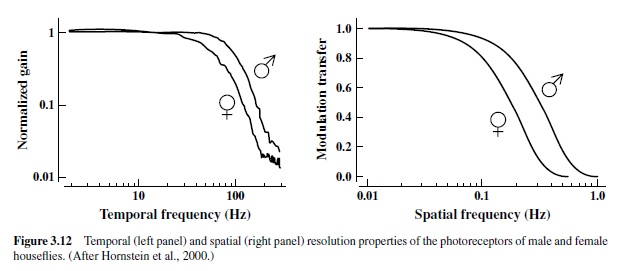
The differences in pursuit behavior of male and female houseflies are uniquely paralleled by anatomical differences in the eye. In male houseflies, a region located in the frontodorsal portion of the eye contains enlarged ommatidia,each of which has a correspondingly larger facet lens (Land & Eckert, 1985).As was noted earlier, enlargement of the lens is an evolutionary strategy that allows a local increase in the acuity of compound eyes.There are other differences in the structure of these ommatidia in eyes of males and females, and there are alsowiringdifferencesinthevisualnervoussystemsuniqueto the two sexes. The result is that the visual systems of houseflies show a significant sexual dimorphism that appears to correlate with the differences in aerial pursuit behavior. The portion of the eye in the male housefly that is adapted for initiating visual pursuit behavior has been fittingly dubbed the “love spot,” and direct recordings made from photoreceptors in this region show clear differences between males and females (Hornstein, O’Carroll, Anderson, & Laughlin, 2000). Figure 3.12 illustrates some of these differences. The left panel shows an index of temporal resolution of the photoreceptors of male and female houseflies. The curves effectively compare how efficiently receptors code information about lights presented at different temporal frequencies. In general, fly photoreceptors respond very well to high-frequency temporal change (e.g., they detect changes in visual stimuli at temporal frequencies of better than 100 Hz, a rate above what the human eye can discern), but male photoreceptors are clearly superior in this regard, showing about a 60% improvement above that achieved by the receptors from female eyes. The right panel of Figure 3.12 shows measurements made of the spatial resolution of these same fly photoreceptors. Again, the specialized photoreceptors of the male flies are significantly better than the corresponding female receptors at resolving spatial change. These clear differences in photoreceptor organization give males superior spatial and temporal resolution, and this in turn better enables them to locate and pursue small targets, such as females in flight.
Specialized visual adaptations always incur some cost, and the case of the housefly provides an example. Specifically, the faster responses of the male fly photoreceptors, involving as they do shorter time constants and higher membrane conductances, will require greater metabolic energy. There is likewise the burden of increasing the size of the facet lens to support higher acuity. It has been suggested that the better vision these adaptations give male flies are balanced by the energetic demands that are uniquely placed on female flies in reproduction, including activities such as egg production and laying (Hornstein et al., 2000).
Animals employ a variety of means to shift their direction of gaze—direct eye movements of various kinds, movements of the head, or indeed movements of the whole body. It is been argued that the goal of these movements is not to scan the surroundings continuously, as one might imagine, but rather to try to keep an image relatively fixed on the retina by employing rapid adjustments of eye position followed by a period of smooth tracking before further adjustments are initiated. In this view animals obtain a sampling of a series of more or less stationary images, as for instance many animals do during the fixations that are separated by rapid saccadic eye movements. In a recent review Land emphasized the commonality of this strategy across many different species and pointed out several reasons why it is advantageous to sample more or less stationary images than to allow continuous image movement across the eye (Land, 1999b). For one thing, fast movement of an image across the receptors leads to blurring. The occurrence of motion blurring depends both on the response speed of the eye and its spatial resolution. Eyes with higher response speeds and lower spatial resolution can tolerate movement at higher speeds without losing resolution. For example, at movement speeds of only 3 deg/s much spatial detail disappears from human vision, whereas insects, having lower spatial resolution and receptors with faster response speeds, show little loss of resolution for objects moving with velocities of up to 100 deg/s (Land, 1999b). Second, measurements show that it is easier to detect moving objects if the retinal image of the background is held stationary, as can be achieved through the use of compensatory eye movements. There are other, more complicated, reasons for why it may be important to achieve a relatively stable fixation of an object of interest. What is remarkable is that even though the nature of their visual systems may differ drastically, most animals employ some combination of mechanisms to reach this same goal (Land, 1999b).
Resolving Spatial Structure
Anumber of features determine whether an animal will see an object. Among these, the size of the target and the degree to which the target contrasts with its surroundings are centrally important. Following the trend set by studies of human vision, early research on other animals concentrated on the utilization of object size as a cue to detection. This was mostly accomplished by assessing visual acuity through measurement of the smallest target that could seen or, more usually, the minimal size differences that could be detected (e.g., the smallest separation between two parallel lines). In recent years the contrast dimension has begun to receive equal scrutiny. With the widespread application of linear systems analysis to vision and the visual system, a typical contemporary experiment involves the determination of detection threshold for sinusoidal grating patterns that are jointly variant in size (spatial frequency, specified in cycles per degree of visual angle and thus directly translatable into retinal dimensions) and contrast (the difference in luminance or chromaticity between the peak and trough of the sinusoid). The results are plotted as spatial contrast sensitivity functions, a depiction quite analogous to the temporal contrast sensitivity functions of the sort presented earlier (Figure 3.11).
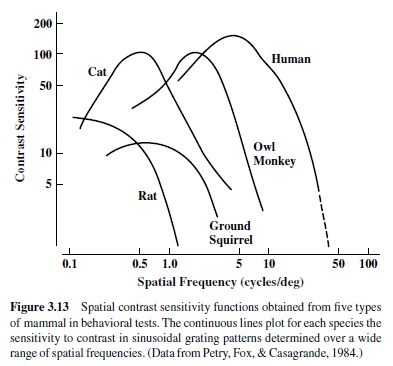
Figure 3.13 shows spatial contrast sensitivity functions obtained from five types of mammals. These include diurnal (man) and nocturnal (owl monkey) primates, a nocturnal carnivore (cat), and diurnal (ground squirrel) and nocturnal (rat) rodents. In each case, the animal was asked to detect the presence of a stationary sinusoidal luminance grating; the curve plots the reciprocal of threshold contrast required to see each grating. These functions have an inverted U shape such that some intermediate-size grating is detectable at lowest contrast and then visibility declines, precipitously for higher spatial frequencies and more gradually for lower spatial frequencies.
It has been argued that when properly scaled, contrast sensitivity functions from all species have the same common shape (Uhlrich, Essock, & Lehmkule, 1981). There is obvious large variation in the range of spatial frequencies these species can detect such that if viewed from the same distance, a highfrequency grating plainly visible to primate subjects is completely invisible to the rodents. Given the shapes of these functions, the inverse conclusion also holds; that is, a low spatial frequency target seen by a cat may go undetected by a human observer. The spatial frequency value obtained from extrapolation of the upper limb of the curve down to maximum contrast (indicated by the dashed line for the human observer) defines the high-frequency cutoff. It approximates the single value obtained from standard acuity tests like the familiar eye charts in which all the stimuli are presented at maximum contrast.
Contrast sensitivity functions are heavily influenced by the details of the test situation. In particular, (a) for technical reasons it is hard to arrange an adequate test at the very low spatial frequencies; (b) the shape and height of the function depend on the average light level of the target; and (c) because all retinas are to some extent heterogeneous, the details of how the subject views the targets are important.Therefore,detailed comparisons of functions of the sort shown in Figure 3.13 require caution. One useful feature in comparative experiments of these types is to include a reference standard—for instance, results from human observers tested in the same situation as the animal of interest. In any case, there is a clear relationship between the ranges of spatial frequencies to which an animal is sensitive and its visual world—many objects of interest to a primate will appear at a distance so that much of the object will consist of higher spatial frequencies whereas for rodents similar objects will be viewed at close range and thus have their energies concentrated at lower spatial frequencies.
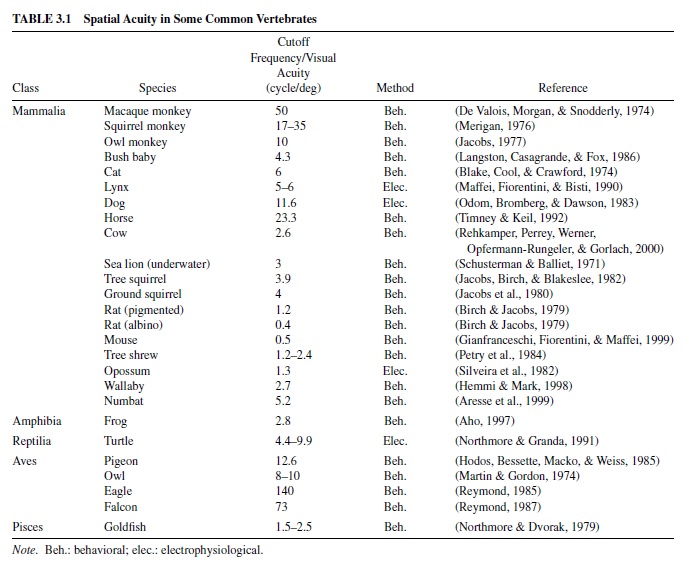
Table 3.1 provides estimates of spatial acuity in a range of common vertebrates. Included are single values that express (in cycles/deg) the limit of resolution in each species. These were obtained either by extracting the cutoff frequency of the spatial contrast sensitivity function or from a direct measure of visual acuity. Most were derived from behavioral tests, although a few were inferred from electrophysiological measurements. Even though the comparability of these results is subject to the reservations noted earlier, it obvious that there is a huge (>8 octaves) variation in the spatial acuity of these various animals.
The wedge-tailed eagle (Aquila audax) represents the upper end of the acuity distribution of Table 3.1. Like other raptors, this bird has phenomenal visual acuity, in this case about two and one-half times better than that of an equivalently tested human (Reymond, 1985). Raptor retinas are bifoveate, having a deep central fovea pointing about 45 deg away from the head axis and a shallower temporal fovea that points within 15 deg of the head axis. Distant objects are principally viewed with the deep foveae; near objects are principally viewed with shallow foveae (Tucker, 2000). A number of adaptations in the eye of this bird support high spatial acuity. First, cone photoreceptors are very densely packed together in the deep fovea. Second, the axial length of the eagle eye is long (about 35 mm vs. 24 mm in the human eye), allowing for a large retinal image. Finally, with the fully constricted pupil produced by high ambient light levels, the eagle eye shows only minimal evidence of optical aberrations (Reymond, 1985). These features combine to allow eagles to specialize in resolving high-frequency targets, such as would be presented by a small prey viewed from great heights.An interesting limitation on eagle visual acuity is its extreme dependence on light level.As acuity targets are dimmed, there is a precipitous decline in visual acuity so that eagle acuity actually becomes poorer than that of human observers at low light levels.
Among the species of Table 3.1 with relatively poor spatial vision is the opossum, a marsupial whose visual acuity barely exceeds 1 cycle/deg.The differences between eagle and opossum spatial vision and their visual worlds are instructive. As high-flying predators that alter their position rapidly and have to detect small targets, eagles require excellent spatial and temporal resolution. The visual adaptations that yield these properties (minimal spatial and temporal summation) require bright visual environments.As noted, one cost to the eagle for good spatial vision is much diminished capacity at low light levels. As a slow-moving omnivorous creature with a foreshortened visual world, the opossum has almost the opposite problem. Its nocturnal environment offers only a small amount of light. To harvest photons efficiently, the pupillary aperture is opened wide, and the retinal wiring is arranged to support increased spatial summation of neural signals.The result is diminished spatial acuity but the ability to see under very low light levels. Interestingly, unlike the eagle, spatial acuity in the opossum changes little over a considerable range of luminance differences (Silveira, Picanco, & Oswaldo-Cruz, 1982). Whether nocturnal species like the opossum require increased spatial or temporal summation or some specific combination of the two is a complex question, the answer to which appears to depend on the details of their behavior (Warrant, 1999).
Here we have considered the spatial resolution abilities of various vertebrates. As indicated previously, compound eyes present an entirely different set of restrictions and opportunities. Visual acuity in compound eyes is determined principally by the angular spacing of the ommatidia, and on average this limits visual acuity to about 0.5 cycle/deg. Measurements of acuity of a number of insects reveal that some exceed this value through regional specializations of the compound eye of the sort described earlier. On the other hand, many nocturnal insects also have much poorer visual acuity than this value. In a number of cases direct correspondences can be seen between insect spatial vision and their visual behaviors (Land, 1997).
Exploiting Chromatic Cues
At the beginning of this research paper I noted that there is virtually infinite variation in the spectral energy distributions from light sources and objects and that light thus offers an immense amount of potential information to a viewer. How much of this potential is realized? Photopigments effectively serve as counters that initiate a photoreceptor signal whose magnitude reflects the number of captured photons. That signal is transformed by the visual system into a visual sensation correspondingly varying in magnitude. If the eye has only a single photopigment, the resulting sensation lies along a single dimension. In the case of human vision this is the dimension of brightness or lightness. For human viewerstested at any single state of light adaptation, there are only 100 or so discriminable steps along this (achromatic) dimension. Having had only a single photopigment, it is a reasonable guess that our earliest seeing ancestors likely were similarly limited. An early step in the evolution of eyes was the addition of a second type of photopigment (Figure 3.9). This provides potential benefits because it expands significantly the size of the spectral window through which photons can be captured and thus yields a considerable visual advantage given the broad spectral patterns of most naturally occurring stimuli. If the outputs from receptors containing the two types of pigments are simply added together, the number of discriminable brightness steps will not increase. On the other hand, if signals originating from the two photopigments are compared in the nervous system in a fashion that computes the relative effectiveness of any light on the two pigments, a new dimension of sensation can emerge: color.
The mechanism allowing this new (chromatic) dimension is the presence in the nervous system of spectrally opponent neurons.These cells effectively subtract the (log transformed) inputs from afferents carrying signals that originated in the two types of pigments. Such information allows one to distinguish between variations in the wavelength and radiance content of a stimulus. So, for example, color vision allows discrimination between stimuli having their peak radiances in the long and short wavelengths respectively (like the sun and blue sky of Figure 3.1) regardless of their absolute radiance levels. The effect of this arrangement is to add a second, orthogonal, dimension to the animals’discrimination space, and because this chromatic dimension adds information at each of the span-of-brightness steps, the net result is enormous expansion in the number of radiance-wavelength combinations that can be effectively discriminated one from another. The presence of spectrally opponent cells in the visual systems of virtually all animals attests to the great advantage that accrues from both adding a second pigment and then using such mechanisms to gain a dimension of color vision. An alternative argument offered for the early evolution of spectrally opponent mechanisms is that they are relatively insensitive to fast flickering lights and thus that they may have served to remove the perception of flicker resulting from wave action that is inherent in shallow water environments. Such flicker, it is argued, would have made it difficult to detect the presence of potential predators (Maximov, 2000).
In the course of evolution, opsin gene changes added pigments to the original two with the result that, for instance, contemporary vertebrates may have three or four separate types of cone pigments. Through additional spectral opponency, the presence of a third pigment type can potentially provide another dimension of color vision. This allows for much finer discriminations among stimuli that vary in spectral content, and the net result is that the number of differences that can be discerned among stimuli that vary in wavelength and radiance climbs very significantly. Humans have three cone photopigments and two dimensions of chromatic experience (red/green and yellow/blue) in addition to an achromatic dimension. What this does for discrimination can be inferred from a recent estimate suggesting that people should be able to discern as many as 2.3 million different colors (Pointer & Attridge, 1998). This is a staggering number, and whether or not this estimate is accurate, it underlines one of the great advantages of acquiring a color vision capacity.
The relationship between number of photopigments and color vision dimensionality just described was firmly established through studies of normal and defective human color vision. Most people have three types of cone pigments and trichromatic color vision. Those individuals reduced to two types of cone pigments through gene changes have a single chromatic dimension (dichromatic color vision). Pigment complements are now known for many species, and a basic question is how well these relationships between pigments and color vision hold for other animals. Studies sufficient to establish the dimensionality of color vision have been reported for a number of nonhuman species (for reviews, see Jacobs, 1981; Menzel & Backhaus, 1991; Neumeyer, 1998). Thegeneraloutcomeisthatthenumberofphotopigmenttypes can indeed predict the dimensionality of color vision. Thus, for example, of the species whose pigments are represented in Figure 3.8, the honeybee and macaque monkey have three photopigments and are trichromatic, whereas the goldfish with four pigments has acquired an added dimension of color vision and is tetrachromatic. Although results from pigment measurements and tests of color vision often line up well, there are instances where human color vision does not provide a very good model for color vision in other species. One example of this comes from behavioral studies of insects showing that although the utilization of signals from different photopigment types are processed through opponent mechanisms, they may be compulsively linked to specific aspects of behavior; for example, feeding responses and egg laying in butterflies are triggered by the activity of different combinations of photopigment signals (Menzel & Backhaus, 1991). Color vision in these species simply does not have the generality across stimulus conditions of the kind characteristic of human color vision.
Although knowledge of the number of photopigments may provideinsightintothedimensionalityofananimals’colorvision, that fact by itself does not predict how acute the resulting color vision will be. That property will depend on the number the cones containing different pigments types, on their spectralpropertiesandspatialdistributionsintheretina,andonthe nature of chromatic opponent circuits formed from their outputs. Domestic cats and human deuteranopes both have two types of cone pigments with spectral properties that are not greatly different for the two species, and both formally have dichromatic color vision. However, with many more cones and much more robust spectral opponency, the human dichromat will have much better color vision than the cat. The point is that the quality of the resulting color vision, and likely the centrality of its role in vision, can be established only through appropriate behavioral examinations.
The human model gives us great familiarity with trichromatic color vision, but at least among vertebrates it seems possible that tetrachromatic color vision may be at least as widespread as trichromatic color vision. Many teleost fish have four types of cone pigments, as do many birds, and they could all be tetrachromats (Bowmaker, 1995; Bowmaker, Heath, Wilkie, & Hunt, 1997; Vorobyev, Osorio, Bennett, Marshall, & Cuthill, 1998).The question of why some animals have dichromatic color while others are trichromats or even tetrachromats remains unanswered. One suggested answer is based on the nature of photopigment spectra and the spectral band over which animals see (Kevan & Backhaus, 1998). The spectral span covered by the photopigments of tetrachromats is larger than that of trichromats (compare goldfish photopigments to those of the other species shown in Figure 3.8). The generation of color signals by spectral opponency requires that the spectral sensitivities of the pigments being compared overlap. Because the bandwidths of pigment spectra are fixed, in order to assure sufficient overlap to yield usable color signals onenecessarilyrequiresadditionalpigmentstocoverabroader spectral window. Some calculations suggest that for optimal color discrimination one pigment is required for about every 100 nm of spectral range (Kevan & Backhaus, 1998). This argument may seem a bit circular in the sense that it does not answerthequestionofwhyoneneedsanexpandedspectralrange to begin with. The answer to that question presumably lies in the details of how individual species use their color vision.
If adding more cone types and more dimensions in color spaces greatly expands the range of discriminations that can be made, why have all animals not become, say, pentachromats? This, too, undoubtedly reflects the nature of discriminations that are important for survival in any particular animal line. More generally, however, there are inevitable costs associated with adding cone types to support a new color vision capacity. For one thing, adding a new class of cone reduces the number of cones containing the previous pigment types and hence reduces the signal to noise ratio of each of the cone types. This could make the color vision less efficient (Vorobyev & Osorio, 1998; Vorobyev et al., 1998). For another, in many visual systems the neural circuits required to yield spectral opponency are quite specific, so acquiring new color capacity may require elaborate nervous system changes as well as pigment addition.
Opsin genes were apparently lost during the early history ofmammals (Figure3.9),andasaresultthebaselinecondition for contemporary mammals is the presence of two different types of cone photopigment in the retina. This allows many mammals to have dichromatic color vision, although even that capacity is often somewhat feeble because most animals of this group do not have large numbers of cones (Jacobs, 1993). Primates provide a striking exception to this picture: Their retinas typically contain lots of cones, and many of them have excellent trichromatic color vision. Because good color vision must somehow have reemerged among the primates, the story of color vision in this group can provide a good example of the utility of exploiting chromatic cues.
Some 90 species of catarrhine primates (Old World monkeys, apes, and people) share in common their color vision capacities (Jacobs & Deegan, 1999). It appears now that all of these animals have keen trichromatic color vision based on the presence of three classes of cone containing pigments absorbing maximally in the short (S), middle (M), and long (L) wavelengths and an associated visual system that supports spectrally opponent comparisons of signals from these three. The genes specifying the three opsins are located on Chromosome 7 (S)and at neighboring locations on the X chromosome (M and L), the latter two being almost structurally identical (Nathans et al., 1986). New World (platyrrhine) monkeys present a very different picture. Most of these species have polymorphic color vision with individual animals having any of several versions of trichromatic or dichromatic color vision so that there may be as many as six discretely different forms of color vision within a species (Jacobs, 1998a). The polymorphism reflects variations in the array of cone pigments found in individual animals that in turn arise from opsin gene variations. Like the catarrhines, the S-opsin gene in these monkeys is on Chromosome 7, but unlike the Old World primates the platyrrhine monkeys have only a single X-chromosome opsin gene.There is M/Lgene polymorphism at that locus, accounting for the individual variations in color vision. As indicated in Figure 3.14, all these monkeys share in common the S pigment, but individuals have either any one of the three M/L pigments or any pair of the three, leading to six different color vision phenotypes.An important feature of the polymorphism is that because males have only a single X chromosome, they will inevitably have only a single M/L pigment and, thus, dichromatic color vision. With the benefit of two X chromosomes, females may become heterozygous at the pigment gene locus, and if they do, they have two different M/L pigments and trichromatic color vision (Jacobs, 1984).
There is even further variation in color vision of the New World monkeys. Earlier I noted that some mammals have lost functional S-cone pigments through opsin gene mutation. One such animal is the nocturnal owl monkey (Aotus) that, by having only a single M/L cone pigment and no S pigment, ends up with no color vision at all (Jacobs, Deegan, Neitz, Crognale, & Neitz, 1993). A second exception to this polymorphic theme is seen among howler monkeys (Alouatta). Instead of being polymorphic, these monkeys have a gene/ photopigment/color vision arrangement that is effectively the same as that of the Old World monkeys (i.e., they are universally trichromatic). Finally, Figure 3.14 illustrates a polymorphism that is based on three M/L opsin genes, but the fact is that some species of New World monkey have only two such genes while others may exceed three (Jacobs, 1998a).
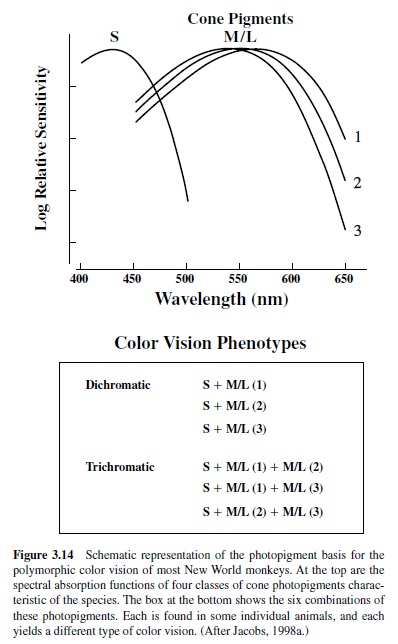
Figure 3.15 summarizes the color vision variations so far described among the anthropoid primates. The figure includes results from species drawn from about half of the 43 genera that make up this group. This information, along with comparisons of primate opsin gene sequences, can provide scenarios for the evolution of primate color vision. One is that our earliest primate ancestors had two cone pigments (an S and a single M/L pigment) similar to that seen in most other mammals. Perhaps about 30 MYA to 40 MYA that single X-chromosome gene duplicated and the newly produced gene subsequently diverged in structure so that the pigment it specified differed in spectral absorption from the product of the original gene. This would allow for separate M and L pigments and set the stage for routine trichromatic color vision. The fact that the details of color vision are so similar among all of the catarrhine primates is evidence that these gene changes occurred early in catarrhine evolution. It further seems likely that the lines to modern platyrrhines and catarrhines diverged at a time prior to the point of gene duplication (Arnason, Gullberg, & Janke, 1998). An implication of this conclusion is that the polymorphism that allows some individuals to have trichromatic color vision was entirely a platyrrhine invention.
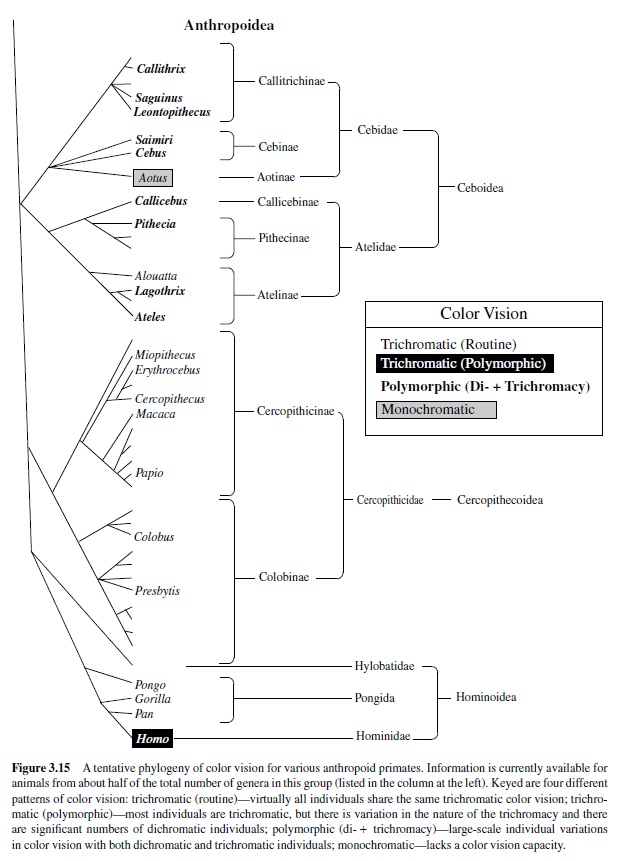
Tests of dichromatic and trichromatic humans show that there are enormous visual advantages in being trichromatic, and the same conclusion is supported by the fact that trichromacy has been conservatively maintained in all of the Old World monkeys and apes. Given that, why haven’t the New World monkeys moved beyond the polymorphic arrangement that allows only about half of the individuals to have a trichromatic capacity? It may be nothing more than a matter of bad timing. The gene duplication that was required to convert catarrhines from dichromats to trichromats is a low probability event. It occurred early in catarrhine history, well before the great burst of speciation in that line, and thus all succeeding animals were able to profit from the change. X-chromosome opsin gene duplication has also happened at least once in platyrrhines (in the howler monkeys, as mentioned earlier). Unfortunately, this duplication occurred subsequent to much of the divergence that has led to modern day platyrrhines (perhaps only about 13 MYA), and thus no other NewWorld monkeys have been able to take advantage of the color vision arrangement that the howler monkeys invented.
Studies such as those of primate color vision provide excellent examples of evolutionary changes in an important feature of animal vision. It is clear that color vision can increase dramatically an animal’s capability to discriminate differences in its visual world, and it is useful to consider briefly the ends to which this enhanced capacity is directed. There is much contemporary discussion of the practical utility of color vision, of how a particular color capacity fits into local need. Thus, for example, the relationships between floral coloring and insect color vision (Kevan & Backhaus, 1998), between bird plumage characteristics and avian color vision (Vorobyev et al., 1998), and between fish color vision and fish coloration (Marshall, 2000) have all been examined. For the primates, a common hypothesis is that many primates are frugivorous and must find fruit—a target that is often embedded in a sea of foliage—and therefore must determine whether that fruit is properly ripe (Figure 3.3). The principal cues for these tasks are the differences in the spectral reflectance properties of the fruit and their surroundings, and, as the argument goes, an ability to detect such differences could be materially aided by a trichromatic color capacity (Jacobs, 1999; Mollon, 1991). Thus, it may be that this relationship supported the evolution of primate trichromatic color vision. A number of recent studies that consider direct measurements of the spectral properties of target fruits in the context of the details of monkey vision do find that primate trichromacy is well suited for these fruit-harvesting tasks (Osorio & Vorobyev, 1996; Regan et al., 1998; Sumner & Mollon, 2000b). A problem is that most trichromatic primates are not exclusive frugivores, and some even eschew fruits almost completely. To account for them, it is suggested that trichromatic color vision is also particularly well suited for the detection and evaluation of leaves that make up a principal part of the diet of many species (Lucas, Darvell, Lee, Yuen, & Choong, 1998), and there is evidence for that possibility as well (Dominy & Lucas, 2001; Sumner & Mollon, 2000a).
Conclusion
Proverbs (29:8) instructs us, “Where there is no vision, the people perish.” In its literal sense this famous biblical citation is incorrect, both for people and for other species. It is clearly possible to survive and prosper without any vision at all, as for instance some species of cave fish and burrowing rodents are able to do. But these are clear exceptions, and the vast majority of animals has evolved and carefully maintained the biological machinery required to extract meaning from light. Comparative studies of vision and the visual system of the sort covered in this review have proven invaluable in revealing the impressive range of mechanisms that can be used to support sight. Understanding these adaptations provides a key to our appreciation of the natural world and is utterly indispensable in illuminating our own vision.
Bibliography:
- Ahnelt, P. K., Hokoc, J. N., & Rohlich, P. (1995). Photoreceptors in a primitive mammal, the South American opossum, Didelphis marsupalis aurita: Characterization with anti-opsin immunolabeling. Visual Neuroscience, 12, 793–804.
- Ahnelt, P. K., & Kolb, H. (2000). The mammalian photoreceptor mosaic-adaptive design. Progress in Retinal and Eye Research, 19, 711–770.
- Aho, A. C. (1997). The visual acuity of the frog (Rana pipiens). Journal of Comparative Physiology, 180A, 19–24.
- Aresse, C., Dunlop, S. A., Harman, A. M., Brackevelt, C. R., Ross, W. M., Shand, J., & Beazley, L. D. (1999). Retinal structure and visual acuity in a polyprotodont marsupial, the fat-tailed dunnart (Sminthopsis crassicaudata). Brain, Behavior, and Evolution, 53, 111–126.
- Arnason, U., Gullberg, A., & Janke, A. (1998). Molecular timing of primate divergences as estimated by two nonprimate calibration points. Journal of Molecular Evolution, 47, 718–727.
- Barton, R. A. (1998). Visual specialization and brain evolution in primates. Proceedings of the Royal Society of London, 265B, 1933–1937.
- Baylor, D. A. (1996). How photons start vision. Proceedings of the National Academy of Sciences, USA, 93, 560–565.
- Baylor, D. A., Nunn, B. J., & Schnapf, J. L. (1987). Spectral sensitivity of cones of the monkey Macaca fascicularis. Journal of Physiology, 357, 145–160.
- Birch, D. G., & Jacobs, G. H. (1979). Spatial contrast sensitivity in albino and pigmented rats. Vision Research, 19, 933–937.
- Blake, R. (1998). The behavioural analysis of animal vision. In J. G. Robson & R. H. S. Carpenter (Eds.), Vision research: A practical approach (pp. 137–160). Oxford, UK: Oxford University Press.
- Blake, R., Cool, S. J., & Crawford, M. L. J. (1974). Visual resolution in the cat. Vision Research, 19, 933–937.
- Bowmaker, J. K. (1991). Visual pigments, oil droplets and photoreceptors. In P. Gouras (Ed.), The perception of colour (pp. 108– 127). Boca Raton, FL: CRC Press.
- Bowmaker, J. K. (1995). The visual pigments of fish. Progress in Retinal and Eye Research, 15, 1–31.
- Bowmaker, J. K. (1998). Evolution of colour vision in vertebrates. Eye, 12, 541–547.
- Bowmaker, J. K., Govardovskii, V. I., Shukolyukov, S. A., Zueva, L. B., Hunt, D. M., Sideleva, V. G., & Smirnova, O. G. (1994). Visual pigments and the photic environment: The Cottoid fish of Lake Baikal. Vision Research, 34, 591–605.
- Bowmaker, J. K., Heath, L. A., Wilkie, S. E., & Hunt, D. M. (1997). Visual pigments and oil droplets from six classes of photoreceptor in the retinas of birds. Vision Research, 37, 2183–2194.
- Briscoe, A. D., & Chittka, L. (2001). The evolution of color vision in insects. Annual Review of Entomology, 46, 471–510.
- Calderone, J. B., & Jacobs, G. H. (1999). Cone receptor variations and their functional consequences in two species of hamster. Visual Neuroscience, 16, 53–63.
- Calderone, J. B., Reese, B. E., & Jacobs, G. H. (1995). Retinal ganglion cell distribution in the spotted hyena, Crocuta crocuta. Society for Neuroscience Abstracts, 21,
- Carroll, J., McMahon, C., Neitz, M., & Neitz, J. (2000). Flicker-photometric electroretinogram estimates of L:M cone photoreceptor ratio in men with photopigment spectra derived from genetics. Journal of the Optical Society of America, 17A, 499–509.
- Collin, S. P. (1999). Behavioural ecology and retinal cell topography. In S. N.Archer, M. B.A. Djamgoz, E. R. Loew, J. C. Partridge, & S. Vallerga (Eds.), Adaptive mechanisms in the ecology of vision (pp. 509–535). Dordrecht, The Netherlands: Kluwer.
- Crognale, M.A., Levenson, D. H., Ponganis, P. J., Deegan, J. F., II, & Jacobs, G. H. (1998). Cone spectral sensitivity in the harbor seal (Phoca vitulina) and implications for color vision. Canadian Journal of Zoology, 76, 2114–2118.
- Cronin, T. W., Marshall, N. J., & Caldwell, R. L. (2000). Spectral tuning and the visual ecology of mantis shrimps. Philosophical Transactions of the Royal Society, London, 355B, 1263–1268.
- Cronly-Dillon, J. R., & Gregory, R. L. (1991). Evolution of the eye and visual system (Vol. 2). Boca Raton, FL: CRC Press.
- Deininger, W., Fuhrmann, M., & Hegemann, P. (2000). Opsin evolution: Out of the wild green yonder? Trends in Genetics, 16, 158–159.
- Des Marais, D. J. (2000). When did photosynethsis emerge on earth? Science, 289, 1703–1704.
- De Valois, R. L., & Jacobs, G. H. (1984). Neural mechanisms of color vision. In I. Darian-Smith (Ed.), Handbook of physiology: Vol. 3. Sensory processes. Baltimore: Williams and Wilkins.
- De Valois, R. L., Morgan, H. C., & Snodderly, D. M. (1974). Psychophysical studies of monkey vision: III. Spatial contrast sensitivity of macaque and human observers. Vision Research, 14, 75–81.
- Dominy, N. J., & Lucas, P. W. (2001). Ecological importance of trichromatic colour vision to primates. Nature, 410, 363–365.
- Douglas, R. H., & Marshall, N. J. (1999).Areview of vertebrate and invertebrate ocular filters. In S. N. Archer, M. B. A. Djamgoz, E. R. Loew, J. C. Partridge, & S. Vallerga (Eds.), Adaptive mechanisms in the ecology of vision (pp. 95–162). Dordrecht, The Netherlands: Kluwer.
- Endler, J. A. (1993). The color of light in forests and its implications. Ecological Monographs, 63, 1–27.
- Fasick, J. I., Cronin, T. W., Hunt, D. M., & Robinson, P. R. (1998). The visual pigments of the bottlenose dolphin (Tursiops truncatus). Visual Neuroscience, 15, 643–651.
- Fernald, R. D. (2000). Evolution of eyes. Current Opinion in Neurobiology, 10, 444–450.
- Gianfranceschi, L., Fiorentini, A., & Maffei, L. (1999). Behavioural visual acuity of wild type and bc12 transgenic mice. Vision Research, 39, 569–574.
- Goldsmith, T. H. (1990). Optimization, constraint, and history in the evolution of eyes. Quarterly Review of Biology, 65, 281–322.
- Govardovskii, V. I., Fyhrquist, N., Reuter, T., Kuzmin, D. G., & Donner, K. (2000). In search of the visual pigment template. Visual Neuroscience, 17, 509–528.
- Hawryshyn, C. W. (1992). Polarization vision in fish. American Scientist, 80, 164–175.
- Hemmi, J. M., & Mark, R. F. (1998). Visual acuity, contrast sensitivity and retinal magnification in a marsupial, the tammar wallaby (Macropus eugenii). Journal of Comparative Physiology, 183A, 379–387.
- Hodos, W., Bessette, B. B., Macko, K. A., & Weiss, S. R. (1985). Normative data for pigeon vision. Vision Research, 25, 1525– 1527.
- Hornstein, E. P., O’Carroll, D. C., Anderson, J. C., & Laughlin, S. B. (2000). Sexual dimorphism matches photoreceptor performance to behavioural requirements. Proceedings of the Royal Society of London, 267B, 2111–2117.
- Hughes, A. (1977). The topography of vision in mammals of contrasting life style: Comparative optics and retinal organization. In F. Crescitelli (Ed.), The visual system in vertebrates (Vol. 7, pp. 613–756). Berlin: Springer-Verlag.
- Jacobs, G. H. (1977). Visual capacities of the owl monkey (Aotus trivirgatus): II. Spatial contrast sensitivity. Vision Research, 17, 821–825.
- Jacobs,G.H.(1981).NewYork:Academic Press.
- Jacobs, G. H. (1984). Within-species variations in visual capacity among squirrel monkeys (Saimiri sciureus): Color vision. Vision Research, 24, 1267–1277.
- Jacobs, G. H. (1992). Ultraviolet vision in vertebrates. American Zoologist, 32, 544–554.
- Jacobs, G. H. (1993). The distribution and nature of colour vision among the mammals. Biological Reviews, 68, 413– 471.
- Jacobs, G. H. (1998a). A perspective on color vision in platyrrhine monkeys. Vision Research, 38, 3307–3313.
- Jacobs, G. H. (1998b). Photopigments and seeing: Lessons from natural experiments. Investigative Ophthalmology and Visual Science, 39, 2205–2216.
- Jacobs,G.H.(1999).Visionandbehaviorinprimates.InS.N.Archer, M. B. A. Djamgoz, E. R. Loew, J. C. Partridge, & S. Vallerga (Eds.), Adaptive mechanisms in the ecology of vision (pp. 629– 650). Dordrecht, The Netherlands: Kluwer.
- Jacobs, G. H., Birch, D. G., & Blakeslee, B. (1982). Visual acuity and contrast sensitivity in tree squirrels. Behavioural Processes, 7, 367–375.
- Jacobs, G. H., Blakeslee, B., McCourt, M. E., & Tootell, R. B. H. (1980). Visual sensitivity of ground squirrels to spatial and temporal luminance variations. Journal of Comparative Physiology, 136, 291–299.
- Jacobs, G. H., & Deegan, J. F., II. (1999). Uniformity of colour vision in Old World monkeys. Proceedings of the Royal Society of London, 266B, 2023–2028.
- Jacobs, G. H., Deegan, J. F., II, Neitz, J. A., Crognale, M. A., & Neitz, M. (1993). Photopigments and color vision in the nocturnal monkey, Vision Research, 33, 1773–1783.
- Jacobs, G. H., Neitz, M., & Neitz, J. (1996). Mutations in S-cone pigment genes and the absence of colour vision in two species of nocturnal primate. Proceedings of the Royal Society of London, 263B, 705–710.
- Jerlov, N. G. (1976). Marine optics. Amsterdam: Elsevier.
- Kevan, P. G., & Backhaus, W. G. K. (1998). Color vision: Ecology and evolution in making the best of the photic environment. In W. G. K. Backhaus, R. Kliegl, & J. S. Werner (Eds.), Color vision: Perspectives from different disciplines (pp. 163–183). Berlin: Walter de Gruyter.
- Kirschfeld, K. (1976). The resolution of lens and compound eyes. In F. Zettler & R. Weiler (Eds.), Neural principles in vision (pp. 354–370). Berlin: Springer-Verlag.
- Labhart, T., & Meyer, E. P. (1999). Detectors for polarized skylight in insects: A survey of ommatidial specializations in the dorsal rim area of the compound eye. Microscopy Research and Technique, 47, 368–379.
- Lamb, T. D. (1995). Photoreceptor spectral sensitivities: Common shape in the long-wavelength range. Vision Research, 35, 3083– 3091.
- Land, M. F. (1965). Image formation by a concave reflector in the eye of the scalop, Pecten maximus. Journal of Physiology, 179, 138–153.
- Land, M. F. (1991). Optics of the eyes of the animal kingdom. In J. R. Cronly-Dillon & R. L. Gregory (Eds.), Evolution of the eye and visual system (Vol. 2, pp. 118–135). London: Macmillan Press.
- Land, M. F. (1997). Visual acuity in insects. Annual Review of Entomology, 42, 147–177.
- Land, M. F. (1999a). Compound eye structure: Matching eye to environment. In S. N. Archer, M. B. A. Djamgoz, E. R. Loew, J. C. Partridge, & S. Vallerga (Eds.), Adaptive mechanisms in the ecology of vision (pp. 51–71). Dordrecht, The Netherlands: Kluwer.
- Land, M. F. (1999b). Motion and vision: Why animals move their eyes. Journal of Comparative Physiology, 185A, 341–352.
- Land, M. F., & Collett, T. F. (1974). Chasing behaviour of houseflies (Fannia canicularis). Journal of Comparative Physiology, 89, 331–357.
- Land, M. F., & Eckert, H. (1985). Maps of the acute zones of fly eyes. Journal of Comparative Physiology, 156A, 525–538.
- Langston, A., Casagrande, V. A., & Fox, R. (1986). Spatial resolution of the galago. Vision Research, 26, 791–796.
- Li, W.-H. (1995). So, what about the molecular clock hypothesis? Current Opinion in Genetics and Development, 3, 896–901.
- Locket, N. A. (1980). Some advances in coelacanth biology. Proceedings of the Royal Society, London, 208B, 265–307.
- Lucas, P. W., Darvell, B. W., Lee, P. K. D., Yuen, T. D. B., & Choong, M. F. (1998). Colour cues for leaf food selection by long-tailed macaques (Macaca fascicularis) with a new suggestion for the evolution of trichromatic colour vision. Folia Primatologica, 69, 139–152.
- Maffei, L., Fiorentini, A., & Bisti, S. (1990). The visual acuity of the lynx. Vision Research, 30, 527–528.
- Marshall, N. J. (2000). Communication and camouflage with the same “bright” colours in reef fishes. Philosophical Transactions of the Royal Society, London, 355B, 1243–1248.
- Martin, G. R., & Gordon, I. E. (1974). Visual acuity in the tawny owl (Strix aluco). Vision Research, 14, 1393–1397.
- Maximov, V. V. (2000). Environmental factors which may have led to the appearance of colour vision. Philosophical Transactions of the Royal Society, London, 355B, 1239–1242.
- Menzel, R., & Backhaus, W. (1991). Colour vision in insects. In P. Gouras (Ed.), The perception of colour (pp. 262–293). Boca Raton, FL: CRC Press.
- Merigan, W. H. (1976). The contrast sensitivity of the squirrel monkey (Saimiri sciureus). Vision Research, 16, 375–379.
- Mollon, J. D. (1991). Uses and evolutionary origins of primate colour vision. In J. R. Cronly-Dillon & R. L. Gregory (Eds.), Evolution of the eye and visual system (pp. 306–319). Boca Raton, FL: CRC Press.
- Nathans, J., Thomas, D., & Hogness, D. S. (1986). Molecular genetics of human color vision: the genes encoding blue, green and red pigments. Science, 232, 193–202.
- Neitz, J., Carroll, J., & Neitz, M. (2001). Color vision: Almost reason enough for having eyes. Optics and Photonics News, 12, 26–33.
- Neumeyer, C. (1998). Color vision in lower vertebrates. In W. G. K. Backhaus, R. Kliegl, & J. S. Werner (Eds.), Color vision: Perspectives from different disciplines (pp. 149–162). Berlin: Walter de Gruyter.
- Northmore, D. P., & Dvorak, C. A. (1979). Contrast sensitivity and acuity of the goldfish. Vision Research, 19, 255–261.
- Northmore, D. P., & Granda, A. M. (1991). Refractive state, contrast sensitivity, and resolution in the freshwater turtle, Pseudemys scripta elegans, determined by tectal visual-evoked potentials. Visual Neuroscience, 7, 619–625.
- Odom, J. V., Bromberg, N. M., & Dawson, W. W. (1983). Canine visual acuity: Retinal and cortical field potentials evoked by pattern stimulation. American Journal of Physiology, 245, R637–R641.
- Osorio, D., & Vorobyev, M. (1996). Colour vision as an adaptation to frugivory in primates. Proceedings of the Royal Society of London, 263B, 593–599.
- Palacios, A. G., Varela, F. J., Srivastava, R., & Goldsmith, T. H. (1998). Spectral sensitivity of cones in the goldfish, Carassius auratus. Vision Research, 38, 2135–2146.
- Parker, A. R. (1998). Colour in Burgess shale animals and the effect of light on evolution in the Cambrian. Proceedings of the Royal Society of London, 265B, 967–972.
- Peichl, L., Behrmann, G., & Kroger, R. H. H. (2001). For whales and seals the ocean is not blue: A visual pigment loss in marine mammals. European Journal of Neuroscience, 13, 1520–1528.
- Petry, H. M., Fox, R., & Casagrande, V. A. (1984). Spatial contrast sensitivity of the tree shrew. Vision Research, 24, 1037–1042.
- Pointer, M. R., & Attridge, G. G. (1998). The number of discernable colours. Color Research and Application, 23, 52–54.
- Regan,B.C.,Julliot,C.,Simmen,B.,Vienot,F.,Charles-Dominique, P., & Mollon, J. D. (1998). Frugivory and colour vision in Alouatta seniculus, a trichromatic platyrrhine monkey. Vision Research, 38, 3321–3327.
- Rehkamper, G., Perrey, A., Werner, C. W., Opfermann-Rungeler, C., & Gorlach, A. (2000). Visual perception and stimulus orientation in cattle. Vision Research, 40, 2489–2497.
- Reymond, L. (1985). Spatial visual acuity of the eagle Aguila audax: A behavioural, optical and anatomical investigation. Vision Research, 25, 1477–1491.
- Reymond, L. (1987). Spatial acuity of the falcon, Falco berigora: A behavioural, optical and anatomical investigation. Vision Research, 27, 1859–1874.
- Riggs, L. A., Ratliff, F., Cornsweet, J. C., & Cornsweet, T. N. (1953). The disappearance of steadily fixated test objects. Journal of the Optical Society of America, 43, 495–501.
- Rossel, S. (1986). Binocular spatial localization in the praying mantis. Journal of Experimental Biology, 120, 265–281.
- Rossel, S. (1993). Navigation by bees using polarized skylight. Comparative and Biochemical Physiology, 104A, 695–708.
- Schusterman, R. J., & Balliet, R. F. (1971). Aerial and underwater visual acuity in the California sea lion (Zalophus californianus) as a function of luminance. Annual of the New York Academy of Sciences, 188, 37–46.
- Shand, J., Chin, S. M., Harman, A. M., & Collin, S. P. (2000). The relationship between the position of the retinal area centralis and feeding behaviour in juvenile black bream Acanthopagarus butcheri (Sparidae: Teleostei). Philosophical Transactions of the Royal Society, London, 355B, 1183–1186.
- Shashar, N., & Cronin, T. W. (1996). Polarization contrast vision in Octopus. Journal of Experimental Biology, 199, 999–1004.
- Silveira, L. C., Picanco, C. W., & Oswaldo-Cruz, E. (1982). Contrast sensitivity function and visual acuity of the opossum. Vision Research, 22, 1371–1377.
- Stavenga, D. G., Smits, R. P., & Hoenders, B. J. (1993). Simple exponential functions describing the absorbance bands of visual pigment spectra. Vision Research, 33, 1011–1017.
- Sumner, P., & Mollon, J. D. (2000a). Catarrhine photopigments are optimized for detecting targets against a foliage background. Journal of Experimental Biology, 203, 1963–1986.
- Sumner, P., & Mollon, J. D. (2000b). Chromaticity as a signal of ripeness in fruits taken by primates. Journal of Experimental Biology, 203, 1987–2000.
- Szel, A., Rohlich, P., Caffe, A. R., & van Veen, T. (1996). Distribution of cone photoreceptors in the mammalian retina. Microscopy Research and Technique, 35, 445–462.
- Timney, B., & Keil, K. (1992). Visual acuity in the horse. Vision Research, 32, 2289–2293.
- Tucker, V. A. (2000). The deep fovea, sideways vision and spiral flight paths in raptors. Journal of Experimental Biology, 203, 3745–3754.
- Uhlrich, D. J., Essock, E. A., & Lehmkule, S. (1981). Cross-species correspondence of spatial contrast sensitivity functions. Behavioural Brain Research, 2, 291–299.
- Vorobyev, M., & Osorio, D. (1998). Receptor noise as a determinant of colour thresholds. Proceedings of the Royal Society of London, 265B, 351–358.
- Vorobyev, M., Osorio, D., Bennett, A. T. D., Marshall, N. J., & Cuthill, I. C. (1998). Tetrachromacy, oil droplets and bird plumage colours. Journal of Comparative Physiology, 183A, 621–633.
- Wagner, H. (1986). Flight performance and visual control of flight of the free-flying house (Musca domestica L.): II. Pursuit of targets. Philosophical Transactions of the Royal Society, London, 312B, 553–579.
- Walls, G. L. (1942). The vertebrate eye and its adaptive radiation. Bloomfield Hills, Michigan: Cranbrook Institute of Science.
- Warrant, E. J. (1999). Seeing better at night: Life style, eye design and the optimum strategy of spatial and temporal summation. Vision Research, 39, 1611–1630.
- Waterman, T. H. (1984). Natural polarized light and vision. In M. A. Ali (Ed.), Photoreception and vision in invertebrates (pp. 63– 114). New York: Plenum Press.
- Yokoyama, S., Zhang, H., Radlwimmer, F. B., & Blow, N. S. (1999). Adaptive evolution of color vision of the Comoran coelacanth (Latimeria chalumnae). Proceedings of the National Academy of Sciences, USA, 96, 6279–6284.
ORDER HIGH QUALITY CUSTOM PAPER

Always on-time

Plagiarism-Free

100% Confidentiality